
Dalrymple Bay Infrastructure just announced a 28.62 cent per security distribution for FY2026/27, an 8.5% increase on the prior corresponding period. Most investors will register the headline number. Fewer will recognise that the increase was structurally locked in before the financial year even started.
On 19 May 2026, DBI released its quarterly update disclosing an 8.1% rise in its Terminal Infrastructure Charge (TIC) to $4.02 per tonne, effective 1 July 2026. The connection between that per-tonne fee adjustment and the distribution increase is not coincidental. It is the entire business model.
What follows is an examination of the contractual architecture behind DBI’s revenue: how the TIC’s two components (the CPI-linked base fee and the NECAP capital recovery charge) work together to produce distributions that grow with inflation and capital deployment rather than coal prices or throughput volumes.
Why DBI’s revenue does not depend on coal prices
The instinct is understandable. A company operating Australia’s largest coal export terminal should, logically, be a coal bet. That instinct is wrong.
DBI collects its Terminal Infrastructure Charge on contracted annual capacity, not on actual tonnes shipped. The structure is take-or-pay: customers including Peabody Energy, Stanmore Resources, and Whitehaven Coal pay for their contracted capacity whether or not they use it. As at the 2025 annual result, DBI held 84.2 million tonnes of fully contracted take-or-pay capacity.
Take-or-pay contract structures transfer utilisation risk from the infrastructure operator to the customer and are consistently valued at a premium to usage-based revenue arrangements, a distinction that applies across asset classes from coal terminal capacity agreements to AI network connectivity contracts.
Take-or-pay principle: DBI bills contracted capacity regardless of actual shipment volumes. Revenue is a function of agreements, not operations.
The remaining revenue lines net to zero for distribution purposes:
- Terminal Infrastructure Charge (TIC): The sole source of distributable earnings, collected on contracted capacity
- Handling revenue: Totalled $351.7 million in FY25, offset entirely by handling costs of $351.7 million
- Capital works revenue: Totalled $185.2 million in FY25, offset entirely by capital works costs of $185.2 million
Terminal capacity has grown from 14.5 million tonnes per annum in 1983 to 85 million tonnes currently, but it is the contracted capacity, not the physical throughput, that determines revenue. Volume risk sits with the customers, not with DBI.
When big ASX news breaks, our subscribers know first
The two components that determine what the TIC charges each year
The TIC is not a single number adjusted at management’s discretion. It is a formula with two moving parts, and under normal conditions both parts move upward.
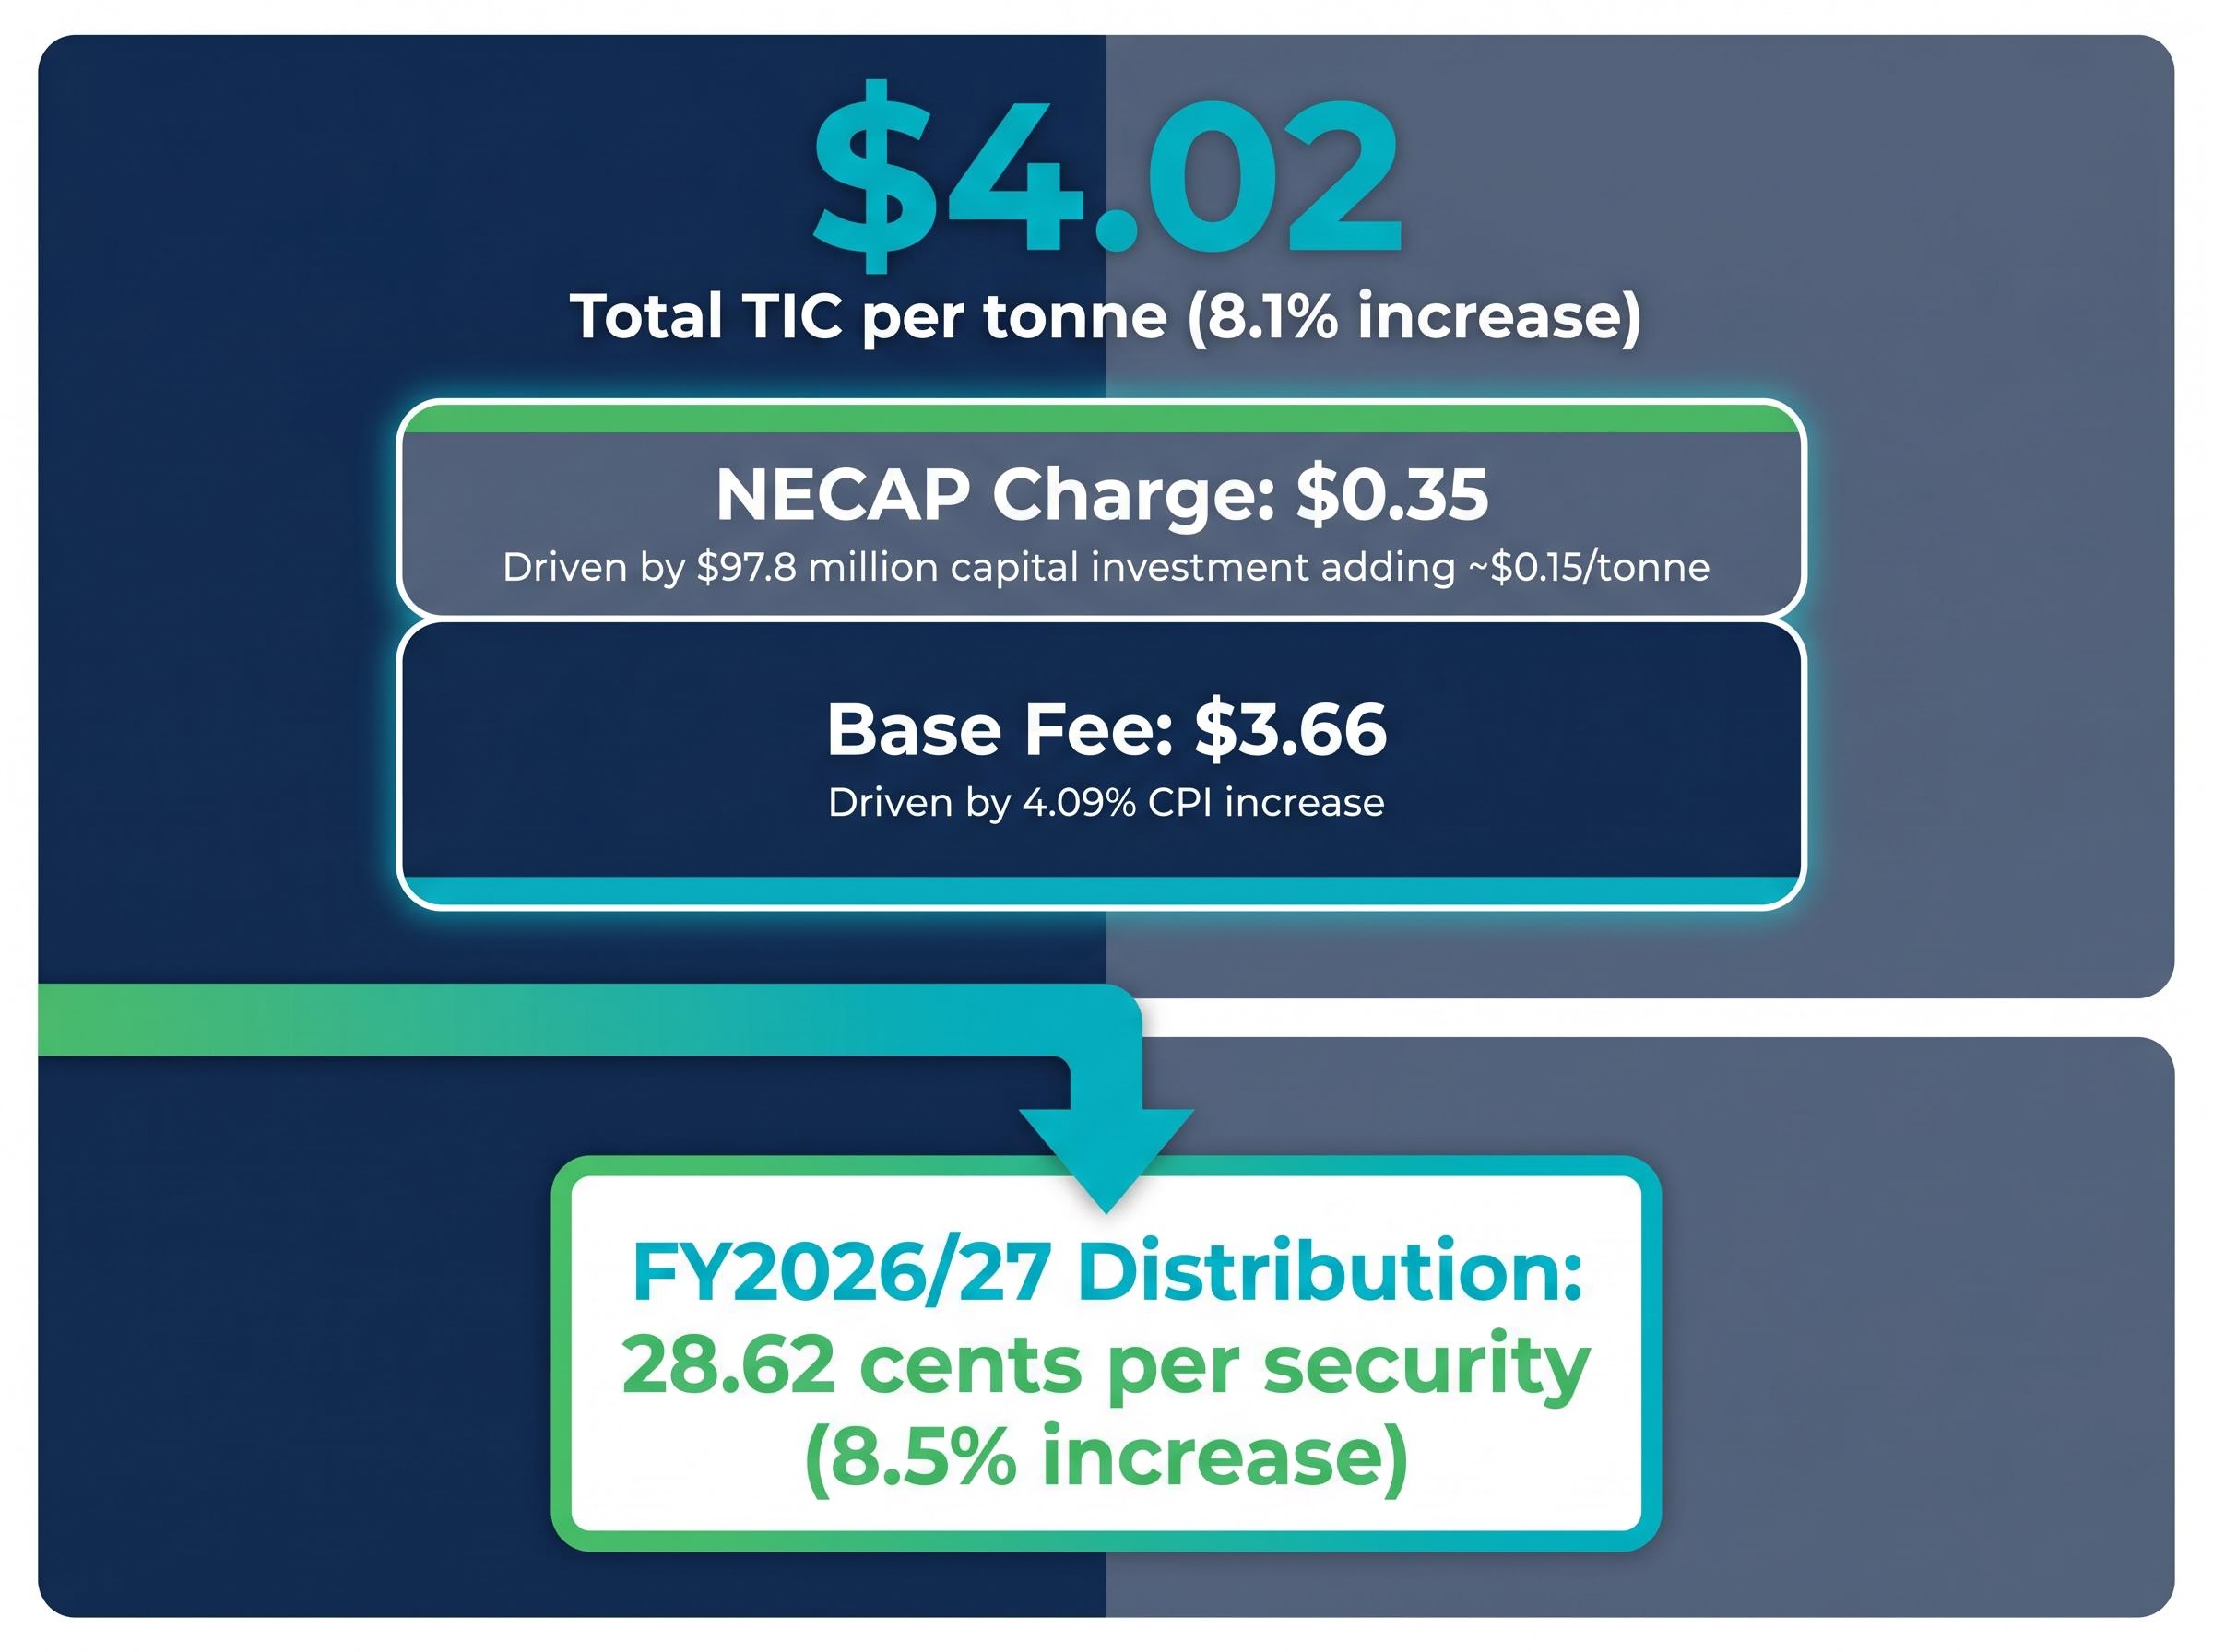
| Component | FY2026/27 Rate ($ per tonne) | Change Driver |
|---|---|---|
| Base Fee | $3.66 | CPI-linked annual adjustment (4.09% increase) |
| NECAP Charge | $0.35 | Capital investment added to recoverable asset base |
| QCA Levy | Negligible | Regulatory cost recovery |
| Total TIC | $4.02 | 8.1% increase on prior year |
How the base fee adjusts each year
The base fee resets each 1 July based on the prior year’s Consumer Price Index outcome. There is no renegotiation, no regulatory approval required for the annual adjustment. Inflation flows directly and automatically into DBI’s per-tonne pricing.
CPI-indexed infrastructure models have become one of the primary drivers of the ASX industrials sector’s five-year outperformance over the broader ASX 200, because automatic annual price resets remove the negotiation risk that caps revenue growth for operators without contractual inflation pass-through.
The implication for investors is direct: elevated inflation periods produce above-average TIC growth. The 4.09% base fee increase for FY2026/27 reflects exactly that mechanism at work.
How the NECAP charge grows with investment
NECAP stands for Non-Expansion Capital Expenditure. Every dollar of qualifying capital expenditure DBI incurs is added to a recoverable asset base, on which DBI earns an ongoing return linked to bond yields. That return is recovered through the NECAP component of the TIC.
Over the past year, $97.8 million of additional capital investment was added to the NECAP asset base. That addition is the direct cause of the approximately $0.15 per tonne increase in the NECAP charge. As long as DBI continues investing in qualifying capital works and bond yields remain at current levels, this component compounds.
From fee structure to securityholder distributions: tracing the connection
The 8.5% distribution increase is not a management decision made in isolation. It is arithmetic.
Because handling costs, capital works costs, and operating expenses all pass through at zero margin, TIC revenue after those pass-throughs is the primary source of distributable cash. The pathway is mechanical:
- TIC revenue is collected on 84.2 million tonnes of contracted capacity at $4.02 per tonne
- Pass-through costs (handling, capital works, operating expenses) are removed
- Remaining revenue covers DBI’s debt service obligations
- Residual cash flows to securityholders as distributions, paid quarterly in four equal instalments
FY2026/27 distribution: 28.62 cents per security, representing an 8.5% increase on the prior corresponding period.
The TIC increase is not the only tailwind. Debt refinancing completed over the past year, including a $350 million Australian Medium-Term Note priced on 13 March 2026, is projected to deliver approximately $75 million in interest cost savings. That saving flows directly to distributable cash alongside the higher TIC.
FY25 provided the precedent: Funds From Operations (FFO) rose 10.6% while distributions per security grew 11.9%. The pattern is structural, not episodic.
How to use dividend yield as a valuation signal for a contracted infrastructure asset
For most equities, yield is an incomplete valuation signal because future earnings are uncertain. DBI is different. The contracted, take-or-pay revenue base means cash flow visibility is unusually high, making yield a more direct measure of value than price-to-earnings ratios or discounted cash flow models.
Contracted infrastructure assets like DBI sit in a narrow category where dividend yield as a valuation signal carries more weight than conventional earnings multiples, precisely because the cash flow underpinning each distribution is secured years in advance through take-or-pay agreements rather than exposed to operational volume risk.
Two yield thresholds emerge as practical benchmarks:
- Below approximately 5%: The forward yield signals stretched valuation, where investors are paying a premium for distribution certainty that compresses income returns
- Approximately 5.5% to 6.0%: The forward yield signals an attractive entry range for income-focused capital
At the 26 May 2026 share price of $5.48, the implied forward yield on the 28.62 cent distribution is approximately 5.2%, sitting between the two thresholds.
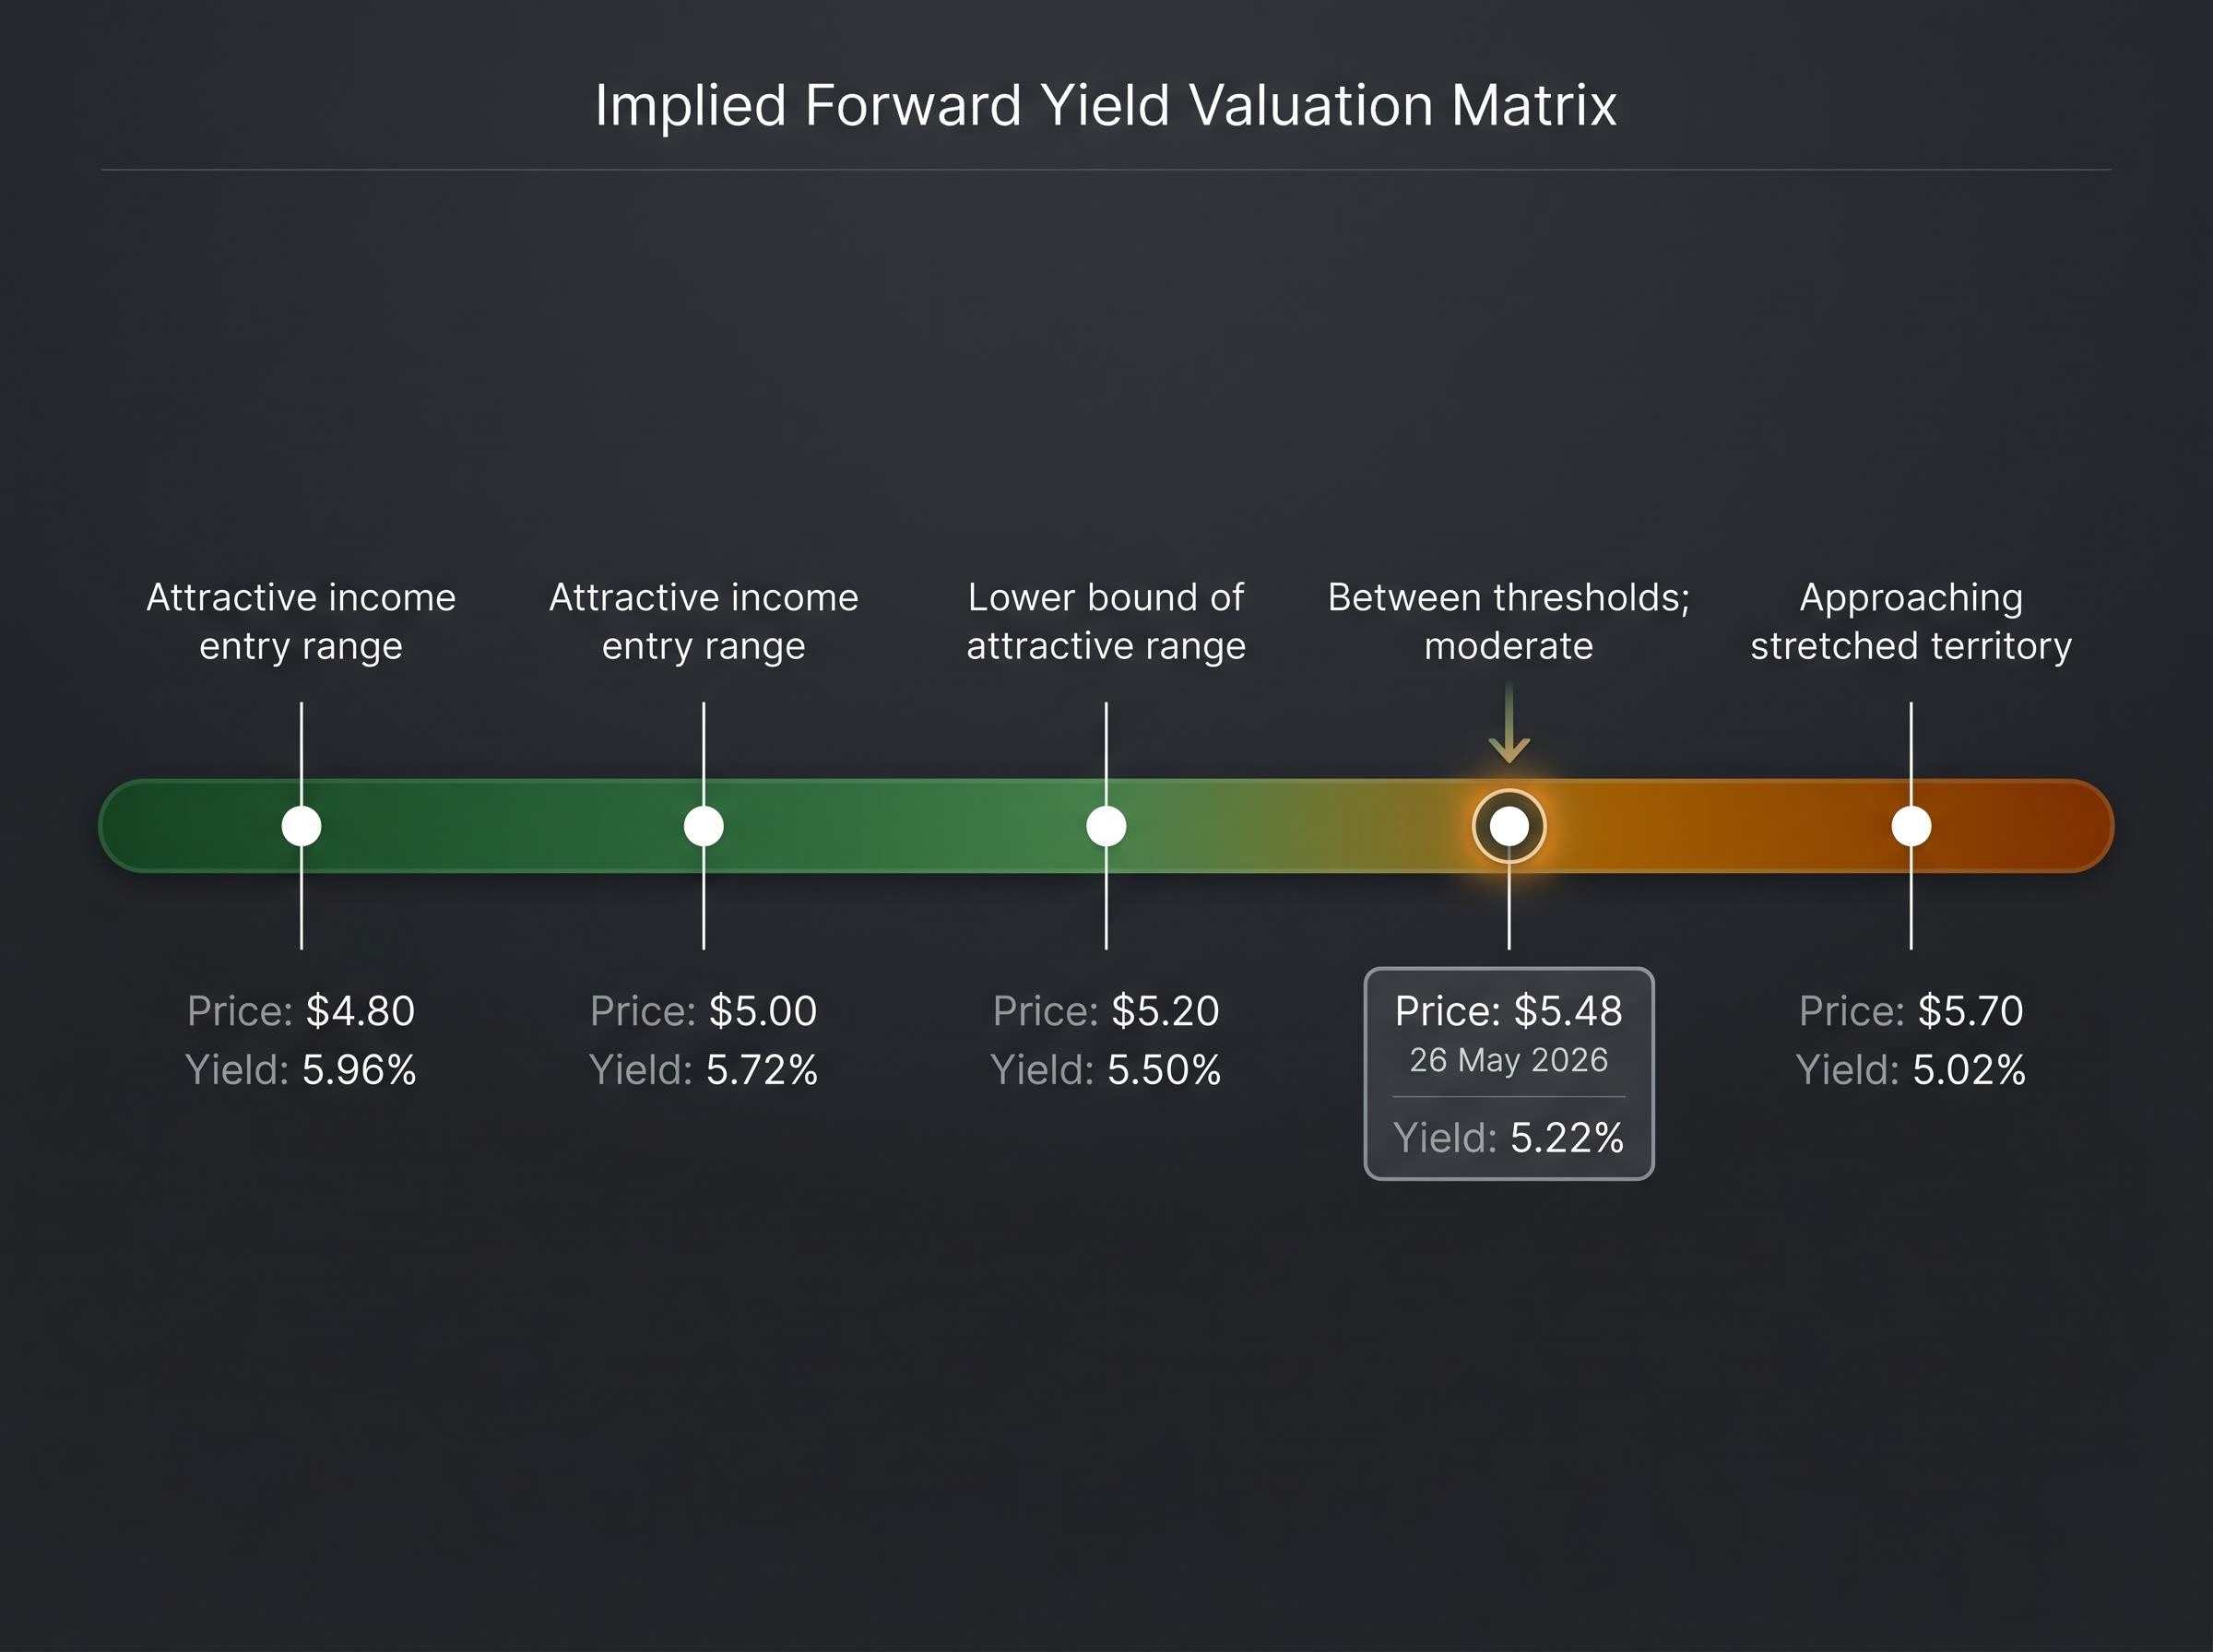
| Share Price | Implied Forward Yield | Valuation Signal |
|---|---|---|
| $4.80 | 5.96% | Attractive income entry range |
| $5.00 | 5.72% | Attractive income entry range |
| $5.20 | 5.50% | Lower bound of attractive range |
| $5.48 | 5.22% | Between thresholds; moderate |
| $5.70 | 5.02% | Approaching stretched territory |
DBI’s share price has risen approximately 34% over the prior twelve months and roughly doubled over three years. Intelligent Investor published a BUY recommendation at a review price of $5.01 on 4 March 2026, noted here as historical context rather than a current assessment.
What Brookfield’s exit tells investors about DBI’s price resilience
Two block trades by Brookfield in 2025 tested whether DBI’s yield-driven valuation could absorb large, technically motivated sell-downs. Both times, it did.
| Date | Stake Sold | Transaction Value | Discount to Close | Day-of Price Fall | Recovery Period |
|---|---|---|---|---|---|
| 12-13 June 2025 | 23.2% | ~$428 million | 7.9% ($3.72/share) | 6.1% | ~6 trading sessions |
| 9 September 2025 | ~26% | $527 million | 6.9% ($4.05/share) | 6.4% | ~9 trading sessions |
Neither trade reflected a change in DBI’s business or earnings outlook. Both were structural sell-downs driven by discount pricing mechanics. The recovery pattern in each case was identical: the temporary price decline pushed DBI’s implied yield higher, which attracted income-seeking buyers who corrected the price within one to two weeks.
Three implications follow for current investors:
- No remaining Brookfield overhang: With Brookfield fully exited, comparable block-trade technical pressure is no longer a feature of the register
- Yield-driven price recovery observed twice: Income-seeking capital actively supports DBI’s price around yield thresholds, consistent with the valuation framework
- Lease structure unchanged throughout: DBI’s 99-year lease (50-year initial term plus 49-year renewal option with the Queensland Government) provided the underlying asset stability that made the recovery possible
The structural case for DBI as an income holding in an Australian portfolio
Three structural pillars support DBI’s distribution profile:
- CPI linkage: The base fee adjusts automatically with inflation each year, protecting real income returns without renegotiation
- NECAP compounding: Every dollar of qualifying capital expenditure adds to a recoverable asset base earning a bond-yield-linked return, providing distribution growth even when inflation moderates
- Take-or-pay certainty: Revenue is a function of contracted capacity, not operational throughput, insulating distributable cash from volume fluctuations
The $75 million in projected interest cost savings from recent debt refinancing adds a near-term earnings tailwind that does not depend on TIC mechanics, reinforcing distribution visibility over the next several years.
The tension for prospective investors is straightforward: DBI’s share price has roughly doubled over three years and risen approximately 32% in twelve months. Forward distributions of 28.62 cents per security are growing, but the yield at current prices sits at approximately 5.2%, below the 5.5-6.0% range that has historically attracted income-focused capital.
Income-oriented investors evaluating DBI need to hold two ideas simultaneously. The contracted fee mechanism is structurally sound, and the distribution growth rate is well supported. Whether the current share price offers sufficient income return depends on the individual investor’s yield threshold.
For income-oriented investors wanting to stress-test whether DBI’s distribution profile warrants a place as a core portfolio holding versus a satellite allocation, our deep-dive into dividend investing strategy examines the conditions under which yield-focused positions earn their allocation, including quality screening, payout sustainability, and the portfolio sizing discipline that separates income investing from yield-chasing.
A contracted fee mechanism built for predictable growth, not coal cycle speculation
DBI’s 8.1% TIC increase and 8.5% distribution growth are not the product of a favourable coal market. They are the direct output of a contracted fee architecture where CPI linkage lifts the base and capital deployment lifts the NECAP charge.
The yield valuation framework outlined above provides income-focused investors with a practical tool for monitoring whether the share price remains within an appropriate range. At $5.48, the forward yield of approximately 5.2% sits in moderate territory, neither stretched nor at the attractive entry point that the Brookfield block trades briefly created.
As long as DBI continues investing in NECAP-qualifying capital expenditure and inflation remains positive, both components of the TIC have structural reasons to grow each year. The distribution follows.
This article is for informational purposes only and should not be considered financial advice. Investors should conduct their own research and consult with financial professionals before making investment decisions. Past performance does not guarantee future results. Financial projections are subject to market conditions and various risk factors.