
Most Australian retail investors assessing ASX bank stocks start and finish their analysis with two numbers: dividend yield and share price movement. Yet two metrics that often signal long-term performance more reliably receive almost no attention in mainstream coverage: employee culture scores and regulatory capital buffers.
Bank of Queensland (ASX: BOQ) provides a timely case study. Its workplace culture score on Seek sits at 2.6 out of 5, against a sector benchmark of 3.1. Its Common Equity Tier 1 (CET1) capital ratio of 10.7% for its most recent full financial year sits below the sector average. Neither figure appears in most retail commentary on the stock, yet both carry direct implications for dividend sustainability, earnings trajectory, and downside risk.
This article unpacks what these two indicators actually measure, why they matter for long-term ASX bank investors, and how to use them alongside a dividend discount model to build a more complete picture of a regional bank stock like BOQ.
Why dividend yield alone is an incomplete lens for ASX bank stocks
Dividend yield is the first number most Australian retail investors check when evaluating a bank stock, and for good reason. Banks distribute a large share of earnings as dividends, franking credits enhance after-tax returns, and yield provides a simple comparison across the sector. The appeal is genuine.
The limitation is equally real. Yield is a backward-looking output. It tells an investor what the bank paid last year, not whether the bank can sustain that payment next year. A bank with a compressed revenue engine and a thin capital buffer can maintain its dividend for a period, right up until it cannot.
Yield tells an investor what a bank paid; reading ASX bank results through NIM, ROE, and CET1 in sequence reveals whether the earnings base generating that payment is stable, improving, or under structural pressure.
BOQ illustrates the gap between yield appearance and underlying health:
- Net interest margin (NIM): BOQ’s 1.56% versus the peer average of 1.78%, indicating the revenue engine generating those dividends is under strain.
- Return on equity (ROE): BOQ’s 4.7% versus the sector average of 9.35%, revealing that shareholder capital is producing roughly half the returns of peers.
- Dividend per share: $0.34 (most recent full financial year), paid from an earnings base that is materially weaker than the sector.
BOQ’s return on equity of 4.7% sits at roughly half the sector average of 9.35%, a gap that raises direct questions about whether the current dividend level is sustainable without improvement in underlying profitability.
The two forward-looking inputs explored in the sections that follow, CET1 capital adequacy and workplace culture scores, function as diagnostics for earnings durability rather than curiosities. They help answer the question yield alone cannot: what is sustaining the distribution, and how much stress can the bank absorb before it is cut?
When big ASX news breaks, our subscribers know first
What a bank’s CET1 ratio actually measures and why investors should care
On a bank’s results page, the CET1 ratio appears as a single percentage. For BOQ, that figure was 10.7% at the end of its most recent full financial year. The number looks straightforward. What it measures is not.
CET1, or Common Equity Tier 1, represents the proportion of a bank’s risk-weighted assets covered by its highest-quality capital, principally ordinary equity and retained earnings. In practical terms, it is the buffer a bank holds to absorb unexpected losses before depositors, bondholders, or the regulator need to intervene.
Australia’s prudential regulator, APRA, revised its capital framework effective 1 January 2023 under updated prudential standards including APS 110 Capital Adequacy. Under this framework, APRA expects major banks to operate above 11% CET1, incorporating the capital conservation buffer and domestic systemically important bank (D-SIB) buffers where applicable. Banks that breach distribution constraints face restrictions on dividend payments.
APRA’s prudential standard APS 110 establishes the capital conservation buffer requirements and the distribution constraint triggers that apply when an authorised deposit-taking institution’s CET1 ratio falls within the buffer range, making it the direct regulatory basis for assessing how close a bank is to dividend restriction territory.
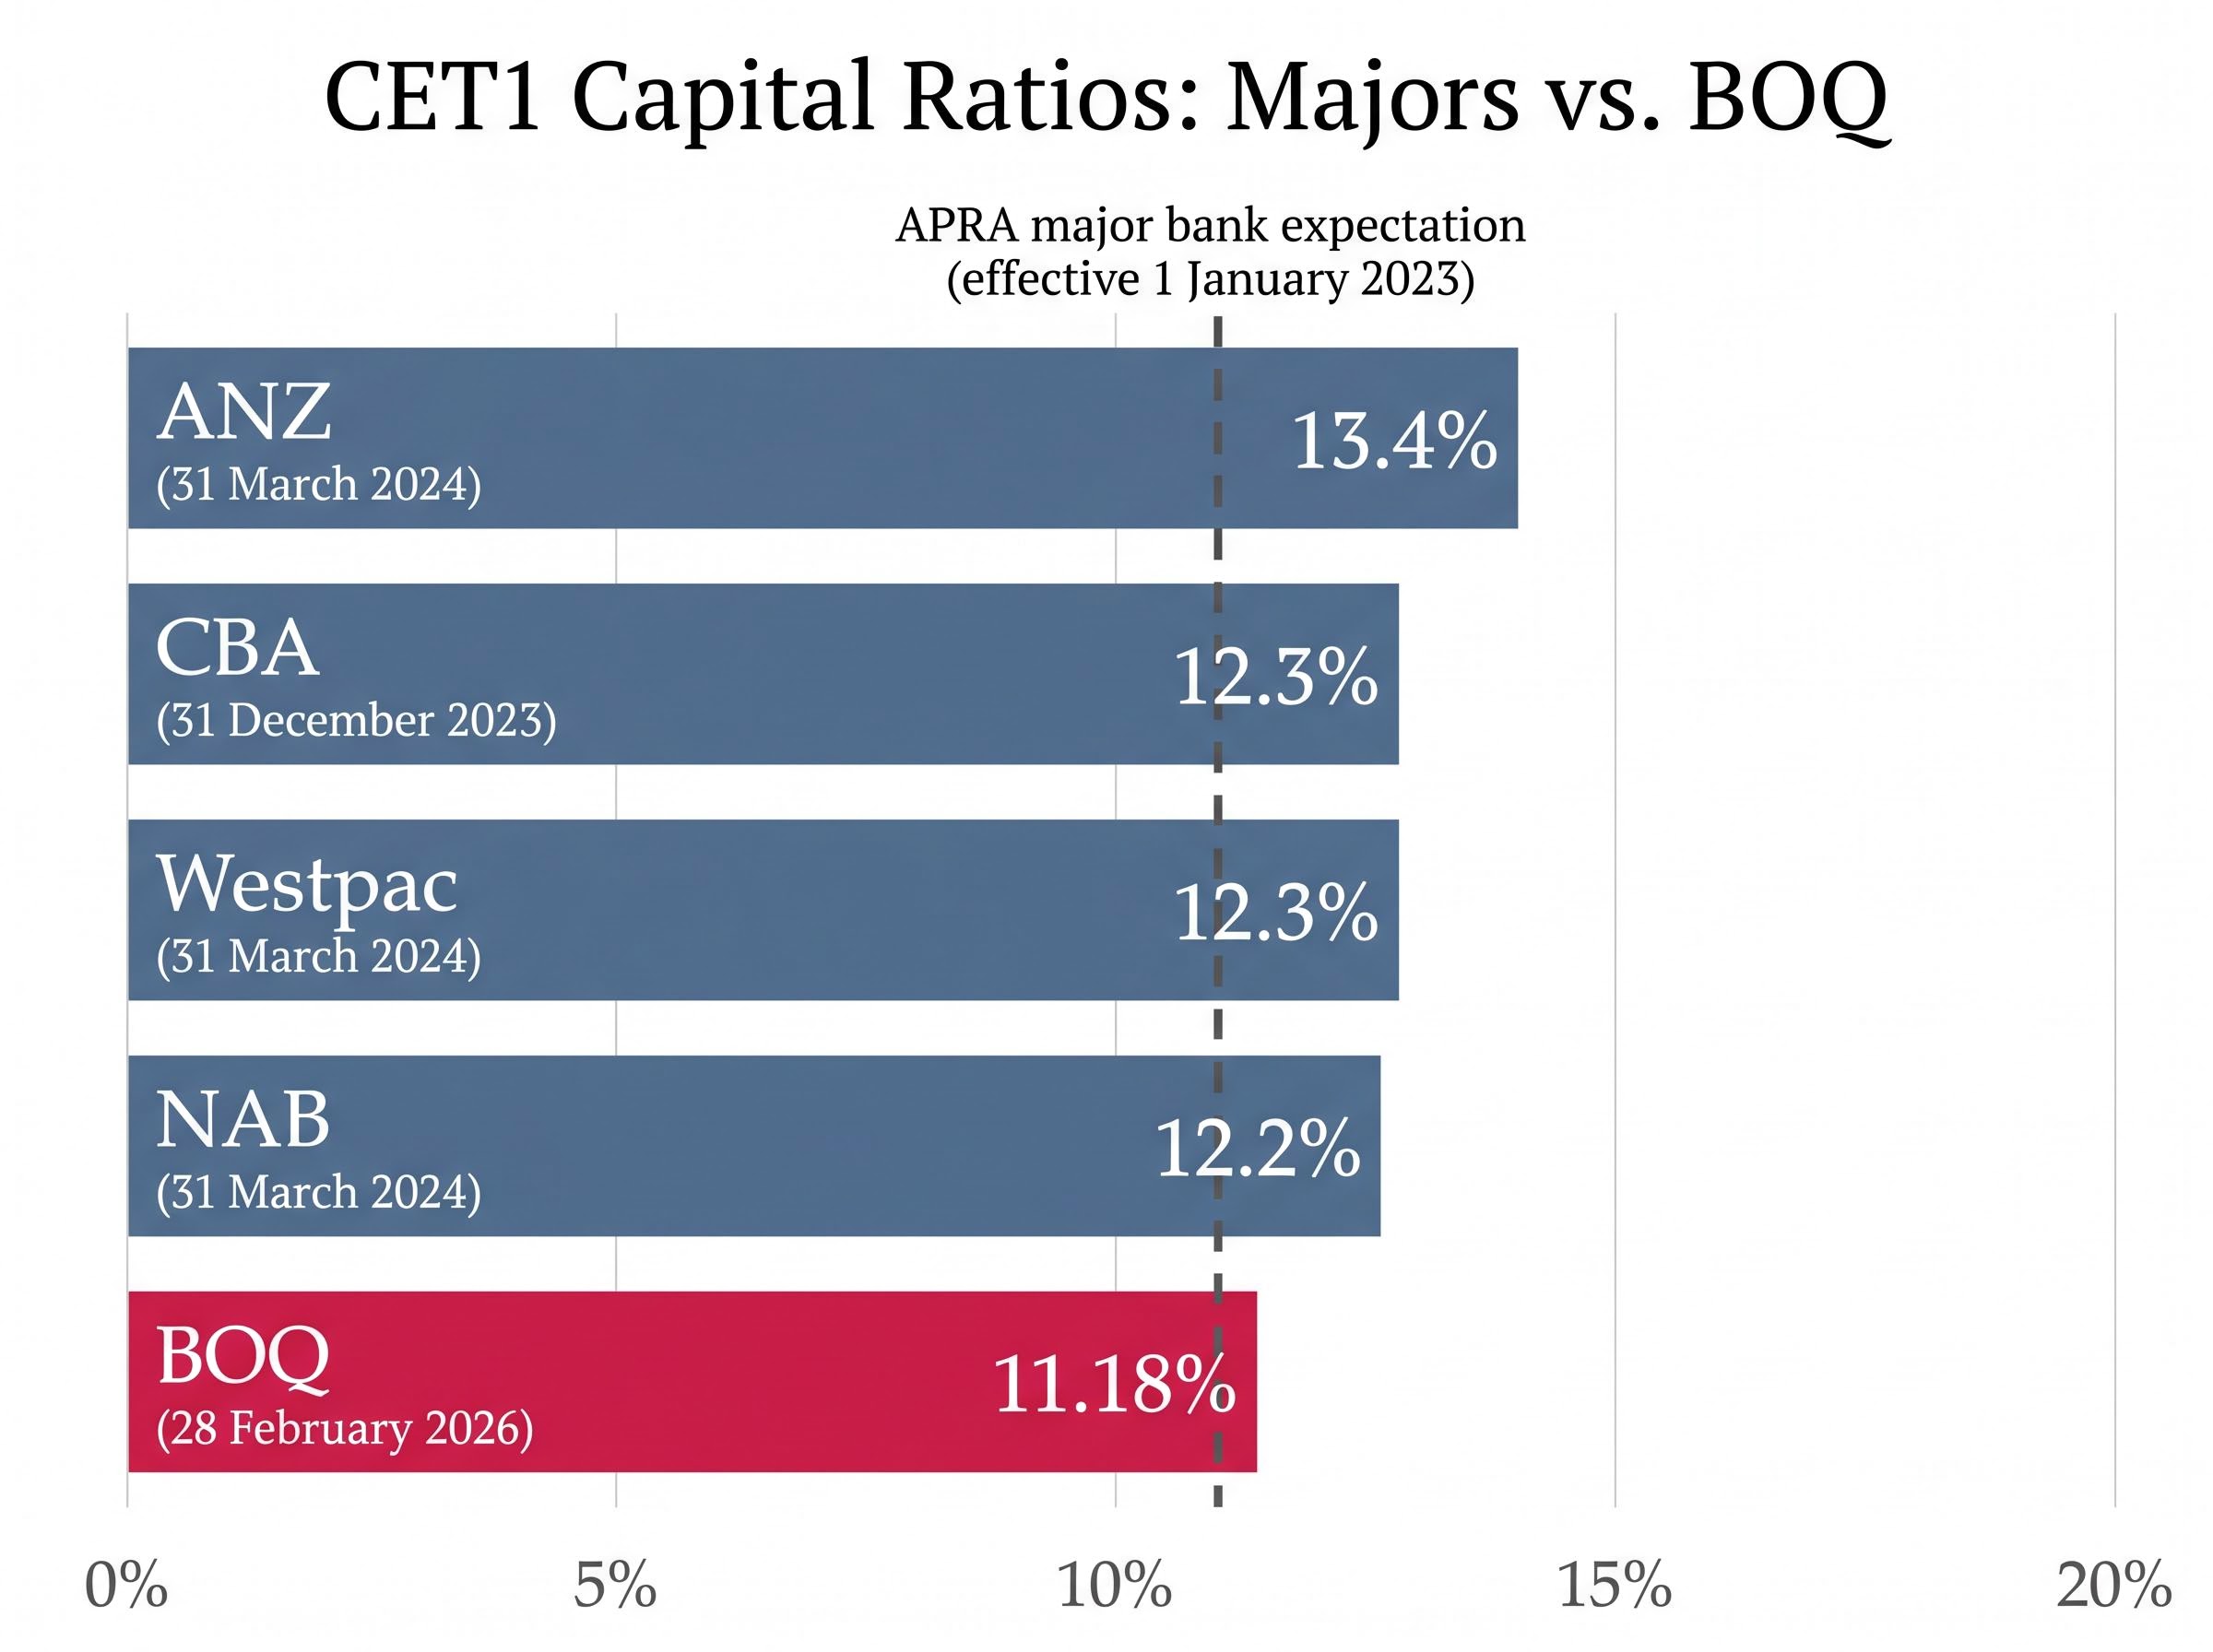
| Bank | CET1 Ratio (%) | Reporting Period |
|---|---|---|
| ANZ | 13.4% | 31 March 2024 |
| CBA | 12.3% | 31 December 2023 |
| Westpac | 12.3% | 31 March 2024 |
| NAB | 12.2% | 31 March 2024 |
| BOQ | 11.18% | 28 February 2026 |
How the CET1 gap between regionals and majors translates to investor risk
The difference between BOQ’s CET1 and the Big Four is not academic. It determines how much stress the bank can absorb before dividend restrictions or equity issuance become necessary.
BOQ’s most recent half-year results (as at 28 February 2026) showed a CET1 of 11.18%, up from 10.7% at the prior full-year mark. The directional improvement is acknowledged, and it reflects management’s stated focus on disciplined capital management. However, the gap to major bank levels of 12-13%+ remains material. In a credit deterioration cycle, that difference translates directly into how many quarters of elevated bad debts a bank can absorb before its distribution capacity is constrained.
For long-term investors, the CET1 ratio functions as a direct indicator of dividend sustainability and downside protection. A bank operating close to regulatory minimums has less room to navigate a downturn without cutting its payout.
How employee culture scores work as a leading indicator in banking
Dismissing employee review platforms as soft HR data is the default reaction. The mechanism linking culture to financial outcomes, though, is concrete enough to warrant a different reading.
Platforms like Seek aggregate employee ratings across dimensions including work environment, management quality, and career development. Scores are constructed from voluntary reviews submitted by current and former employees, producing a composite rating on a five-point scale. The data is imperfect, subject to self-selection bias, and should be treated as directional rather than precise. It is also one of the few publicly available, forward-looking signals on a bank’s operational health.
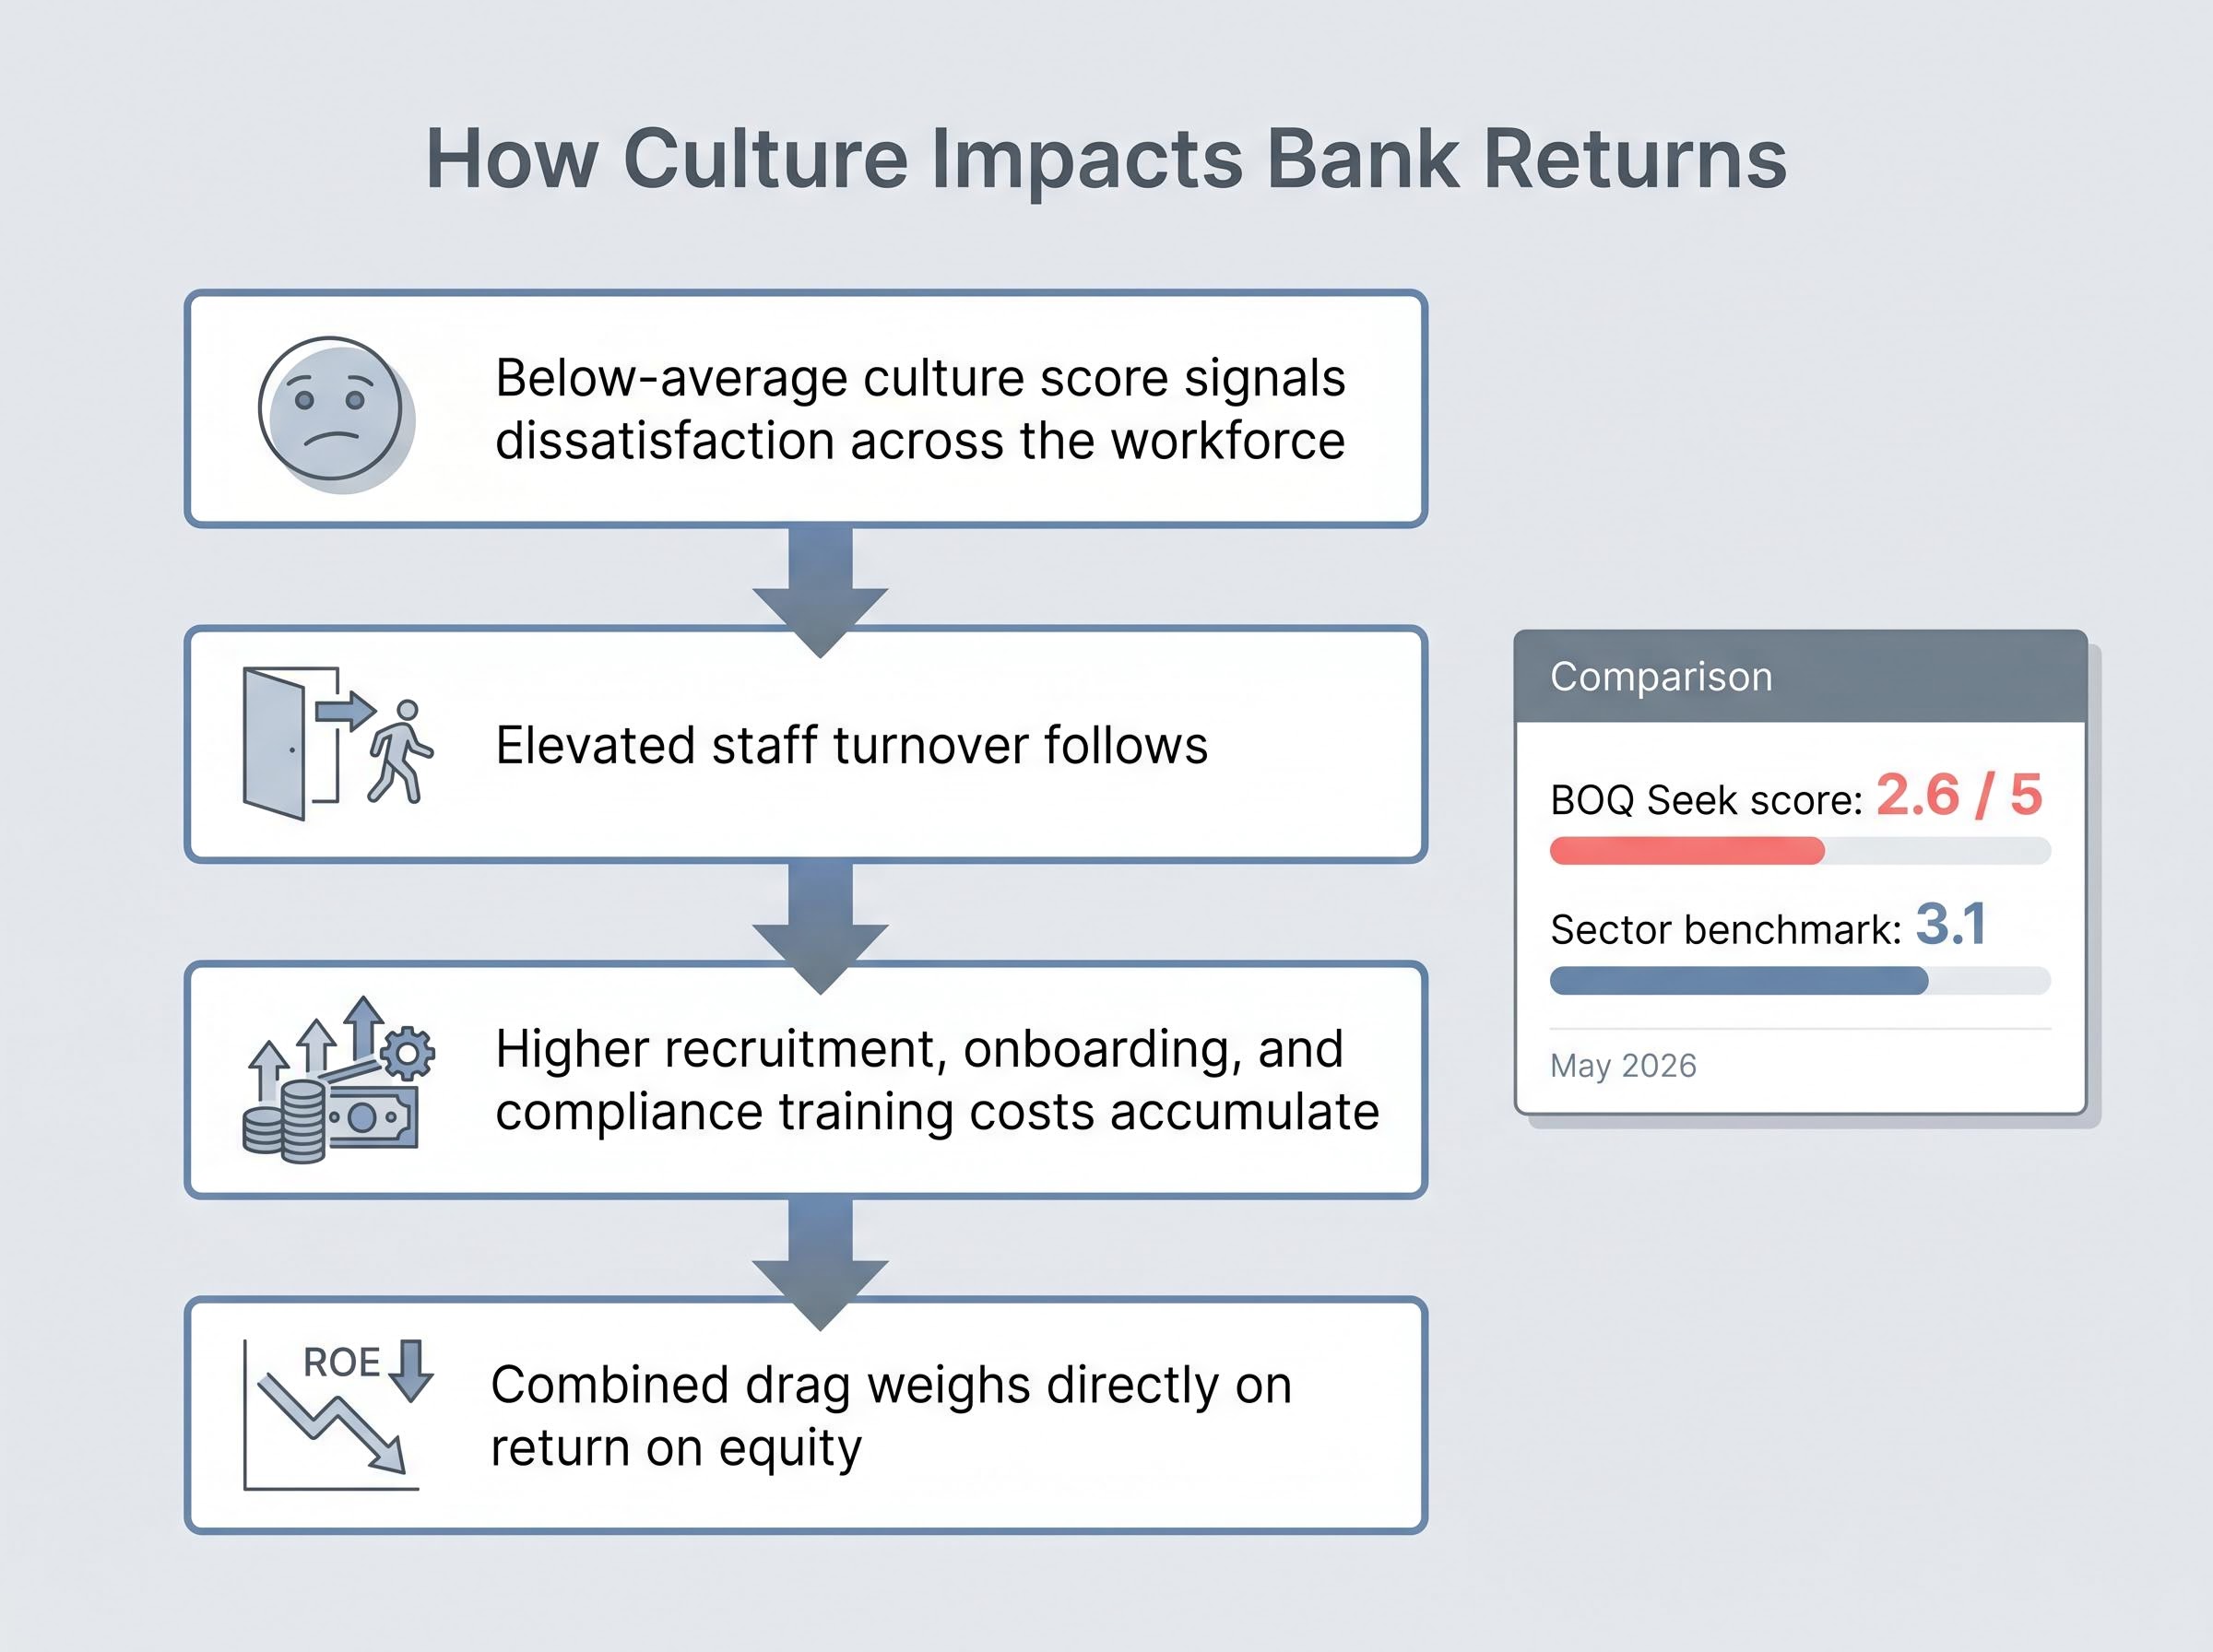
BOQ’s Seek workplace culture score sits at 2.6 out of 5, against a sector benchmark of 3.1, based on the most recently available data as at May 2026.
The causal chain from a low culture score to financial underperformance follows a four-step sequence:
- A below-average culture score signals dissatisfaction across the workforce.
- Elevated staff turnover follows, as experienced employees leave for better-rated employers.
- Higher recruitment, onboarding, and compliance training costs accumulate, particularly in risk and technology functions where replacement is expensive.
- The combined drag weighs directly on return on equity, compounding existing profitability challenges.
BOQ’s cultural challenges carry additional context. Following APRA scrutiny, including scrutiny related to risk governance and an enforceable undertaking process, the bank has been running an active cultural remediation programme. The broader Australian banking sector saw culture risk gain regulatory prominence following the Royal Commission and APRA’s prudential inquiry into CBA.
Research into Australian financial media, broker coverage, and academic publications from 2024-2025 found no examples of employee culture platform scores being explicitly integrated into bank stock valuation frameworks. This absence creates an information asymmetry. Culture metrics are effectively invisible in mainstream valuation, yet a sustained improvement in a bank’s culture score may precede operational stabilisation before it appears in reported earnings.
CET1 and culture scores at ANZ tell a contrasting story: with a CET1 of 12.39% and a Glassdoor rating of 3.7, the major bank illustrates how the same two metrics that flag execution risk at BOQ can, at higher levels, signal a more resilient operational base.
Applying a dividend discount model to a regional bank: BOQ as a worked example
The dividend discount model (DDM) is considered an appropriate valuation tool for ASX bank stocks because dividends are the primary mechanism through which banks return capital to shareholders. Where a technology company might be valued on revenue growth or free cash flow, a bank’s value to its owners flows overwhelmingly through distributions.
The formula is straightforward: Share Price equals Annual Dividend divided by (Risk Rate minus Dividend Growth Rate). The simplicity is deceptive. Small changes in assumptions produce meaningfully different outputs, which is the point of the exercise.
BOQ’s full-year dividend was $0.34 per share (most recently completed full financial year), with a forward estimate of $0.35 per share. Applying a risk rate range of 6% to 11% and a dividend growth rate range of 2% to 4% produces a spread of implied valuations.
| Scenario | Risk Rate | Growth Rate | Estimated Value |
|---|---|---|---|
| Simple average (historical dividend) | 6%-11% | 2%-4% | ~$7.19 |
| Forward-adjusted (forward dividend estimate) | 6%-11% | 2%-4% | ~$7.40 |
| Franking-adjusted | 6%-11% | 2%-4% | ~$10.57 |
The franking-adjusted estimate of approximately $10.57 per share reflects the grossed-up dividend value for Australian taxpayers eligible for franking credit refunds. This figure is not directly comparable to the simple model outputs, as it incorporates a tax benefit that varies by investor.
Against BOQ’s market price of $6.26 (as at May 2026), even the simple average DDM estimate suggests the stock may be trading below its modelled value. The range of outputs, however, is the lesson. A DDM gives a methodology, not a verdict. The assumptions an investor selects for risk rate and growth rate encode their view on the very factors this article has explored: capital adequacy, culture trajectory, and structural competitive headwinds.
The structural headwinds BOQ and other regional banks face beyond the balance sheet
BOQ’s below-average metrics do not exist in isolation. They are partly the product of structural forces bearing down on the regional bank sector as a whole.
On the revenue side, net interest margin compression is squeezing lending yields. Major banks compete aggressively on mortgage pricing, forcing regionals to match or lose market share. Simultaneously, higher term deposit rates are required to retain funding. BOQ’s lending income accounts for approximately 93% of total revenue, which means NIM compression hits with disproportionate force compared to more diversified institutions.
Bendigo and Adelaide Bank’s FY24 interim results (released 12 February 2024) confirmed these pressures are sector-wide, reporting materially similar margin compression and competitive mortgage pricing dynamics.
Bendigo and Adelaide Bank faces structurally similar pressures, with a cost-to-income ratio of approximately 67% and a culture score of 2.9 sitting below the sector average, confirming that the headwinds constraining BOQ are not idiosyncratic failures but characteristics of the regional bank tier as a whole.
The structural headwinds facing regional ASX banks include:
- Mortgage margin compression from aggressive major bank pricing
- Elevated deposit costs required to retain funding
- Technology investment burden to remain competitive with major bank digital platforms
- Talent competition for risk, compliance, and technology capability against major banks and consulting firms
The completion of the Suncorp Bank acquisition by ANZ on 31 July 2024 removed an independent regional competitor, illustrating the consolidation logic that competitive pressure creates.
Why the cost pressure side is harder for regionals to escape than the revenue side
NIM compression may ease as rate cycles turn. Technology and talent cost inflation, by contrast, is structurally embedded. Major banks’ substantially larger technology budgets deliver superior digital platforms, and regionals must invest to remain competitive without the same revenue base to absorb the expenditure. Remediating culture and rebuilding risk capability, as BOQ is actively doing, requires sustained capital allocation regardless of the revenue environment.
Understanding that BOQ’s underperformance is partly structural, not solely a management execution failure, helps investors calibrate what “improvement” realistically looks like and what ceiling exists on ROE recovery for a regional bank in this competitive environment.
Building a more complete framework for assessing ASX regional bank stocks
The three threads explored in this article, capital adequacy, culture signals, and DDM valuation, combine into a practical framework for regional bank assessment:
- Check CET1 against sector average and APRA benchmarks. A CET1 ratio materially below peer levels signals a thinner buffer for dividend sustainability and stress absorption. Track the direction of change across reporting periods.
- Review the culture score trend against the sector benchmark. A sustained improvement in Seek or equivalent platform scores may precede operational stabilisation before it appears in reported earnings. A persistent decline warrants scrutiny of talent retention and remediation execution.
- Run a DDM across a range of risk and growth rate assumptions, with franking adjustment. The spread of outputs reveals which assumptions the current market price is implying, and whether those assumptions are consistent with the CET1 and culture signals.
These metrics do not replace earnings analysis. They complement it, providing a fuller picture of where a regional bank sits in its cycle and what risks are priced or unpriced.
For investors wanting to apply this framework beyond BOQ, our full explainer on regional bank stock analysis covers all five metrics including ROE, NIM, CET1, culture score, and DDM valuation with benchmarks calibrated for the current ASX regional banking environment.
BOQ snapshot: Seek culture score 2.6 (sector benchmark 3.1), CET1 10.7% (most recent full year), ROE 4.7% (sector average 9.35%), NIM 1.56% (peer average 1.78%). All below sector averages.
The combination of a below-sector CET1, a below-average culture score, and an ROE at roughly half the sector average presents a coherent picture of a bank in active remediation. BOQ operates approximately 200 branch locations under its owner-manager model, serving a specific segment of the Australian banking market. The stock is neither automatically a buy nor a sell on these metrics alone; it requires a more informed set of inputs than yield can provide.
What the BOQ case study tells long-term investors about looking past the headline yield
Headline yield is an incomplete lens. It tells an investor what a bank distributed, not whether the bank can sustain that distribution. CET1 ratios measure the capital buffer protecting dividends in a downturn. Culture scores provide an early, forward-looking signal on operational health that mainstream valuation frameworks have yet to incorporate.
The BOQ case study is not a buy or sell recommendation. It is a methodology demonstration. The same three-step framework, capital adequacy assessment, directional culture score tracking, and DDM valuation across a range of assumptions, applies to any regional ASX bank stock an investor evaluates.
The practical next step is straightforward: pull CET1 data from APRA disclosures and bank results announcements, check directional culture score trends on Seek or equivalent platforms, and run the numbers through a DDM with assumptions that reflect the structural realities of the regional banking sector.
This article is for informational purposes only and should not be considered financial advice. Investors should conduct their own research and consult with financial professionals before making investment decisions. Past performance does not guarantee future results. Financial projections are subject to market conditions and various risk factors.