Goldman Sachs has reversed its U.S. Dollar forecast. The bank’s global research team, in a report published 22 May 2026, abandoned a prior call for greenback weakness and identified two structural forces now supporting sustained Dollar strength: the domestic artificial intelligence investment boom and elevated global energy prices driven by ongoing Strait of Hormuz disruptions. The reversal arrives as China’s April economic data delivered a sharp downside surprise, May flash purchasing managers’ indices (PMIs) across Europe decelerated, and energy-importing economies absorbed another month of constrained commodity flows. Markets had been pricing a less exceptional U.S. growth trajectory; Goldman’s revision reframes that assumption directly. What follows is an examination of what changed in the bank’s analysis, why the AI expansion and energy cost asymmetry together form a structural Dollar case, and what the downstream consequences are for Asian central banks and European currency pairs already under pressure.
What Goldman Sachs changed and why the reversal matters now
Goldman had previously anticipated Dollar weakness tied to what the bank described as a less exceptional U.S. growth profile relative to other major economies. That view has now been explicitly abandoned.
The 22 May research report identified two structural drivers behind the shift: the scale and durability of domestic AI capital expenditure, and the asymmetric benefit the United States derives from elevated global energy prices as a major producer rather than importer. Neither driver is cyclical. Both compound over time.
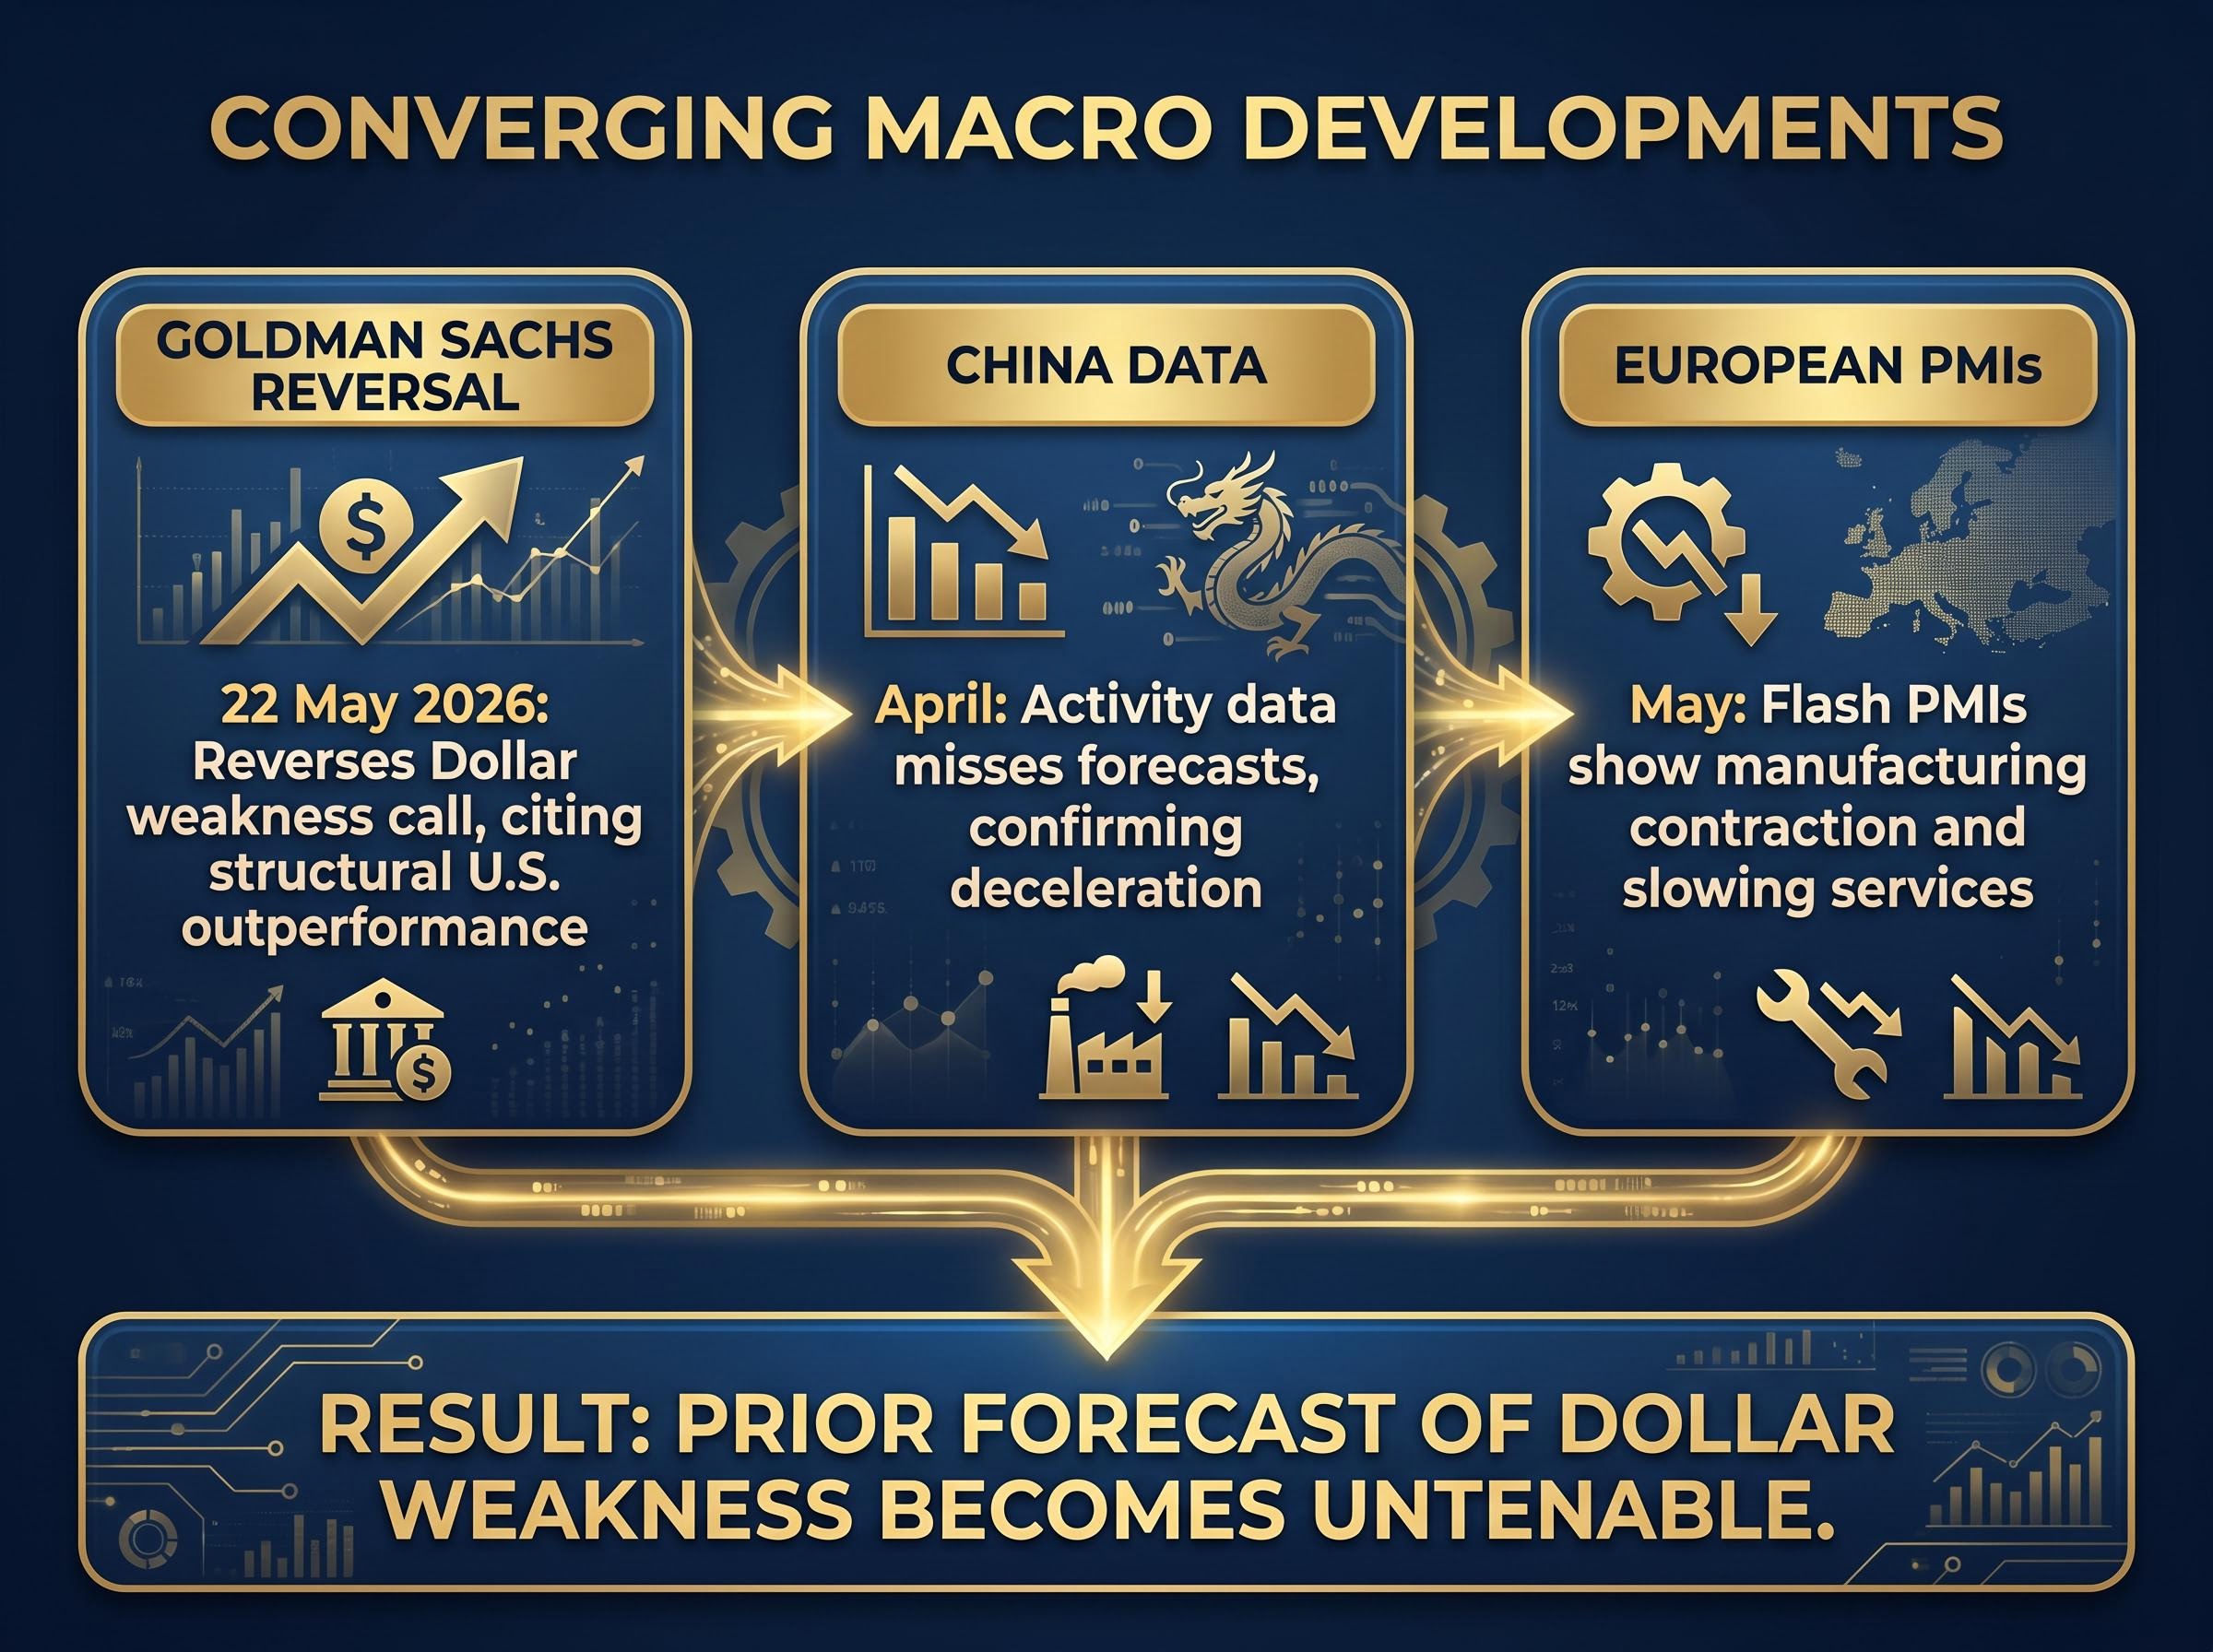
The timing sharpened the signal. Three macro developments converged in the same week:
- Goldman Sachs reversed its Dollar weakness call, citing structural U.S. outperformance.
- China’s April activity data missed forecasts by a significant margin, confirming deceleration rather than recovery.
- May flash PMIs across major European economies showed further contraction in manufacturing and slowing services momentum.
Each development, independently, would have supported a stronger Dollar reading. Together, they form a confirming data set that made the prior forecast untenable.
When big ASX news breaks, our subscribers know first
How the AI boom is anchoring U.S. economic exceptionalism
Goldman’s analysts identified the domestic AI sector expansion as a structural factor that alters the growth differential between the United States and other major economies. The distinction matters: this is not a demand-side stimulus that fades when spending normalises. It is a supply-side investment cycle that builds productive capacity, attracts skilled labour, and generates compounding returns to capital formation.
AI-related capital expenditure across semiconductors, data centre infrastructure, and enterprise software has created a self-reinforcing loop. Companies invest, productivity rises, earnings improve, and further investment follows. The result is a growth profile that looks durable rather than borrowed from future demand.
The AI capital expenditure cycle now running through semiconductors, data centres, and enterprise infrastructure has already surpassed every prior technology investment peak in U.S. history, with IT hardware and software spending reaching 4.9% of GDP in Q1 2026 and combined hyperscaler commitments for the full year sitting in the $600-$805 billion range.
Why this shifts a currency forecast
The transmission from AI investment to Dollar strength runs through capital flows. Sustained relative outperformance attracts foreign direct investment and portfolio inflows. Those flows require Dollar purchases. When the growth differential is structural rather than cyclical, the capital flow support persists longer and proves more resistant to short-term sentiment shifts. Goldman’s revision reflects exactly this logic: the AI boom is not a reason to expect a temporary Dollar rally, but a reason to expect the prior weakness thesis no longer holds.
Why elevated energy prices hurt Europe more than the United States
The United States produces enough oil and natural gas to meet the vast majority of its domestic energy needs. Europe does not. That single fact creates an asymmetry that compounds with every additional month of constrained global energy supply.
Strait of Hormuz disruptions have generated sustained anxiety in European currency markets. Energy-importing economies face rising input costs across manufacturing, transport, and heating, all of which compress margins, slow growth, and weaken currencies. The United States, insulated by domestic production, absorbs the same global price shock with structurally lower exposure.
Oil as a structural inflation risk rather than a transient spike has become a defining feature of the 2026 macro environment, with triple-digit Brent prices transmitting through three sequential stages: energy input costs, logistics costs, and consumer price indices, each compressing margins and growth potential for energy-importing economies at different speeds.
| Factor | U.S. position | European position |
|---|---|---|
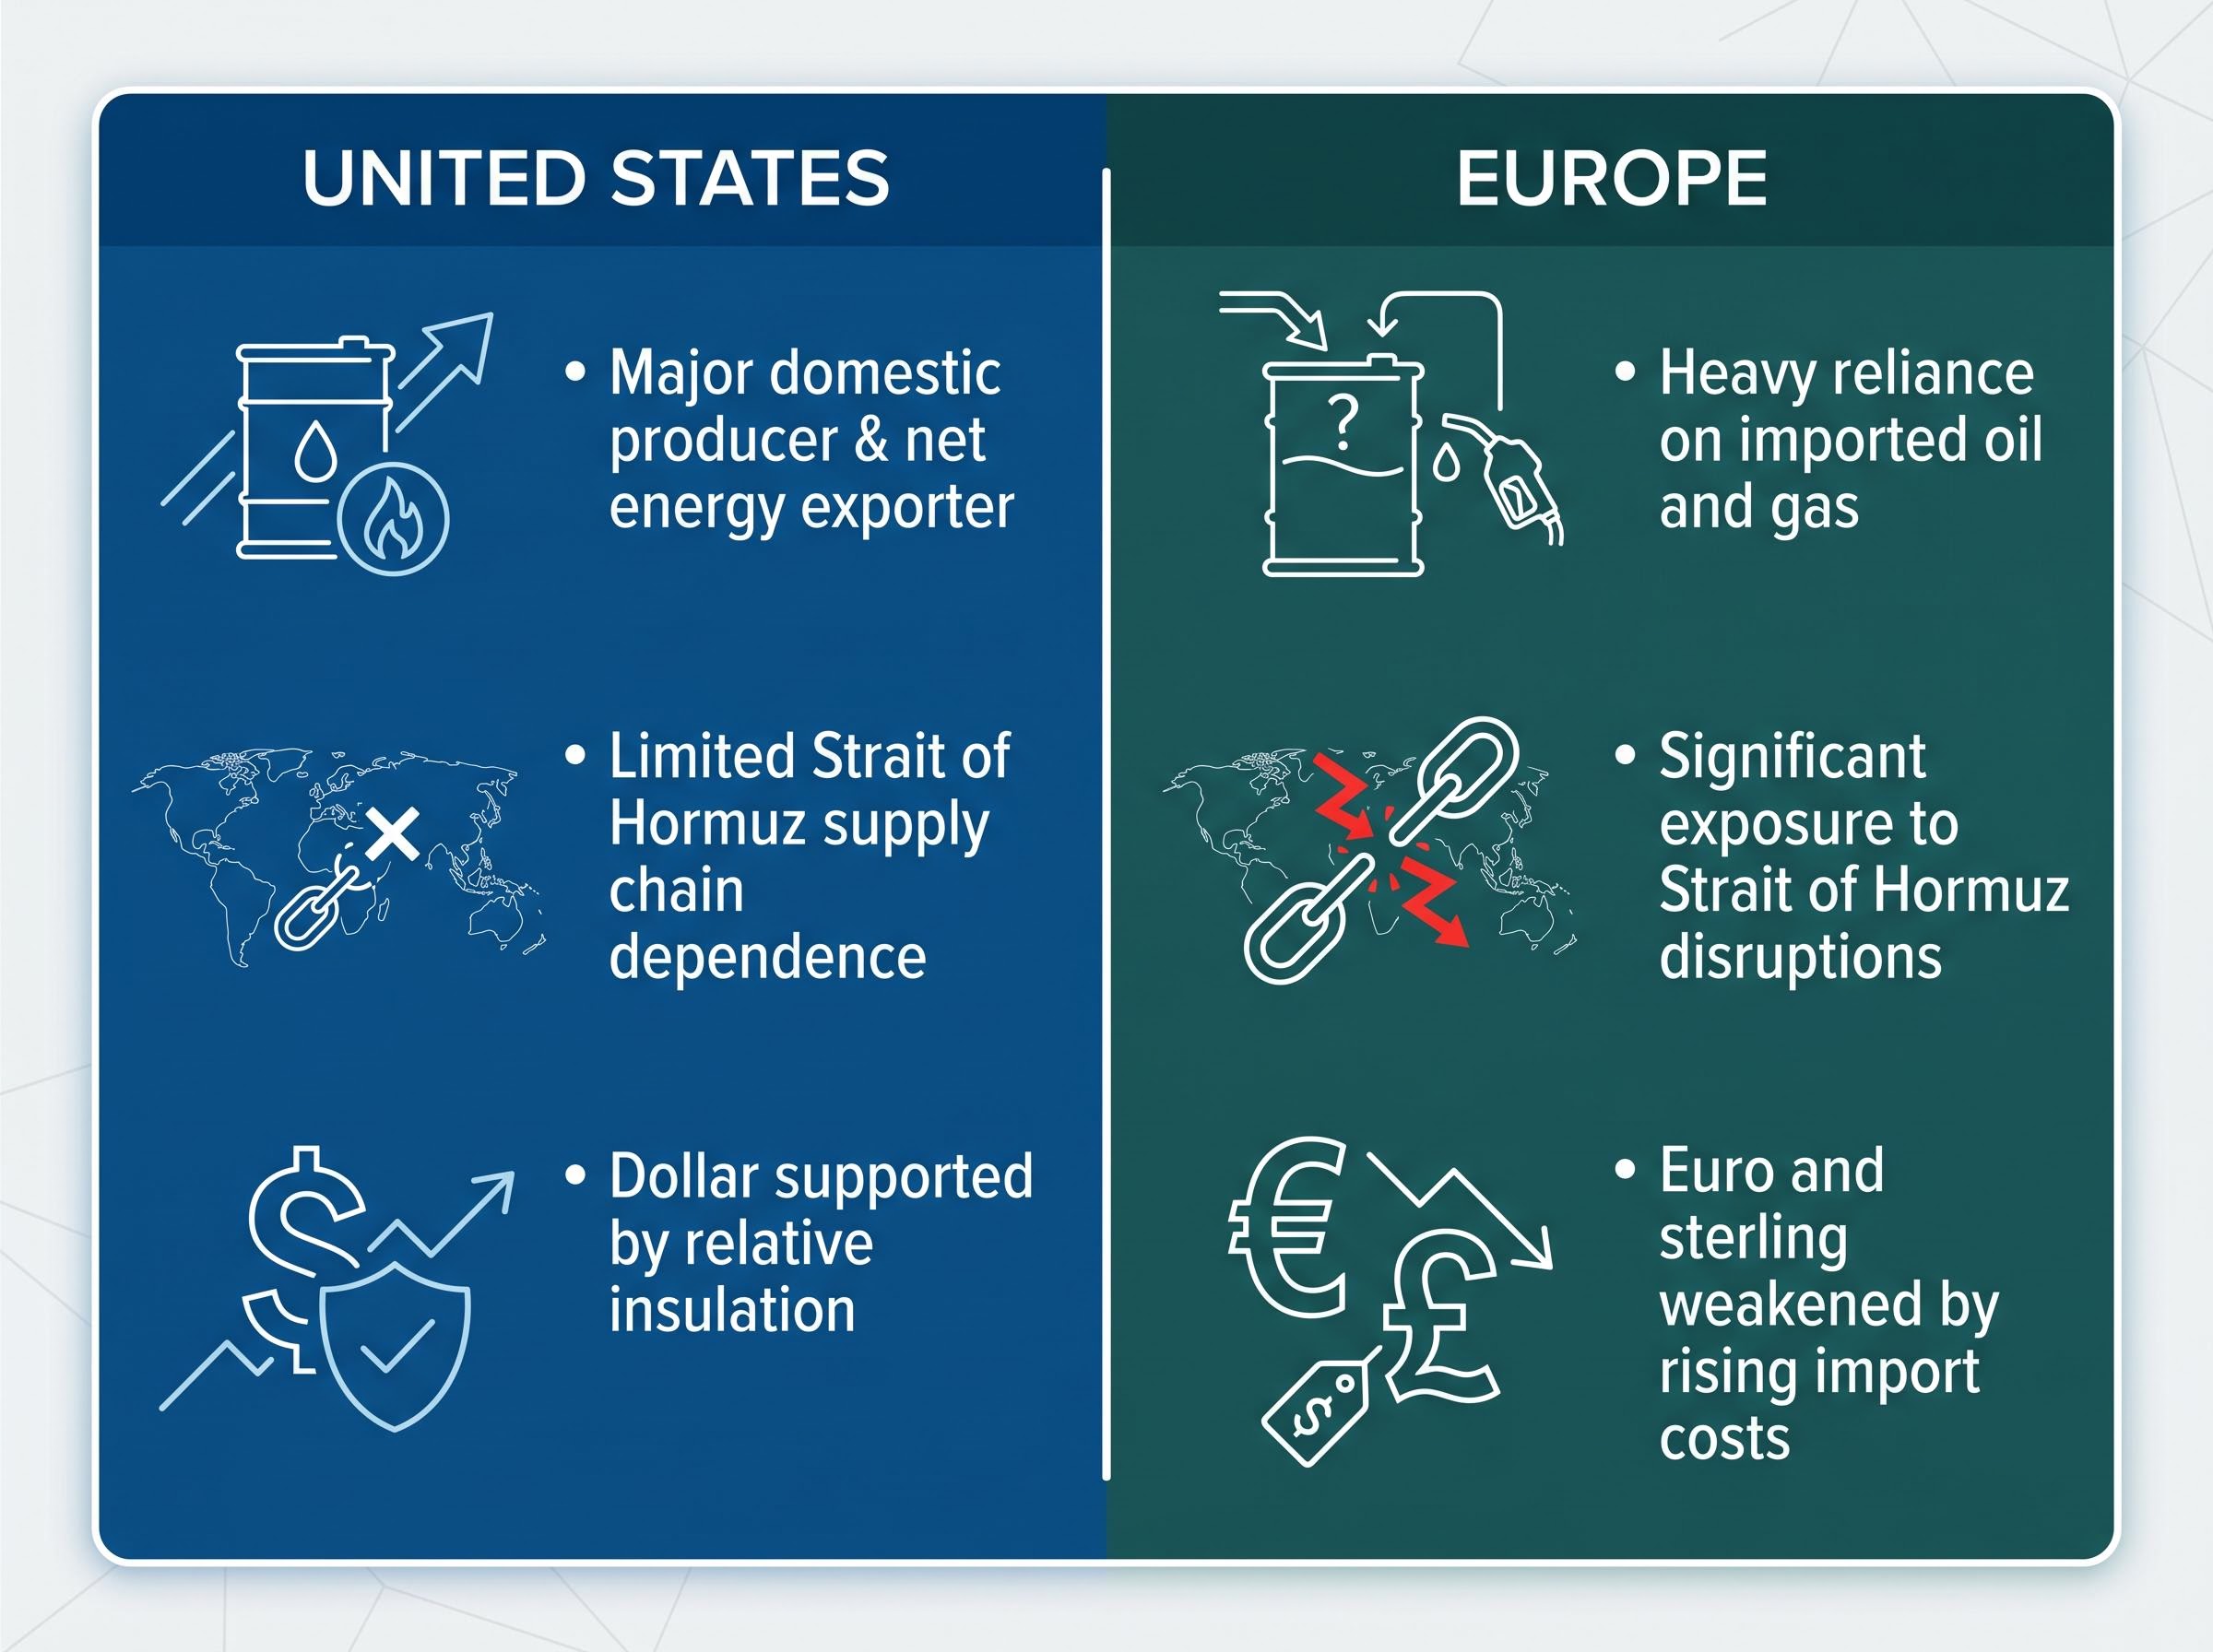
| Energy production status | Major domestic producer; net energy exporter | Heavy reliance on imported oil and gas |
| Hormuz exposure | Limited direct supply chain dependence | Significant exposure through Middle Eastern imports |
| Currency market impact | Dollar supported by relative insulation | Euro and sterling weakened by rising import costs |
Goldman’s analysts characterised restricted commodity flows as incrementally beneficial for the U.S. Dollar on an ongoing basis, noting that each additional period of constraint adds support to the greenback relative to European pairs.
The energy asymmetry may prove the more durable of Goldman’s two structural drivers. It operates through trade balances and import cost differentials rather than sentiment, meaning it persists as long as disruptions continue, regardless of market positioning or risk appetite shifts.
The Dollar’s knock-on effect: Asian central banks forced to respond
Goldman’s Dollar reversal is not an isolated bilateral story between the greenback and the euro. Across Asia, central banks are already responding to the pressure.
Bank Indonesia delivered the most immediate policy reaction. During the week of 22 May 2026, the central bank announced an unexpected 50-basis-point rate increase, bringing its benchmark rate to 5.25%. The move was designed to defend the Indonesian Rupiah against persistent pressure from elevated U.S. interest rates and energy-related current account deterioration.
The South Korean Won has weakened despite robust technology-related export performance. Strong semiconductor and electronics shipments have not been sufficient to offset substantial equity outflows driven by U.S. rate differentials, a dynamic that highlights how Dollar strength transmits through capital markets rather than trade alone.
Treasury yield dynamics interact with the Dollar strength thesis in ways that compound the pressure on Asian central banks: elevated U.S. yields widen rate differentials, accelerate capital outflows from emerging markets, and tighten dollar-denominated borrowing costs simultaneously, creating a feedback loop that makes the Asian tightening cycle Goldman projects both more likely and more disruptive than a simple currency-defence response.
Goldman projects additional tightening across the region:
- Bank Indonesia has already acted with a 50-basis-point increase to 5.25%.
- The Bank of Korea, the Reserve Bank of India, and the Central Bank of the Republic of China (Taiwan) are projected to join monetary tightening efforts later in 2026.
- Malaysia and Thailand are projected to hold benchmark rates unchanged.
| Institution | Current action or status | Goldman projection |
|---|---|---|
| Bank Indonesia | 50 bps rate increase to 5.25% | Already acted |
| Bank of Korea | Holding; Won weakening despite strong exports | Tightening projected later in 2026 |
| Reserve Bank of India | Monitoring capital outflows | Tightening projected later in 2026 |
| Central Bank of Taiwan | Monitoring currency pressure | Tightening projected later in 2026 |
| Bank Negara Malaysia / Bank of Thailand | Benchmark rates steady | Hold projected |
The projected wave of Asian tightening represents a secondary macro consequence of the Dollar story. Higher rates across emerging market Asia affect growth outlooks, equity valuations, and sovereign debt costs in markets that U.S. investors increasingly hold in diversified portfolios.
Investors tracking the projected wave of Asian tightening will find our full explainer on converging central bank pressures across the UK, US, Japan, and Australia in the week of 18-22 May 2026, which maps how five simultaneous data releases were feeding directly into rate decisions due within 30 days and creating a concentrated repricing window across global rates markets.
What the Dollar’s structural shift means for FX strategy in 2026
The convergence of AI-driven growth exceptionalism and energy cost asymmetry creates a Dollar support framework that is structural rather than tactical. Goldman’s analysis frames this as a combined force: neither driver alone would have warranted a full forecast reversal, but together they produce a macroeconomic spread against both Europe and Asia that historically sustains currency differentials over quarters, not weeks.
The confirming data set is now visible across regions simultaneously. China’s April activity miss, May European PMI deceleration, and ongoing Hormuz disruptions each reinforce the U.S. relative position from a different angle. Goldman’s broader framing positions trade terms as an increasingly dominant force behind FX returns, producing notable volatility-adjusted currency movements that pure rate differentials cannot fully explain.
The FOMC minutes from April 2026 document the Federal Reserve’s own assessment of Dollar appreciation, oil price dynamics, and the anticipated federal funds rate path through 2026-2027, providing the official policy backdrop against which Goldman’s structural Dollar thesis is set.
For investors positioning in FX markets or evaluating international portfolio hedging, this framing matters. A structurally supported Dollar move has a different duration and risk profile than a rate-differential-only trade. It suggests hedging costs for international equity exposure may remain elevated for longer than many models currently assume.
Conditions that could reverse Goldman’s revised Dollar thesis
The structural case is not unconditional. Two scenarios could challenge the revised outlook:
- A normalisation of Strait of Hormuz energy flows, which would reduce Europe’s cost disadvantage and narrow the asymmetry that currently supports the Dollar.
- A deceleration in U.S. AI capital expenditure, which would erode the growth differential that attracts foreign capital inflows.
Neither scenario is Goldman’s base case, but both represent identifiable, monitorable risks rather than abstract tail events.
Goldman’s call lands at a crossroads for global macro
The reversal represents more than a currency call. It is a reassessment of where the United States sits in the global growth hierarchy as of mid-2026, with implications that extend across fixed income, equities, and commodity markets.
The two structural drivers Goldman identified, AI expansion and energy asymmetry, are themselves subject to change. This is a view with specific conditionality rather than an unconditional Dollar bull case. The conditions are identifiable, and the monitoring framework is straightforward.
Three variables will most likely confirm or challenge Goldman’s revised outlook in the months ahead:
- Asian central bank decisions: Further tightening validates the Dollar pressure thesis; pauses suggest the transmission is fading.
- Strait of Hormuz supply status: Sustained disruption supports the energy asymmetry; normalisation narrows it.
- U.S. AI investment data: Continued acceleration in capital expenditure reinforces growth exceptionalism; any slowdown reopens the prior weakness thesis.
This article is for informational purposes only and should not be considered financial advice. Investors should conduct their own research and consult with financial professionals before making investment decisions. Forward-looking statements, including Goldman Sachs projections referenced in this article, are subject to change based on market developments and evolving economic conditions.