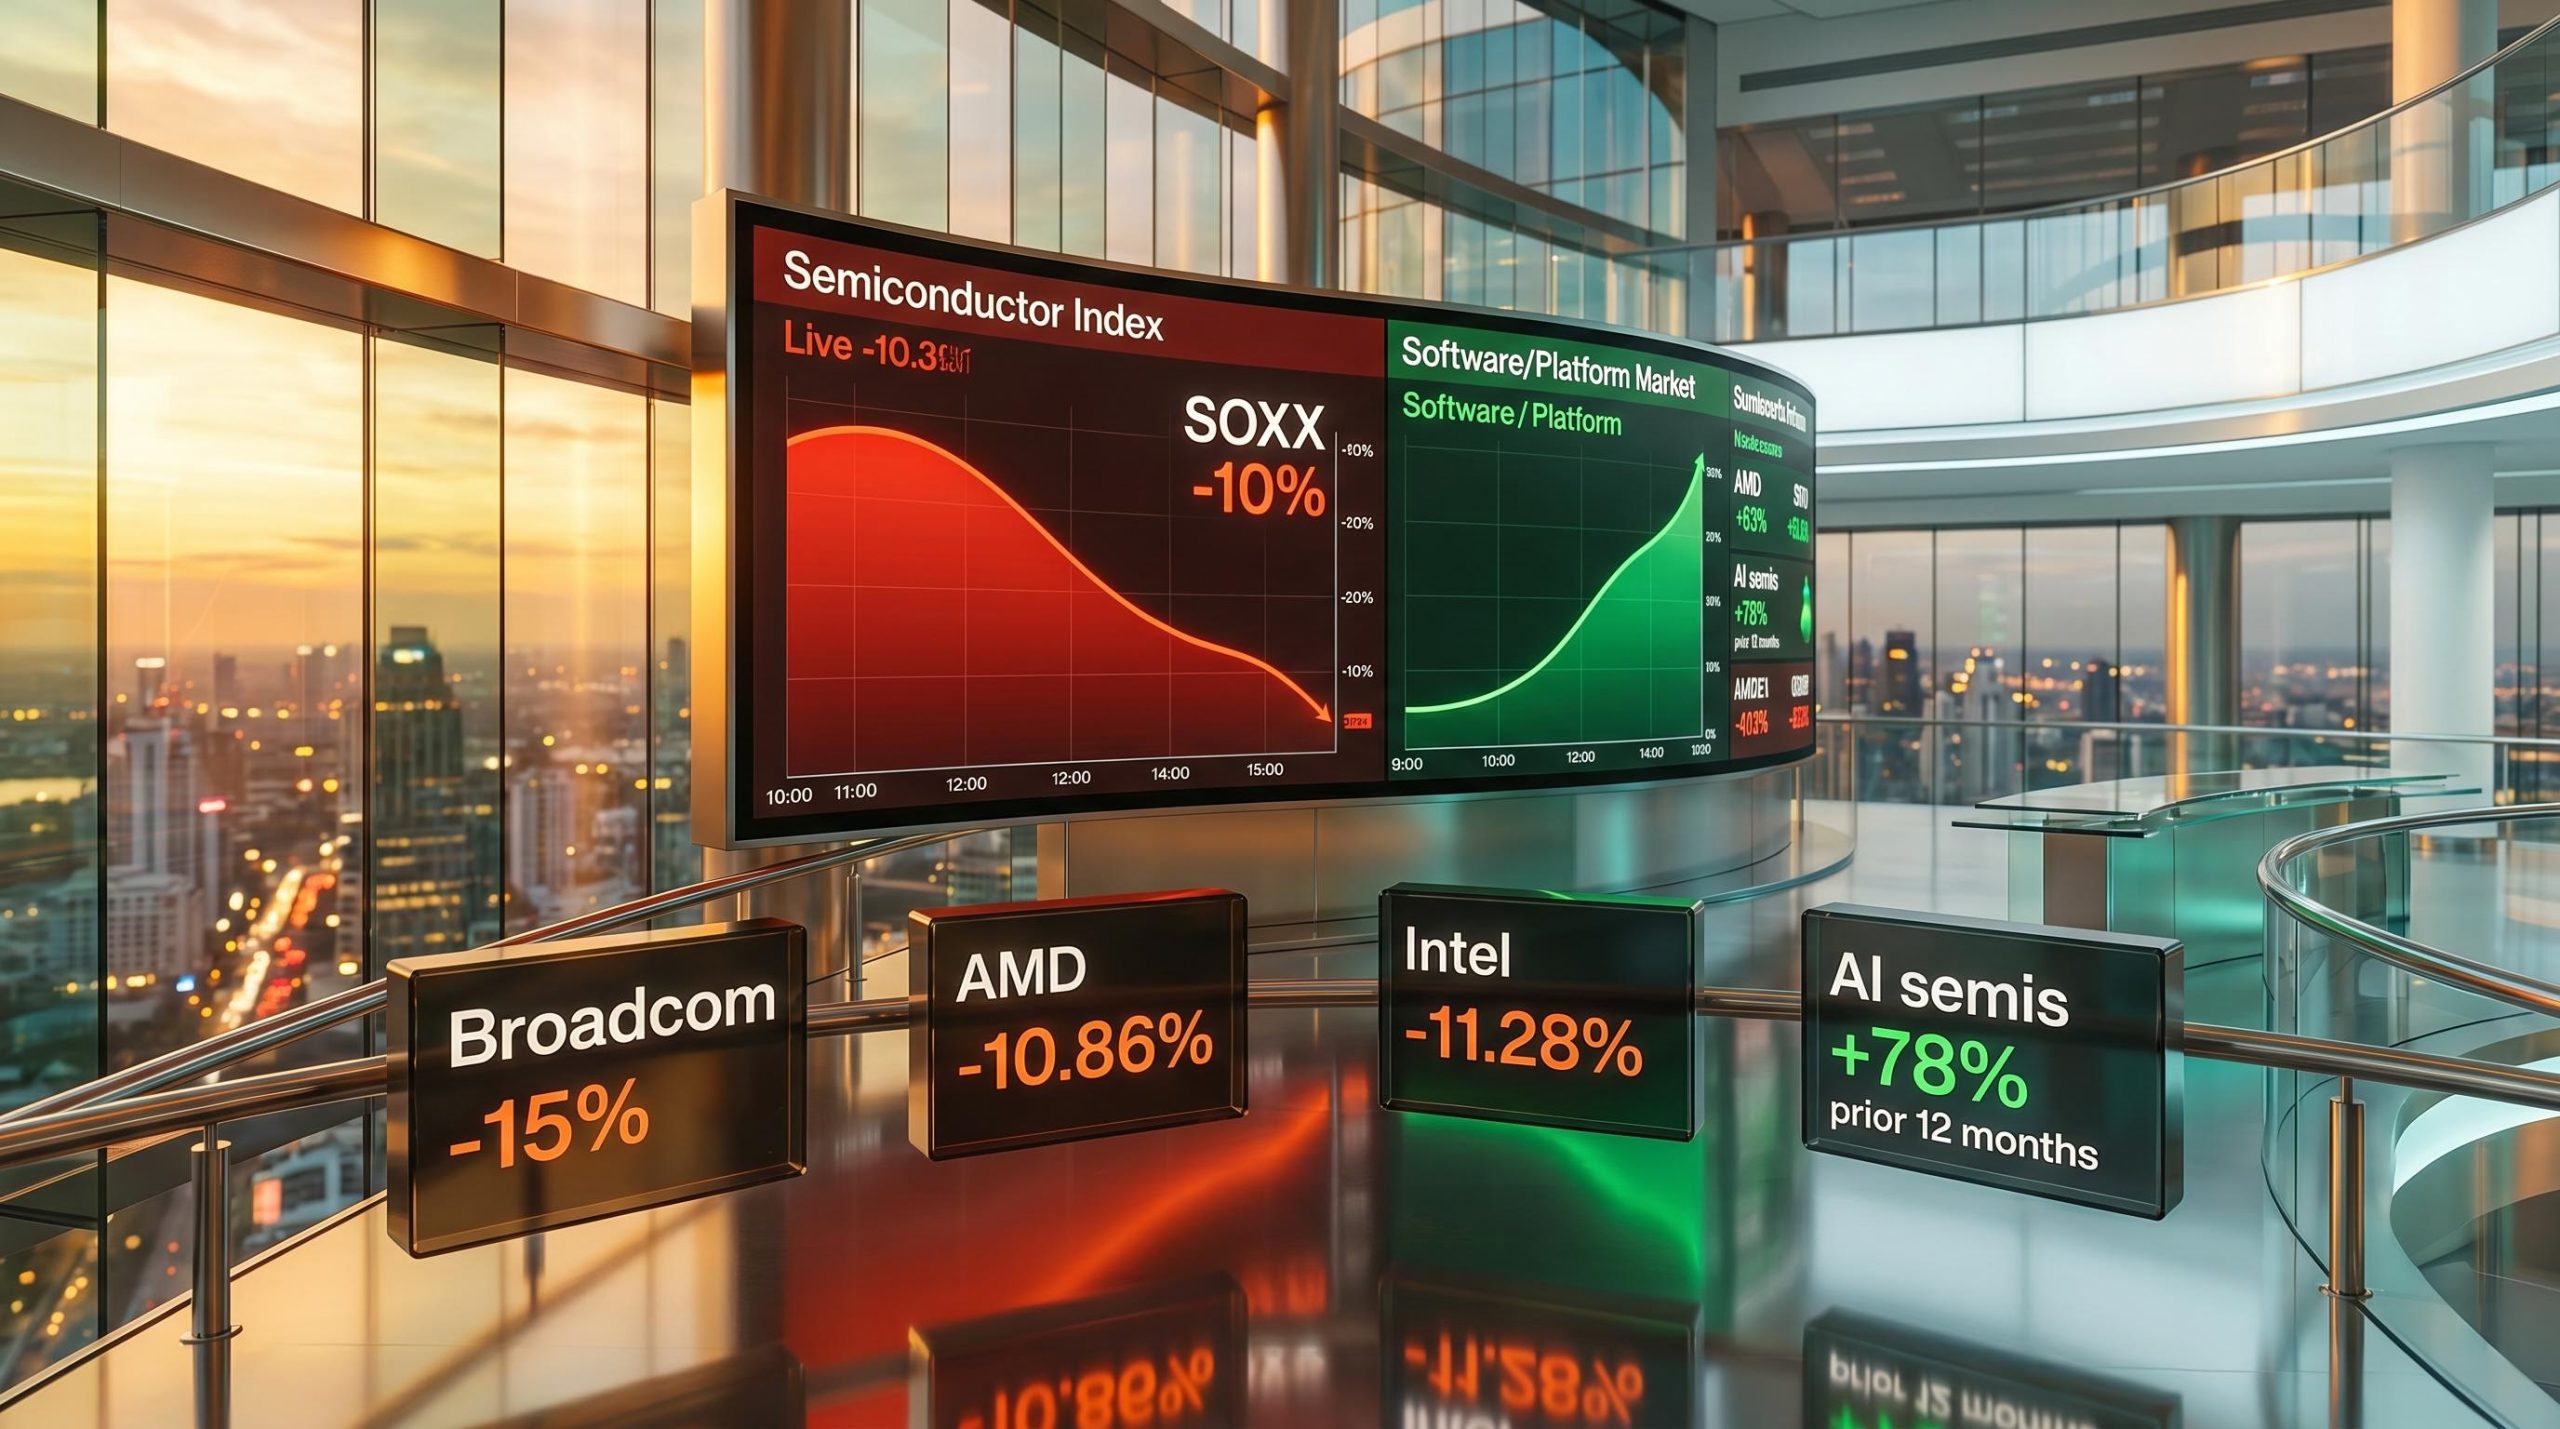
What the Broadcom Drop Reveals About AI Stock Valuations Now
4 hrs ago
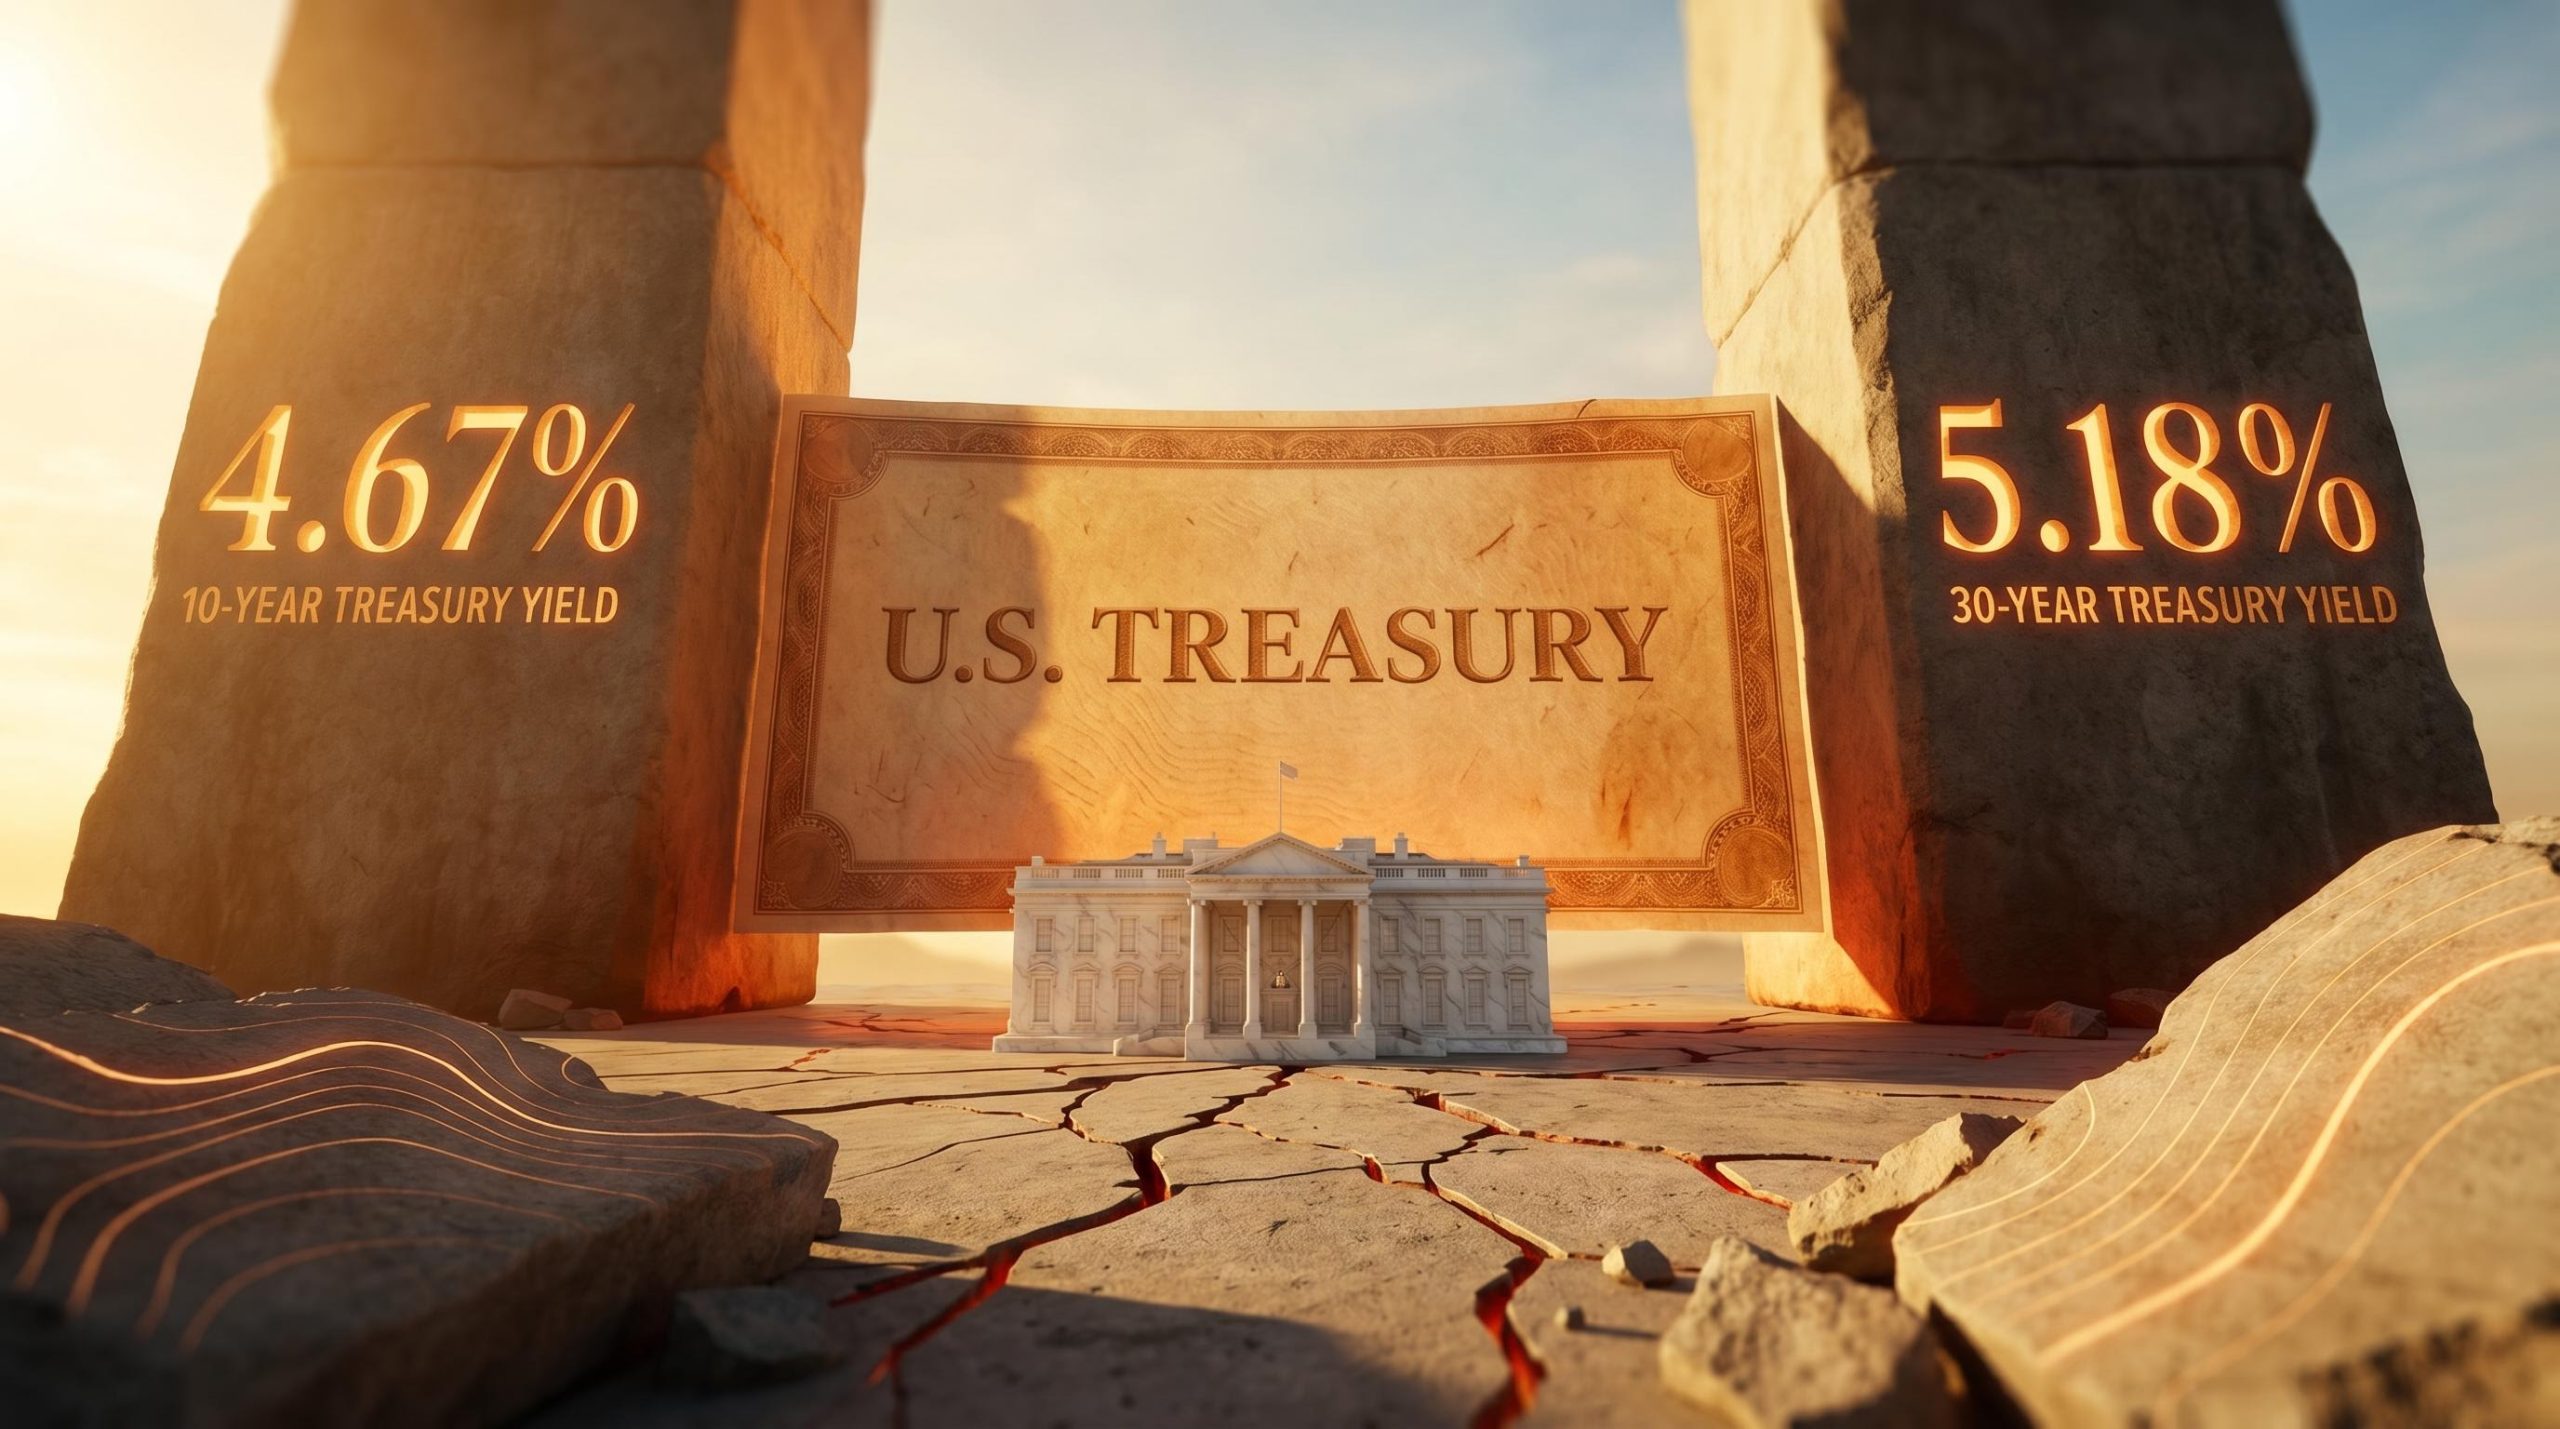
Treasury yields are climbing again, and the numbers matter more than any equity index print on 19 May 2026. The 10-year yield sits at 4.66%-4.67%, while the 30-year has pushed to 5.18%. These are not abstract data points. They feed directly into mortgage rates, corporate borrowing costs, and the federal government’s own debt arithmetic. Wolfe Research analyst Chris Senyek published a note on 19 May 2026 arguing that bond vigilantes, not equity selloffs, are the forcing mechanism most likely to shift White House policy, including on geopolitical fronts such as the U.S.-Iran situation. That argument does not exist in isolation. Over the past several months, the Financial Times, Bloomberg Opinion, Apollo, and Mohamed El-Erian have each converged on the same conclusion. What follows is an examination of why rising Treasury yields now function as the primary pressure lever on U.S. policy, what the inflation data reveals about the Fed’s room to respond, and how equity tail risks compound rather than offset the picture.
For most of the post-2008 era, the assumption held: a sharp equity decline would force the White House into rhetorical and, eventually, policy concessions. A 10% drawdown in the S&P 500 was treated as the threshold that triggered phone calls, press conferences, and policy pivots.
That model is fading. Wolfe Research’s Senyek argues that the current administration responds more decisively to uncontrolled yield spirals than to equity market declines, and the reasoning is mechanical rather than theoretical.
The 10-year Treasury reaching 4.63% on 18 May 2026 was not a US-specific event; the global bond selloff simultaneously drove Japan’s 30-year yield to an all-time high of 4.170% and pushed markets to reprice Federal Reserve rate expectations toward hikes rather than cuts by December 2026.
Higher long-term yields transmit into three channels that affect real economic activity immediately. Mortgage rates track the 10-year yield closely; every basis point higher reprices housing affordability for millions of households. Corporate borrowing costs rise in tandem, squeezing capital expenditure plans and refinancing economics across investment-grade and high-yield issuers. The federal government’s own debt servicing bill, already swollen by pandemic-era issuance, compounds at every auction that clears at higher rates.
Equity declines, by contrast, operate through wealth effects and sentiment, channels that are real but slower and less mechanically binding. Bloomberg Opinion framed it directly on 29 January 2026:
“The days when a 10% S&P 500 decline dictated White House messaging are fading; the real constraint now is the term structure of Treasury yields.”
The Financial Times reached a similar conclusion months earlier, writing on 3 October 2025 that Washington appears “more sensitive to bond market stress than to another 10-15% equity correction” because higher yields “feed directly into mortgage rates, corporate borrowing costs and the fiscal arithmetic.” For retail investors conditioned to watch the S&P 500 as the leading policy signal, this represents a material shift in how to interpret Washington’s next move.
The behaviour came first; the label came later. When investors deliberately sell long-dated government bonds to push yields higher, they are extracting a cost. The government pays more to borrow. Financial conditions tighten. Policymakers face a choice: adjust fiscal or trade ambitions, or absorb the economic drag of persistently elevated rates.
This is bond vigilantism, a form of market-imposed discipline against governments perceived as fiscally irresponsible. Senyek’s note describes a specific version of this mechanism: vigilantes could deliberately push yields higher to pressure the administration toward rapid resolution on Iran, because the geopolitical tension feeds into oil prices, which feeds into inflation, which feeds into yields, which tightens the fiscal vice further.
The pressure sequence follows a recognisable pattern:
This is not theoretical. The FT reported on 3 October 2025 that the 10-year moving above 4.7% was “a warning shot at policymakers” from bond vigilantes targeting U.S. deficits. Bloomberg documented “renewed vigilante-like selling in longer-dated Treasuries” on 7 November 2025, tied to deficit sustainability concerns. By 12 March 2026, Reuters described investors “attempting to impose fiscal discipline” via long-dated Treasury selling.
Torsten Slok, chief economist at Apollo, summarised the dynamic in comments covered by CNBC on 5 February 2026:
“What will ultimately check fiscal expansion is not an equity bear market but the point where bond investors demand much higher yields.”
Three separate episodes across eight months, documented by independent outlets, confirm that vigilante dynamics are active and escalating.
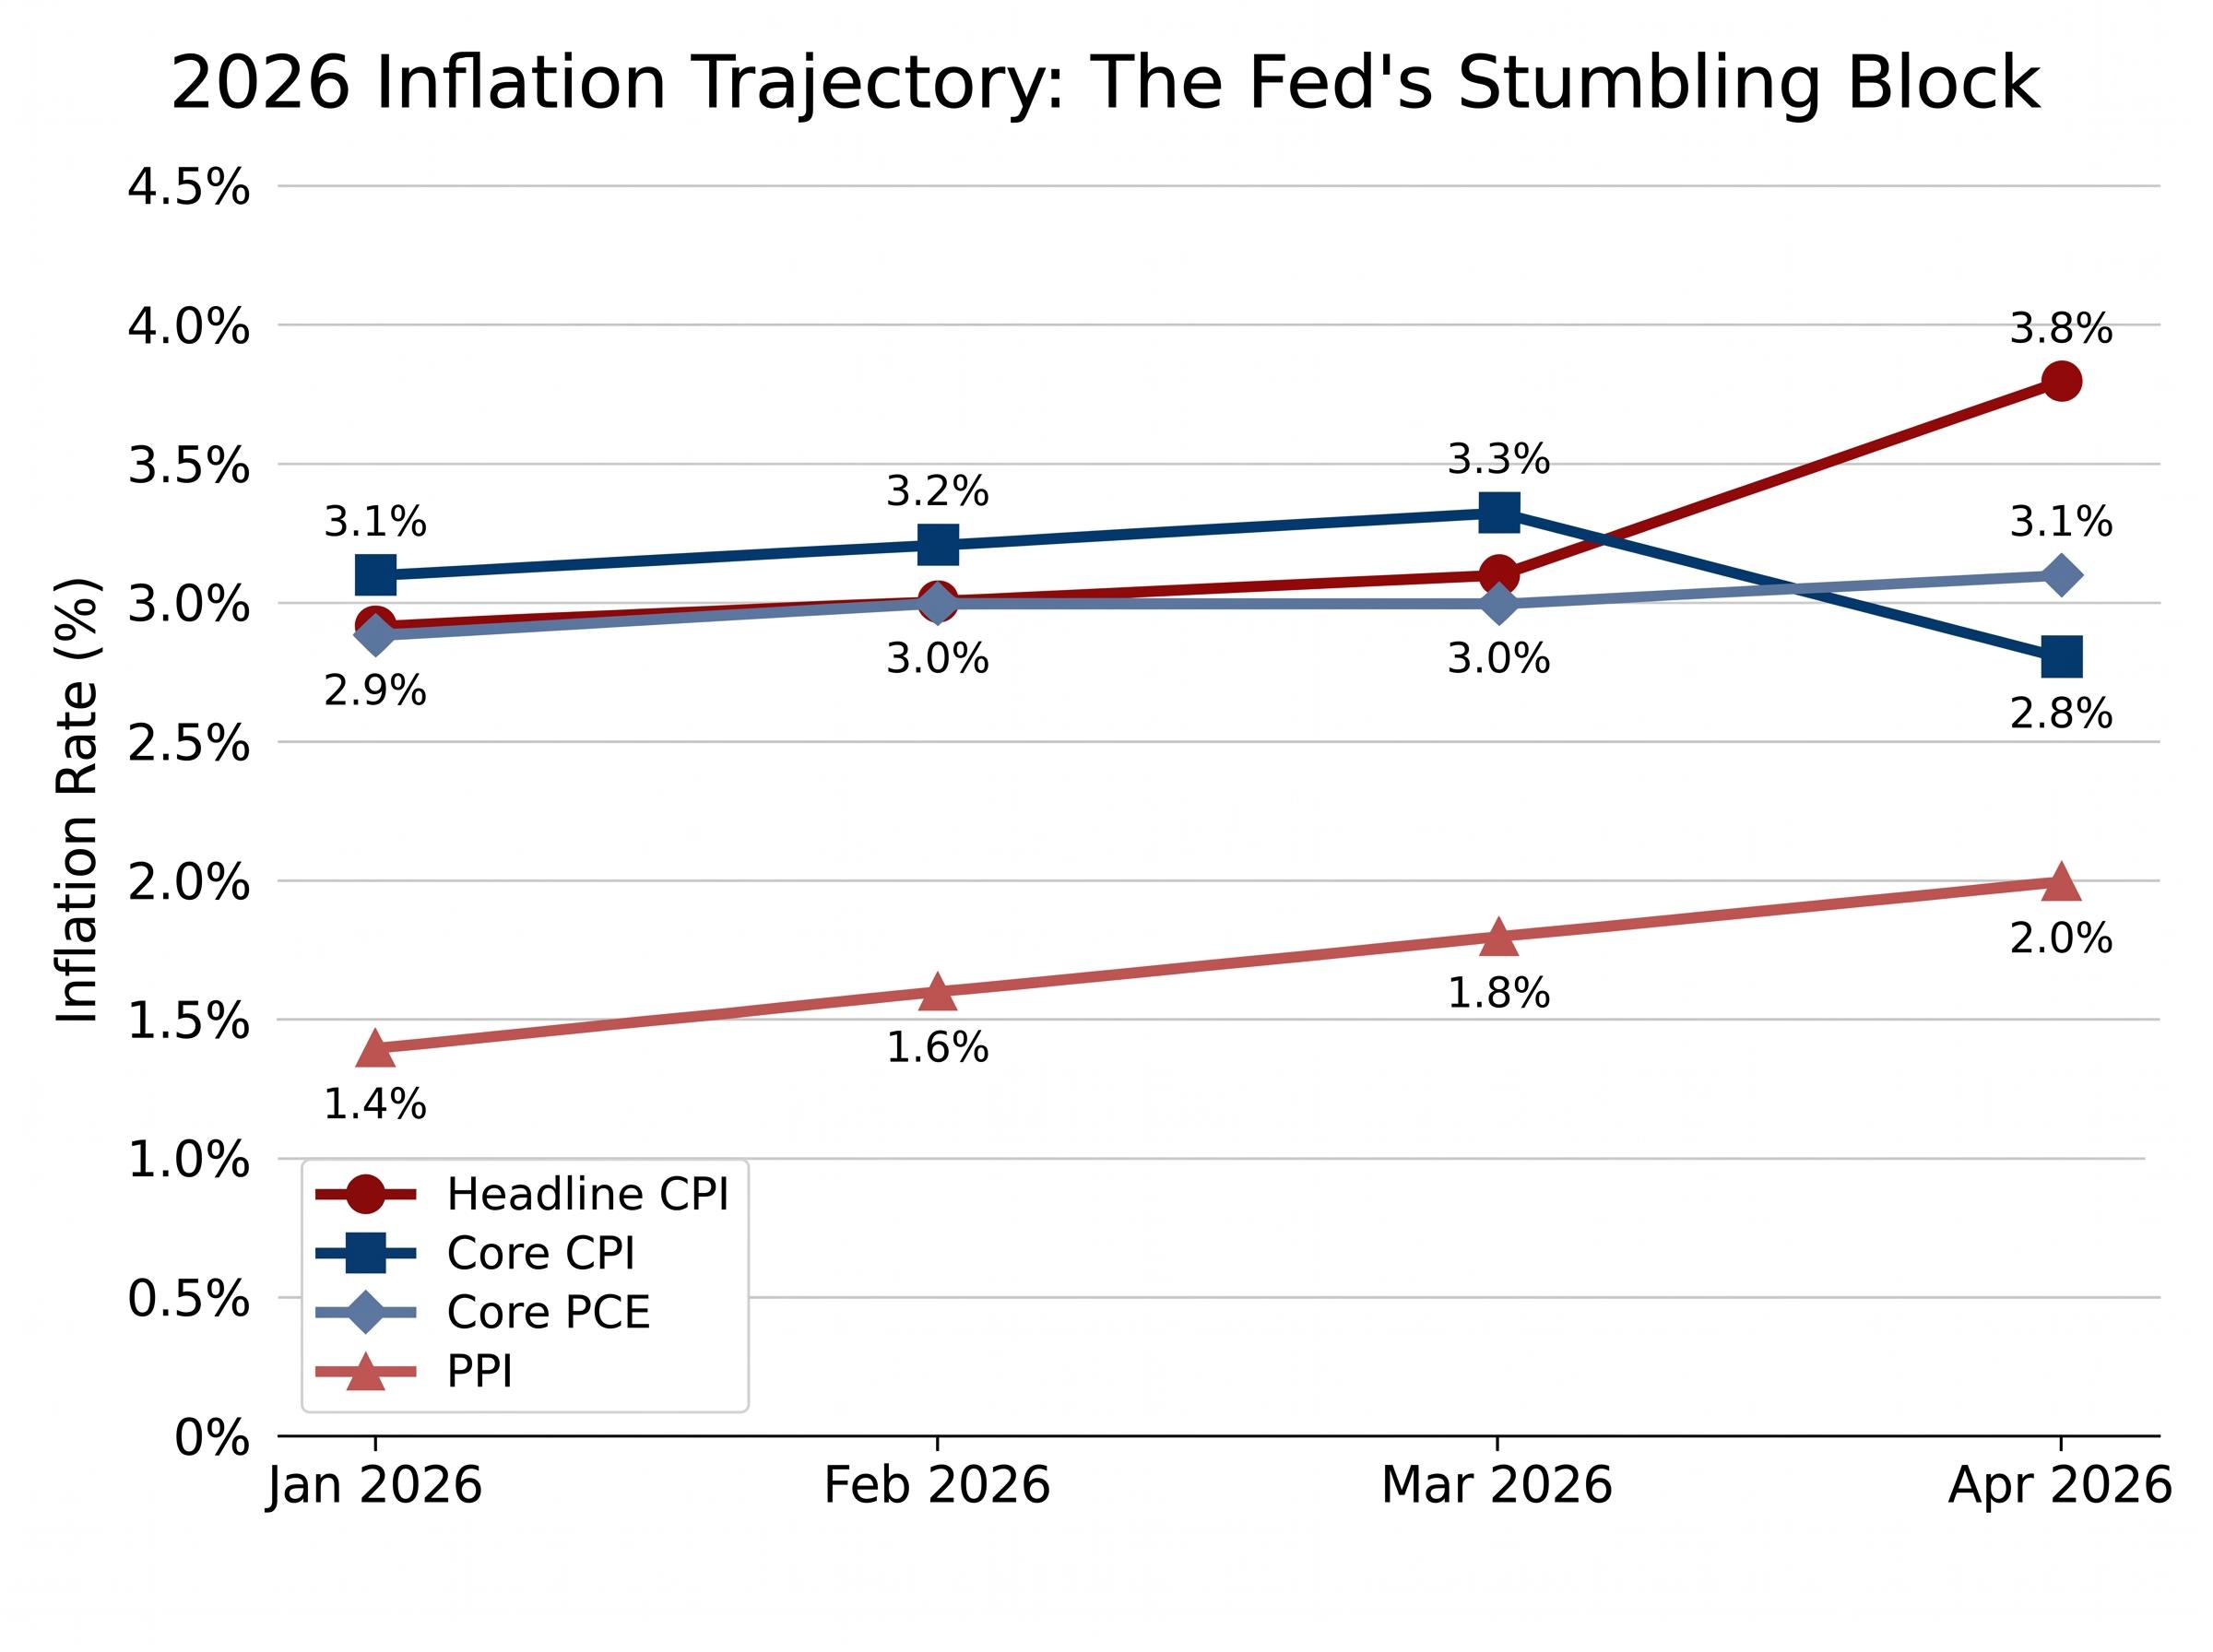
The inflation data tells a sequential story of persistence. Headline CPI opened the year at 2.9% in January, edged to 3.0% in February, and reached 3.1% in March. Then came the April print, released on 12 May 2026: headline CPI jumped to 3.8%, a sharp acceleration that caught consensus off guard.
| Period | Headline CPI (y/y) | Core CPI (y/y) | Core PCE (y/y) |
|---|---|---|---|
| January 2026 | 2.9% | 3.1% | 2.9% |
| February 2026 | 3.0% | 3.2% | 3.0% |
| March 2026 | 3.1% | 3.3% | 3.0% |
| April 2026 | 3.8% | 2.8% | Not yet released |
Producer prices have reinforced the trend. PPI rose from 1.4% in January to 2.0% by April, signalling cost pressures building upstream before they reach consumers.
This trajectory matters because it removes the traditional policy backstop. Fed Chair Jerome Powell said at the March 2026 press conference that the Committee needs “greater confidence that inflation is moving sustainably toward 2%” before cutting rates, adding that recent data “do not provide that confidence yet.”
“Greater confidence that inflation is moving sustainably toward 2%” is required before cuts, according to Fed Chair Powell at the March 2026 FOMC press conference.
Fed Governor Christopher Waller was more explicit on 9 April 2026: “If inflation remains stuck around 3%, there will be little justification for aggressive rate cuts.” Bank of America Global Research projects core PCE at 3.1% by end-2026, a level that would keep the Fed sidelined for the remainder of the year.
The Federal Reserve FOMC press conference transcripts confirm that the Committee’s baseline posture through April 2026 remained unchanged: rate cuts require sustained evidence of inflation returning to the 2% target, a bar that sequential CPI acceleration from 2.9% in January to 3.8% in April has made materially harder to clear.
With rate cuts effectively off the table, the traditional circuit breaker for rising yields, monetary easing signals, is unavailable. Bond market pressure on policy is both more intense and more durable than in prior cycles.
The Federal Reserve leadership transition completed on 13 May 2026 added a second layer of uncertainty to the rate outlook: Kevin Warsh inherited a committee with three regional presidents publicly calling for hikes by Q3 2026, a balance sheet expected to run off at $100 billion per month, and an April CPI print that broadened across shelter, core services, goods, food, and energy simultaneously.
The argument so far has been about bonds. But the stock market is not insulated from the dynamics at play; if anything, its current positioning amplifies them.
Senyek’s note flags that crowded equity positioning and extended momentum leave U.S. stocks exposed to a sharp and rapid unwinding. The rally that carried indexes higher through early 2026 concentrated capital in a narrow set of themes, creating fragility beneath the surface of headline index levels.
Four independent channels could amplify bond-led tightening if they materialise. These are not firm forecasts; they are recurring themes from institutional investor discussions and recent research notes:
Most of these risks are not separate from the yield story. Energy spikes feed inflation expectations. Yen volatility tightens global financial conditions. Private credit stress raises default risk that reprices lending broadly. Each channel loops back into the same bond market pressure framework.
The analytical thread connects as follows: yields in the mid-to-upper 4s on the 10-year and low-to-mid 5s on the 30-year are functioning as pressure zones. They tighten financial conditions across mortgages, corporate debt, and federal borrowing simultaneously.
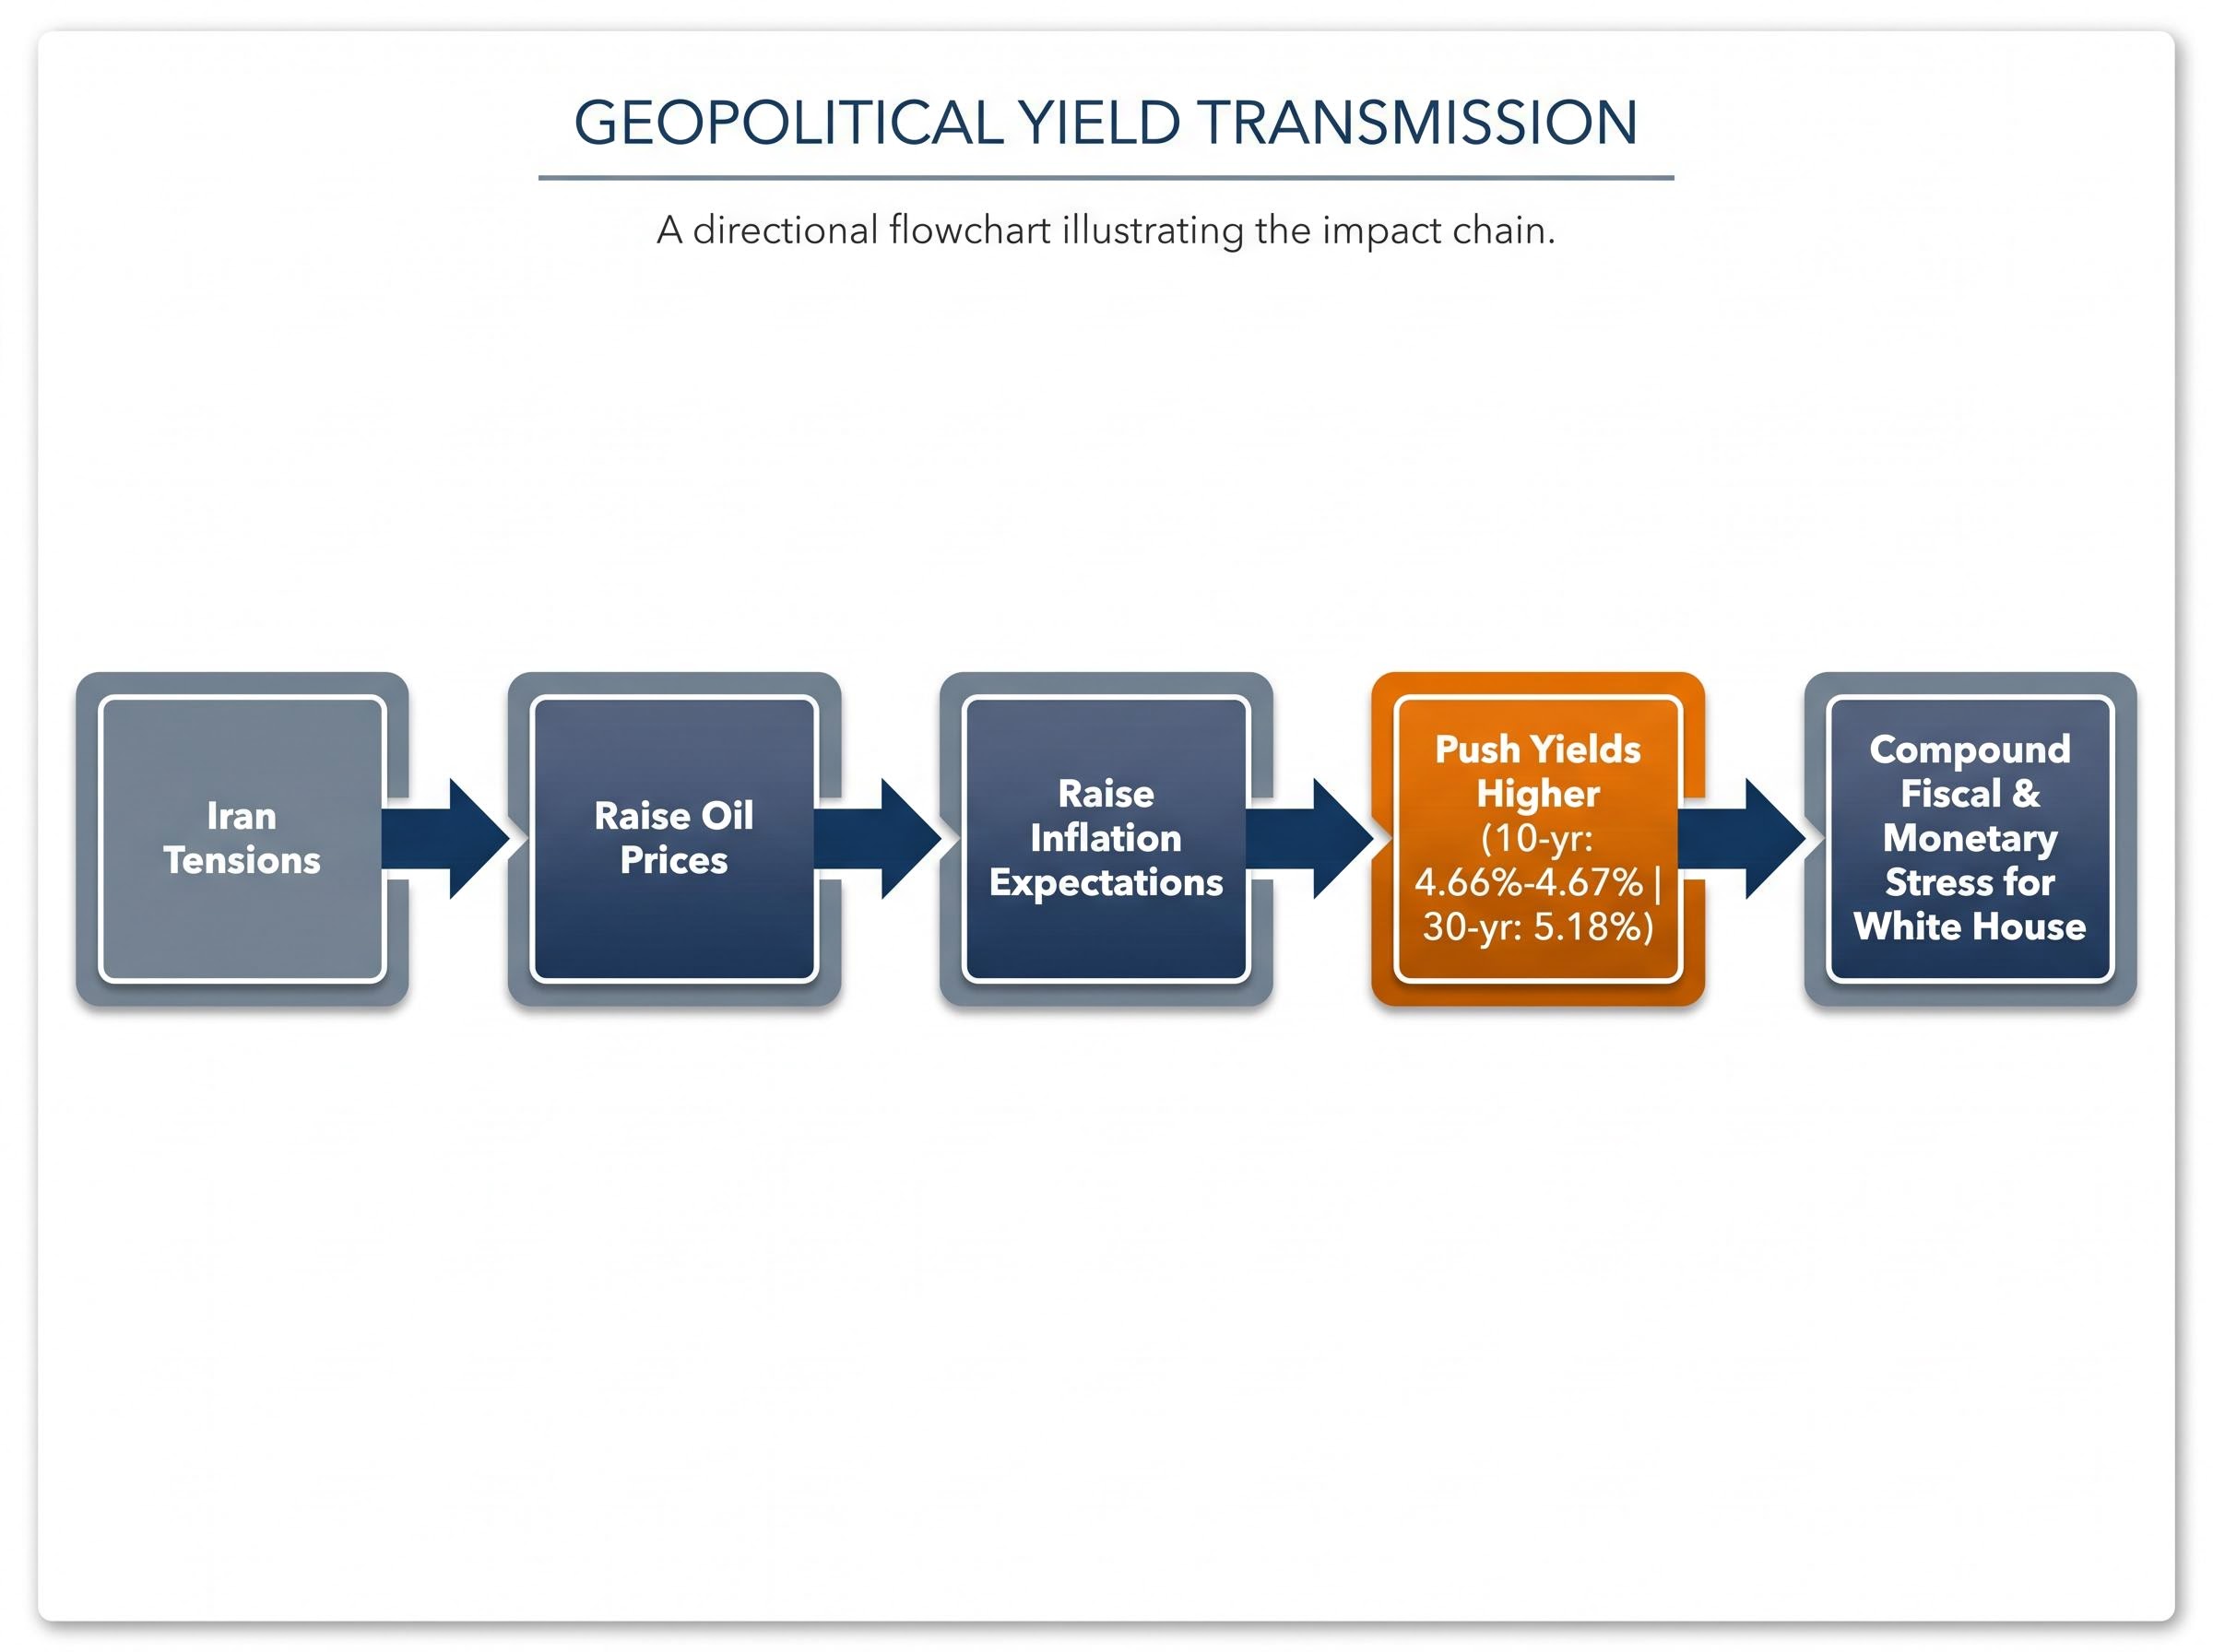
The geopolitical linkage is practical, not abstract. Iran tensions raise oil prices. Oil raises inflation expectations. Inflation pushes yields higher. Higher yields compound fiscal and monetary stress. That is the channel that reaches the White House, not the S&P 500 closing level.
The oil shock transmission from a near-total Strait of Hormuz closure to sovereign bond markets played out with unusual speed in May 2026, with Brent crude rising approximately 57% in under three months and driving simultaneous yield spikes across Germany, France, Italy, Spain, the US, and Japan to generational highs.
Mohamed El-Erian, writing in comments covered by MarketWatch on 25 March 2026, framed the risk directly:
“Policymakers are underestimating the risk that bond markets, not stock markets, will impose the toughest constraints on future policy flexibility.”
Bloomberg reported on 13 May 2026 that the White House is aware an oil price spike that “pushes long-term yields meaningfully higher would tighten financial conditions and undercut the domestic economy,” a factor shaping its caution on Iran escalation.
For U.S. retail investors navigating a market shaped by geopolitics, inflation, and fiscal risk simultaneously, monitoring the 10-year yield direction is now more predictive of policy pivots than watching equity index drawdowns.
Yields in the mid-to-high 4s and low 5s mark the pressure zone where White House policy calculus shifts. Equity drawdowns matter, but they no longer command the same response they once did. The bond market has reasserted itself as the binding constraint.
What remains uncertain is the precise threshold. No public source, including Wolfe Research, codifies a specific basis-point level as an official trigger. The mechanism is real; the exact trip wire is pressure-zone logic, not a hard circuit breaker.
As long as inflation holds above 3% and the Fed stays patient, the bond market’s leverage over policy will remain elevated. Yield direction, not index levels, is the most consequential signal for investors to track through the second half of 2026.
For readers wanting to understand the debt arithmetic in full context, our dedicated guide to US fiscal sustainability metrics examines why debt-to-GDP at 100% is less informative than the interest-to-revenue ratio and Treasury auction bid-to-cover trends, and identifies the specific yield levels and CBO projection signals that would mark a genuine shift from manageable debt service to fiscal stress.
This article is for informational purposes only and should not be considered financial advice. Investors should conduct their own research and consult with financial professionals before making investment decisions. Past performance does not guarantee future results. Financial projections are subject to market conditions and various risk factors.
Bond vigilantes are investors who deliberately sell long-dated government bonds to push yields higher, imposing financial discipline on governments perceived as fiscally irresponsible. In 2026, three separate episodes documented by the FT, Bloomberg, and Reuters confirm that vigilante-like selling in longer-dated Treasuries is actively escalating pressure on U.S. fiscal and trade policy.
Higher Treasury yields transmit immediately into mortgage rates, corporate borrowing costs, and federal debt servicing expenses, creating mechanically binding economic pressure. Equity declines, by contrast, operate through slower wealth-effect channels, which is why analysts at Wolfe Research, Bloomberg Opinion, and the Financial Times now identify yield movements as the primary policy constraint.
With headline CPI accelerating from 2.9% in January 2026 to 3.8% in April 2026, the Fed has stated it requires greater confidence that inflation is moving sustainably toward 2% before cutting rates. This effectively removes monetary easing as a circuit breaker for rising yields, leaving bond market pressure on policy both more intense and more durable than in prior cycles.
Analysts currently identify yields in the mid-to-upper 4% range on the 10-year and low-to-mid 5% range on the 30-year as the pressure zone where financial conditions tighten materially across mortgages, corporate debt, and federal borrowing simultaneously. No single basis-point level has been publicly codified as an official trigger, but the 10-year reaching 4.66%-4.67% and the 30-year at 5.18% as of 19 May 2026 sit squarely within that zone.
Geopolitical tensions raise oil prices, which lift inflation expectations, which push Treasury yields higher, which compounds fiscal and monetary stress for the U.S. government. This transmission channel, outlined in a Wolfe Research note from 19 May 2026, is the mechanism by which bond markets can pressure White House policy on geopolitical fronts rather than equity index moves.