
Pro Medicus has grown revenue at 33.4% per year for three years, earns a 99.8% gross margin, and holds more cash than debt. Yet the Pro Medicus share price has fallen more than 41% since the start of 2026.
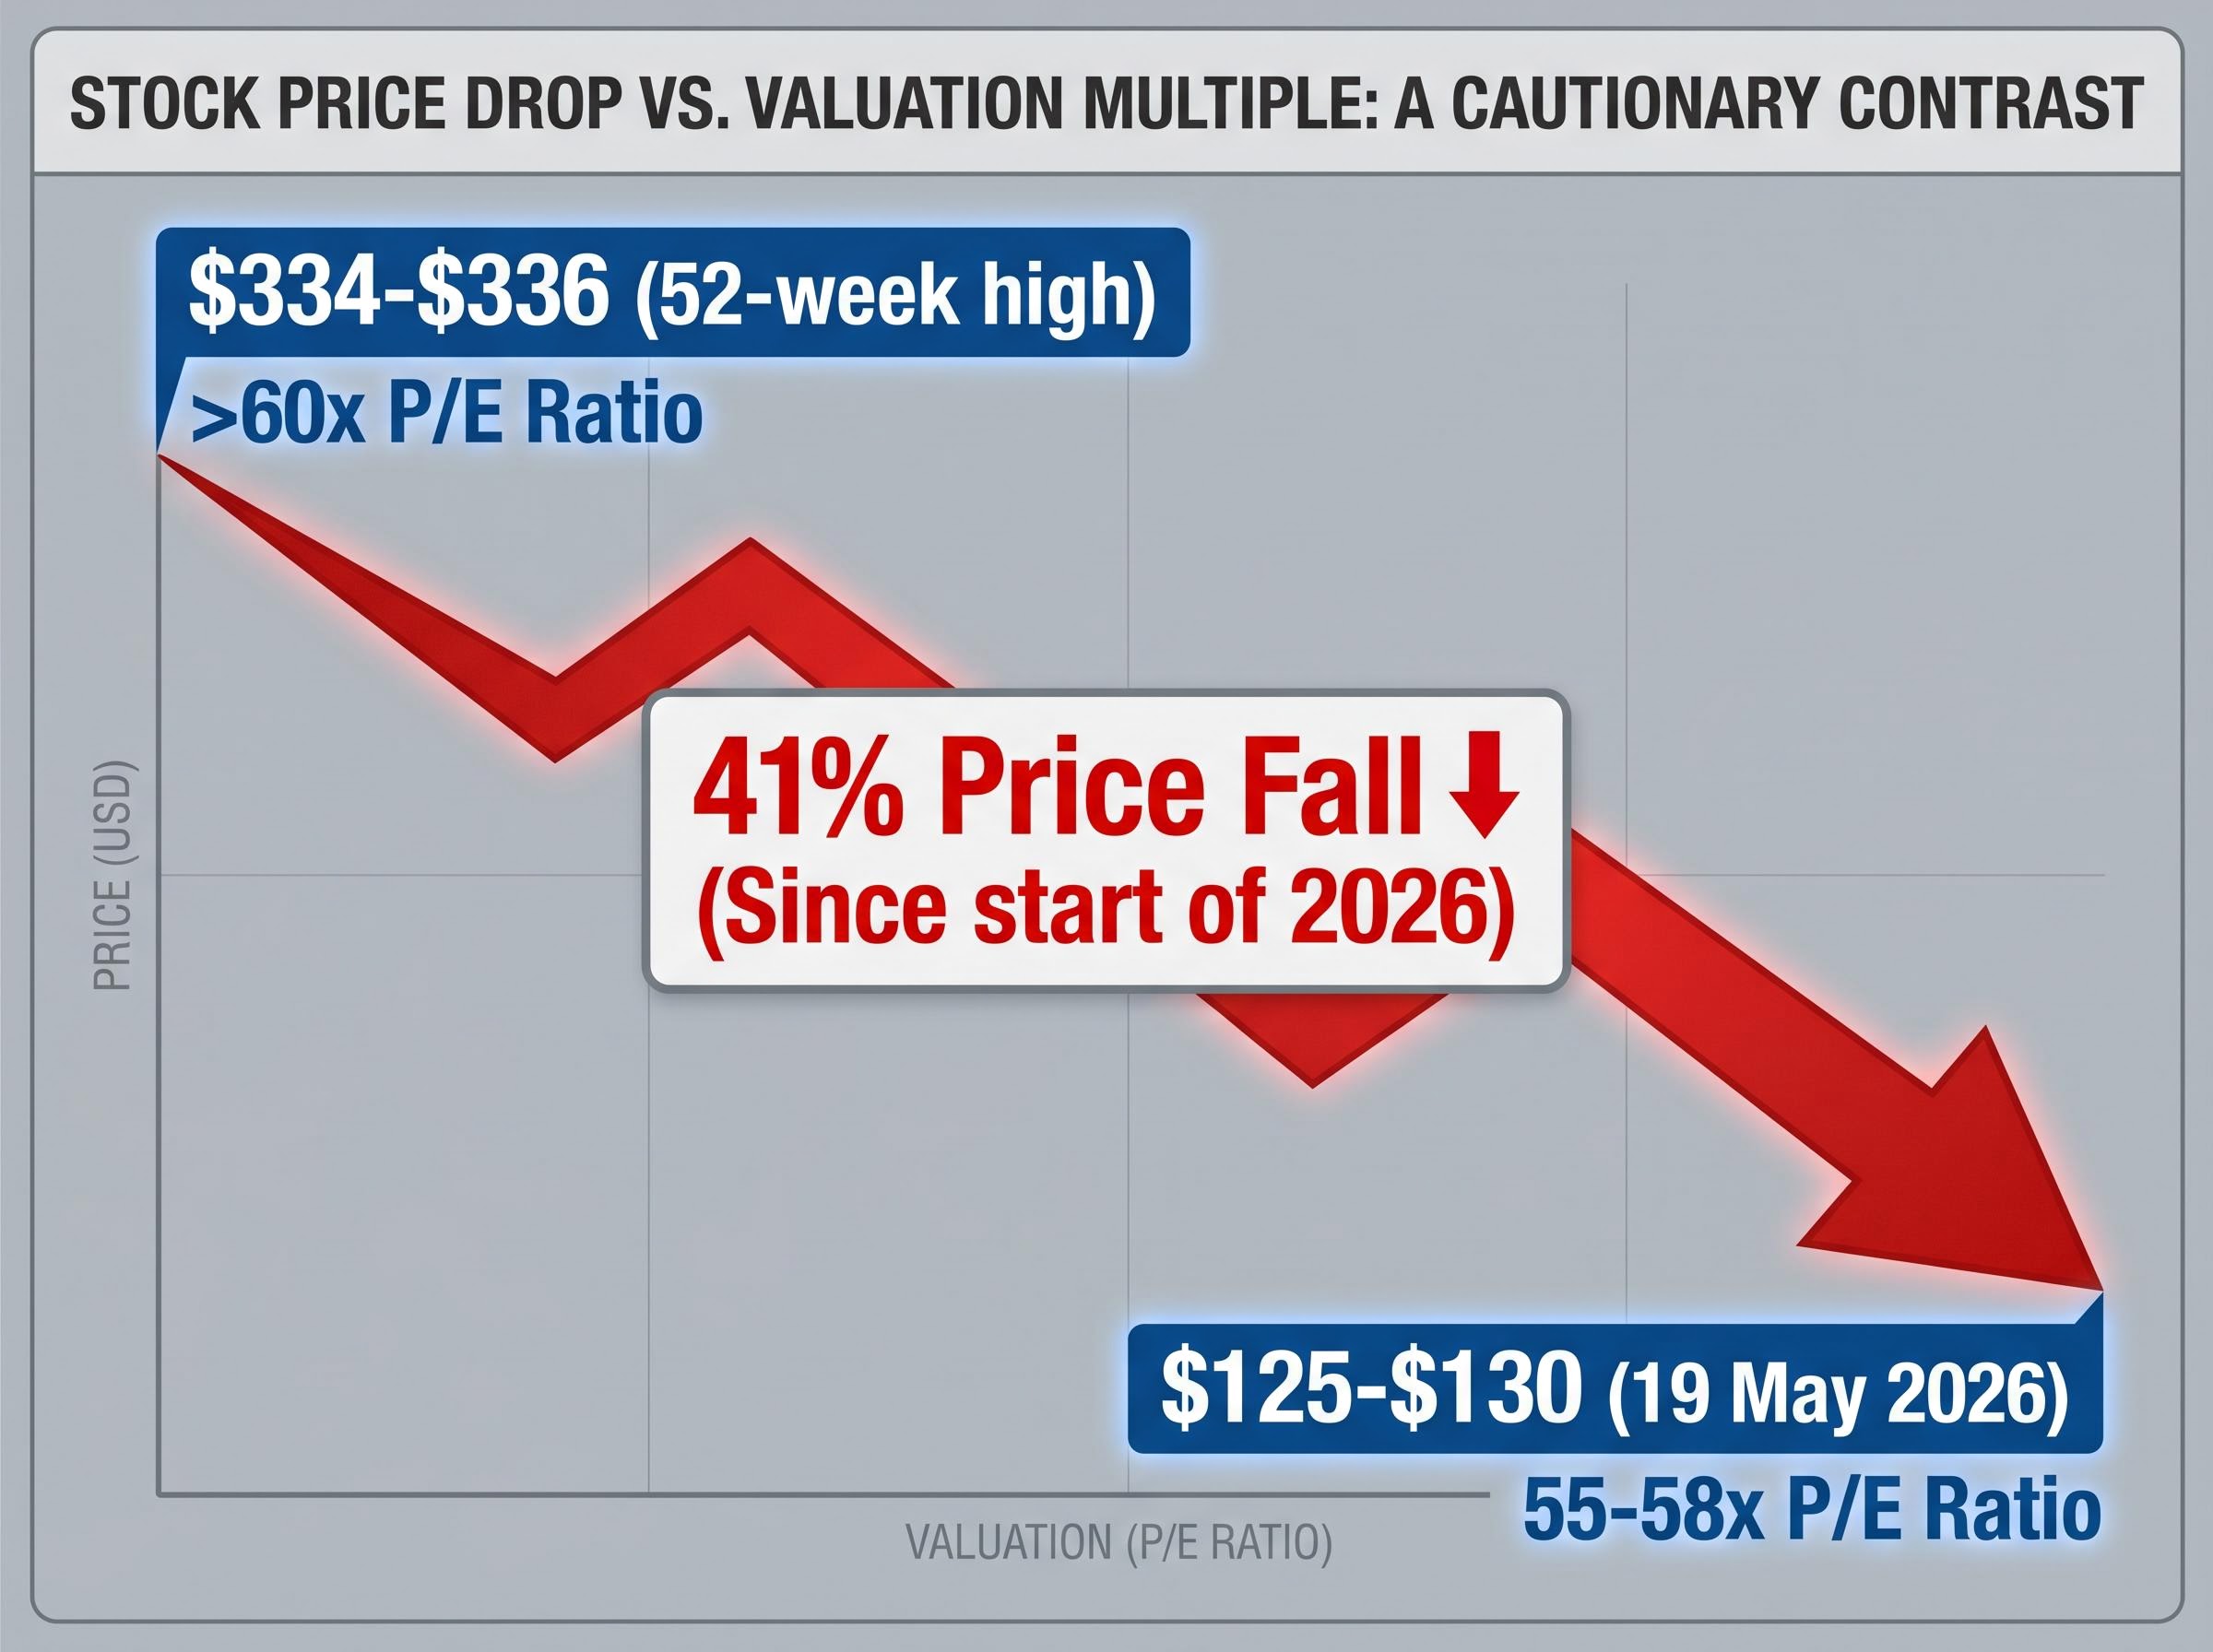
As of 19 May 2026, PME trades around $125, down from a 52-week high above $334. For retail investors watching a stock they may have considered too expensive at $250-plus suddenly sitting 41% lower, the question is instinctive: is this a buying opportunity?
The honest answer requires separating two distinct questions: how good is the business, and how good is the price. This analysis works through both systematically, covering what PME actually does, what its three-year financials reveal, why the share price fell without any apparent deterioration in fundamentals, and what retail investors need to weigh before treating a price decline as a signal to buy.
What Pro Medicus actually does, and why its market position matters
Pro Medicus was founded in 1983 and is listed on the ASX, serving a global customer base of healthcare institutions. The company operates in radiology IT, building the software that hospitals and imaging centres use to store, distribute, and interpret medical images.
Its product suite spans three core categories:
- Radiology Information Systems (RIS): Software that manages the administrative and clinical workflow of radiology departments, from scheduling to reporting.
- Picture Archiving and Communication Systems (PACS): Digital infrastructure for storing and retrieving medical images, replacing film-based systems.
- Advanced visualisation: Tools that allow clinicians to manipulate and interpret complex imaging data, including 3D reconstruction.
The product that separates PME from competitors is Visage, its proprietary imaging platform. Visage enables radiologists to access and interpret large imaging files remotely, including via mobile devices, at speeds that competing platforms struggle to match.
This matters because healthcare IT infrastructure is inherently sticky. Once a hospital system integrates imaging and workflow software across departments, switching costs become substantial. The combination of speed, remote access, and deep workflow integration gives PME pricing power and customer retention rates that directly underpin its financial performance.
The competitive dynamics PME operates within are evolving, with smaller ASX-listed peers investing heavily in radiology workflow automation through AI-driven platforms that embed deeply into existing RIS/PACS infrastructure, creating switching cost structures that mirror the same retention logic that underlies PME’s own customer economics.
When big ASX news breaks, our subscribers know first
Three years of financials that explain the premium PME has always commanded
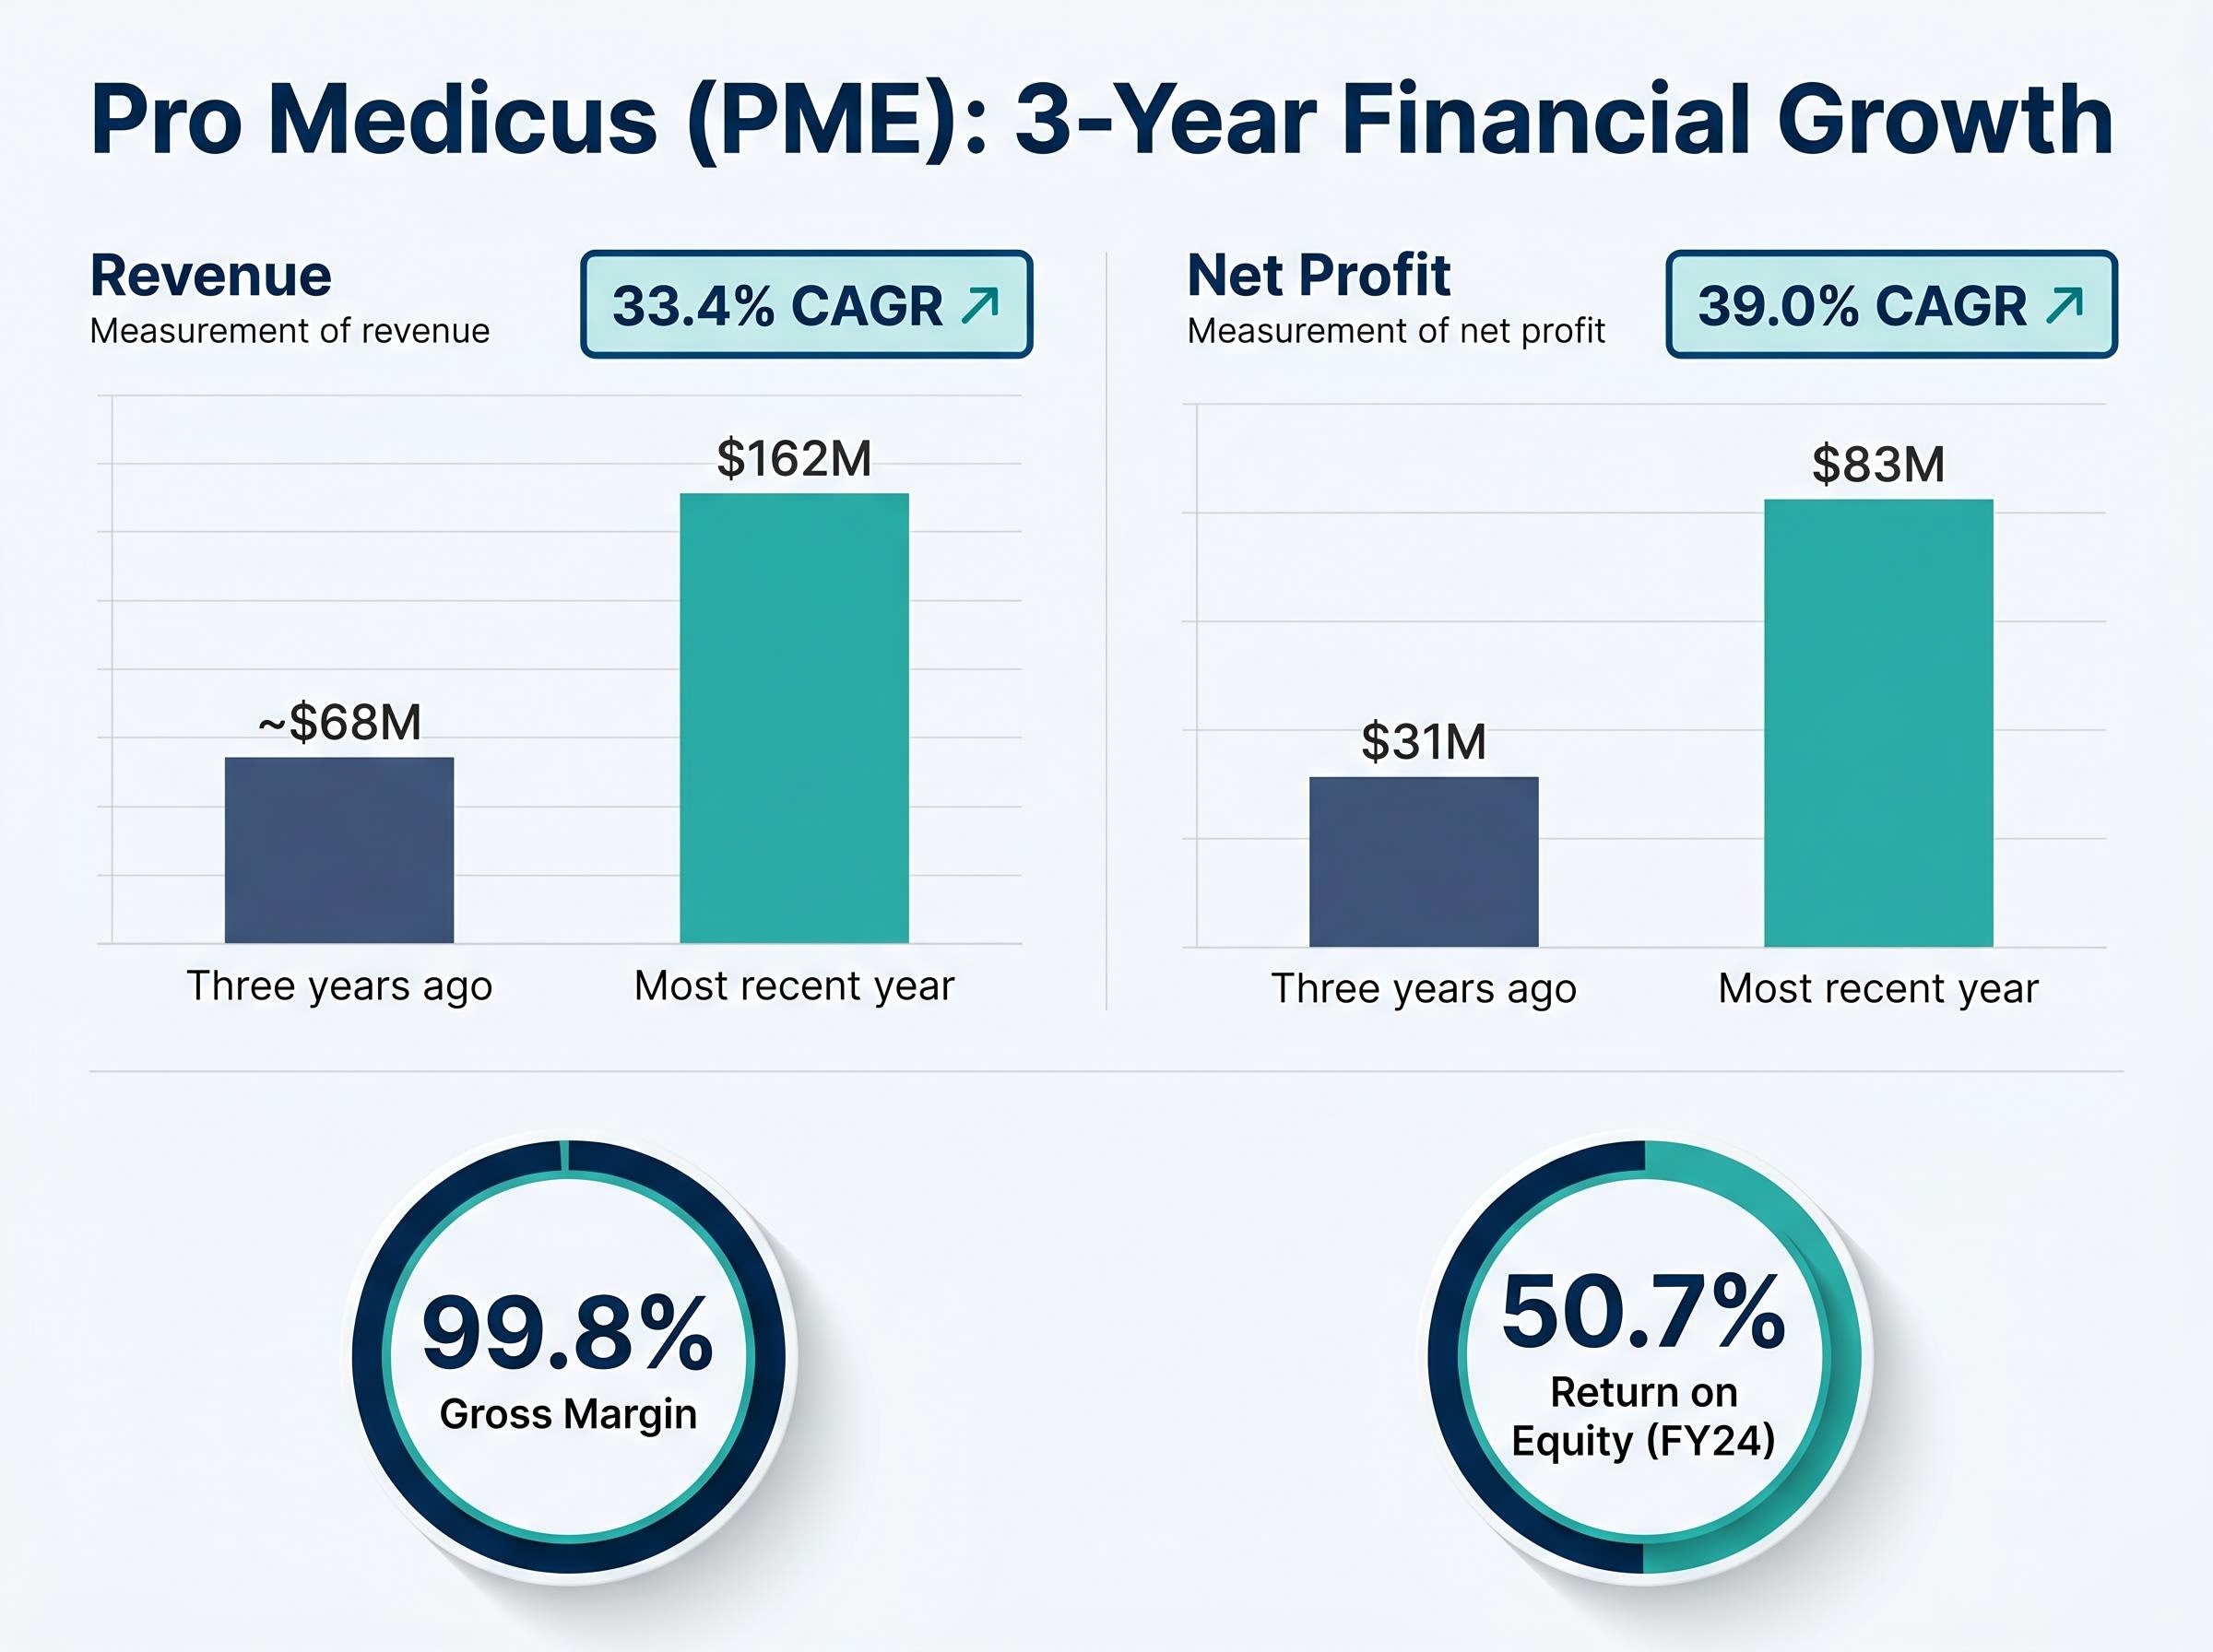
Start with revenue. PME reported $162 million in its most recent financial year. Over the preceding three years, that revenue base grew at a compound annual rate of 33.4%, a pace that would be exceptional in any sector, not merely healthcare IT.
Then consider what kind of revenue this is. PME’s gross margin sits at 99.8%.
“A 99.8% gross margin is not a formatting error. It reflects a pure software model where the incremental cost of serving an additional customer is near zero.”
That margin means virtually every dollar of revenue flows through to cover operating expenses and generate profit. The result: net profit grew from $31 million three years ago to $83 million in the most recent year, a three-year compound annual growth rate of 39.0%.
The figure that ties it together is return on equity (ROE), which measures how much profit a company generates for each dollar of shareholder equity invested in the business. PME’s ROE for FY24 was 50.7%, meaning every dollar of shareholder equity produced roughly 50 cents of annual profit.
| Metric | Three years ago | Most recent year | CAGR / current |
|---|---|---|---|
| Revenue | ~$68M | $162M | 33.4% |
| Net profit | $31M | $83M | 39.0% |
| Gross margin | 99.8% (point-in-time, most recent year) | ||
| Return on equity | 50.7% (FY24) | ||
These are the metrics that justified the stock’s premium for years. The question for investors is whether the current share price still embeds an appropriate premium for this level of financial performance, or whether it prices in more growth than any single company can reliably deliver.
Why a 41% price fall does not necessarily mean a 41% improvement in value
PME reached a 52-week high of approximately $334-$336 before falling to around $125-$130 by 19 May 2026. The instinct for many retail investors is straightforward: a lower price means a better deal. The reality is more complicated.
The decline has been driven by multiple compression, meaning investors are now willing to pay fewer dollars for each dollar of PME’s earnings, not by any reported decline in those earnings themselves. Three factors explain the move:
The ASX continuous disclosure obligations require listed companies to immediately notify the market of any information that a reasonable person would expect to have a material effect on price, which is why a multiple contraction event driven by sector-wide sentiment rather than company-specific news can be particularly disorienting for retail investors monitoring PME.
- Valuation sensitivity at an elevated entry point. Above $250, PME was viewed by some observers as “ridiculously expensive.” A price-to-earnings ratio above 60x left little room for any shift in sentiment.
- Sector-wide de-rating of high-multiple growth stocks. Motley Fool Australia reported on 23 April 2026 that a broad de-rating across high-growth healthcare and technology stocks was the primary driver, rather than any company-specific operational weakness.
- Broader risk-off rotation away from long-duration growth names. Investors rotated capital out of stocks whose valuations depend on earnings many years into the future, a pattern that affected ASX technology and healthcare IT names more broadly.
“A share price falling 41% tells you the price has changed. It does not tell you whether the stock is now cheap.”
Current P/E estimates sit at approximately 55-58x following the further decline since April. That multiple is lower than the 60x-plus level earlier in the year, but it still embeds significant growth expectations. A stock can remain expensive on fundamental metrics even after a 41% price decline, if the starting multiple was high enough.
Multiple contraction of the kind that drove PME’s decline is precisely the scenario where relying on a single share valuation methods approach produces the most misleading signals; a DCF or EV/EBITDA lens on the same stock can produce a materially different picture of intrinsic value than a trailing P/E screen, which is why cross-checking methods matters most when multiples are at extremes.
The distinction between price change and value change is the single most important analytical concept for any retail investor evaluating this opportunity.
What the balance sheet reveals about PME’s capacity to absorb risk
Net debt measures the difference between a company’s total borrowings and its cash holdings. A negative net debt figure means cash on hand exceeds outstanding debt, giving the business a financial cushion that does not depend on external lenders.
PME’s balance sheet sits firmly in that territory:
- Net debt: negative $153 million. Cash materially exceeds outstanding debt, meaning the company could retire all borrowings and still hold significant reserves.
- Debt-to-equity ratio: 1.1%. This places PME in near-debt-free territory, reducing refinancing risk and insulating the business from interest rate movements.
- Return on equity: 50.7% (FY24). Bridging back to the income statement, this figure confirms that the capital efficiency generating those returns is not being amplified by leverage. The returns are organic.
Return on equity signals like PME’s 50.7% figure carry an important caveat: a high ROE driven by heavy borrowing can flatter a business that is actually capital-inefficient, which is why cross-checking return on equity signals against the debt-to-equity ratio is a standard step in any fundamental analysis framework.
A clean balance sheet does not make a stock cheap. It does, however, reduce one category of investment risk. If revenue growth were to slow, PME would not face the compounding pressure of debt servicing costs on top of operational challenges. For investors assessing downside risk, this financial structure means the business quality is not being obscured by leverage.
What analyst consensus and valuation multiples tell Australian investors right now
Sell-side analyst targets provide one reference point for where professional market participants see the stock heading over the next 12 months. The current consensus leans bullish.
| Source | Average target | Rating summary |
|---|---|---|
| TradingView | ~$191 | Consensus buy |
| Yahoo Finance / Investing.com | ~$182 | ~12 buy ratings out of 15 analysts |
| Morgans | $210 | Buy (target trimmed, 23 April 2026) |
These targets imply meaningful upside from current levels. Morgans retained its buy rating and trimmed its price target to $210 as reported on 23 April 2026, while the broader consensus clusters between $182 and $191.
What a 55-58x P/E multiple means in practice
Consensus targets and buy ratings are useful data points, but they follow price momentum as often as they lead it. The more revealing signal is what the current multiple demands of the business going forward.
A P/E ratio of 55-58x means investors are paying $55-$58 for every $1 of current earnings. That price only produces a satisfactory return if earnings continue growing at well above market rates for an extended period. If growth slows to 15-20%, or if a contract cycle stalls, the multiple faces further compression regardless of what consensus targets suggest.
P/E ratio limitations become most consequential at extreme multiples, where small changes in assumed growth rates compress or expand the implied valuation by amounts that dwarf normal market fluctuations; the gap between a 55x and a 45x multiple on PME’s current earnings base represents roughly $16 per share, illustrating why multiple contraction can drive sharp price moves even when the underlying business has not changed.
For retail investors, the framework is direct: business quality and price paid are both variables in any investment outcome. A high-quality business purchased at the wrong price can still deliver poor returns over a multi-year holding period. Analyst targets are one input in that assessment, not a verdict.
A 41% decline sharpens the question, it does not answer it
PME remains a demonstrably high-quality business by every operational metric covered in this analysis. Revenue growth of 33.4%, a near-perfect gross margin, a 50.7% ROE, and a debt-free balance sheet are not characteristics shared by many ASX-listed companies.
The share price decline has not changed any of those fundamentals. What it has changed is the multiple investors are willing to pay, and at 55-58x earnings, that multiple still embeds a bet on sustained, above-market growth execution for years to come.
The question is not whether PME is a good business. The question is whether the current price adequately compensates for the risk that future growth falls short of what the multiple demands.
Further independent valuation work, including an investor’s own assessment of the forward growth assumptions baked into current multiples, is a necessary step before treating this price decline as a signal to act. PME’s trajectory depends on continued contract wins and earnings growth. Investors buying at current levels are making a specific bet on that continuation.
This article is for informational purposes only and should not be considered financial advice. Investors should conduct their own research and consult with financial professionals before making investment decisions. Past performance does not guarantee future results. Financial projections are subject to market conditions and various risk factors.