How ASX’s CHESS Overhaul Became a $250M Governance Failure
Jul 6, 2026

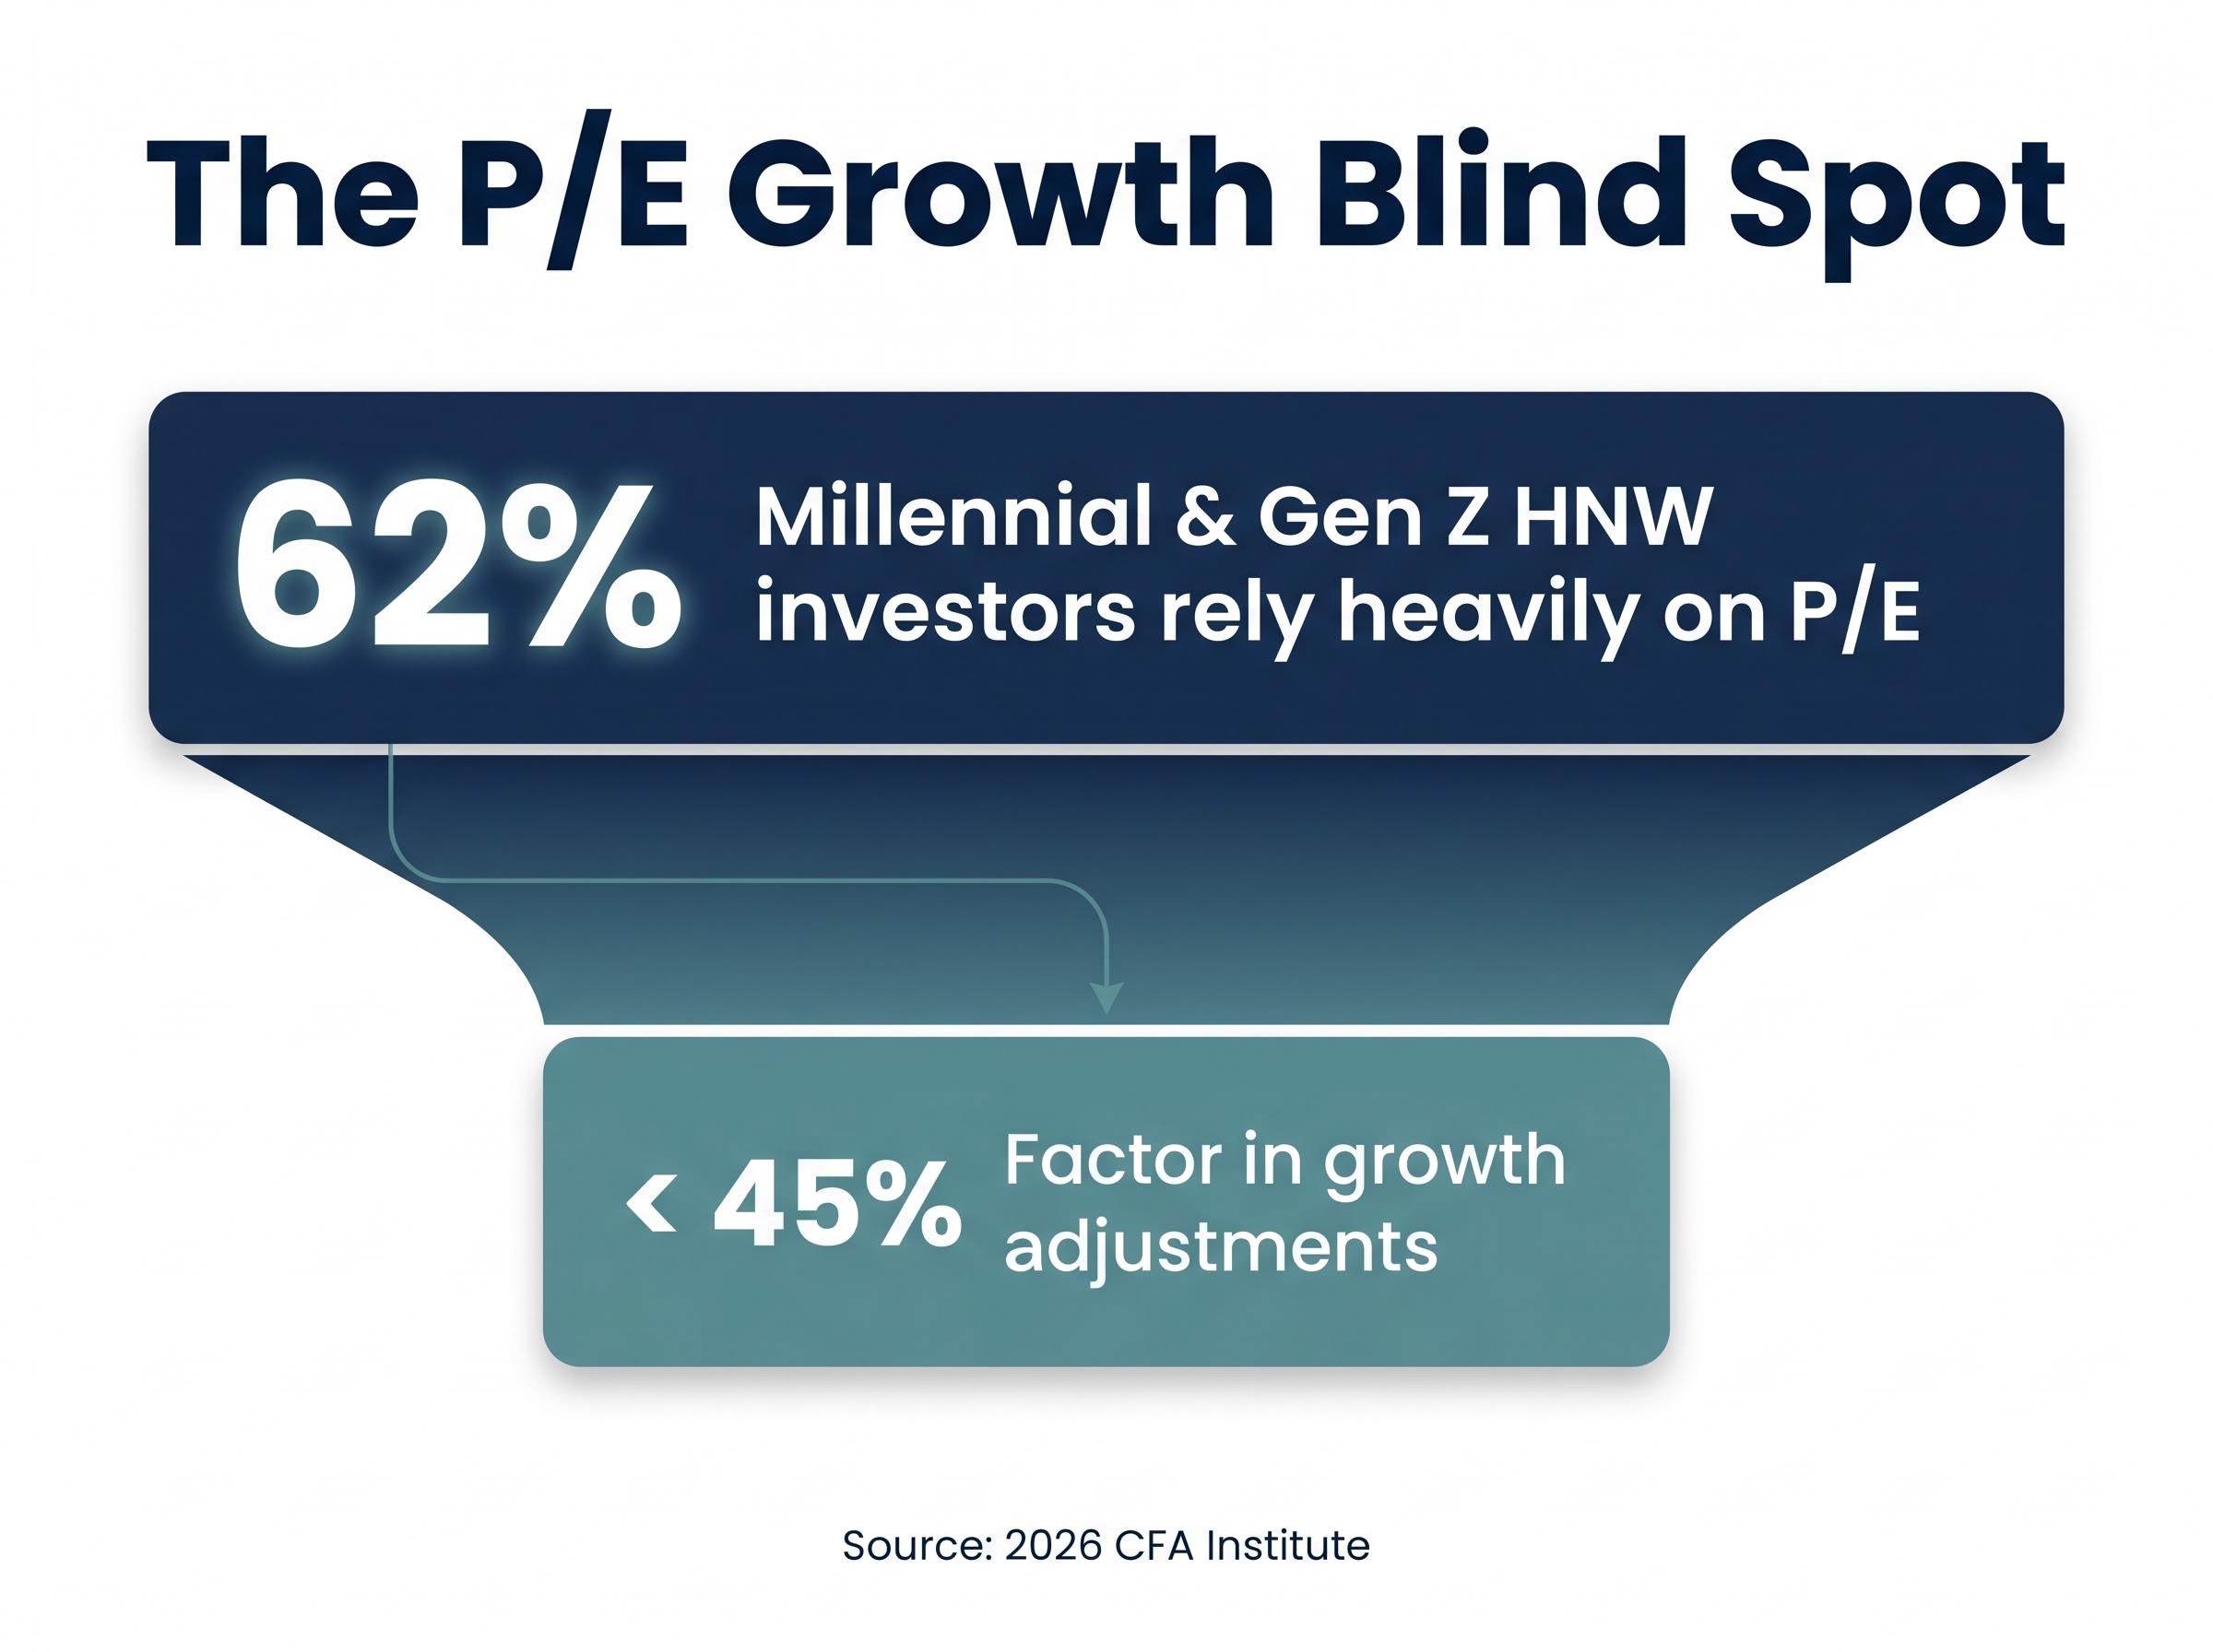
Sixty-two per cent of millennial and Gen Z high-net-worth investors globally rely heavily on the price-to-earnings ratio when evaluating stocks, according to a 2026 CFA Institute report. Fewer than 45% of those investors adjust for growth when interpreting that number. The most popular valuation shortcut in retail investing is also one of the most frequently misunderstood. Net profit and the P/E ratio are the first stock valuation metrics most investors encounter, and they remain the most widely cited figures in financial media. That ubiquity creates a false sense of reliability. Understanding precisely where these metrics break down, and what to use instead, is one of the most practical upgrades available to any investor’s analytical toolkit. What follows explains the specific failure modes of net profit and P/E, introduces the alternative metrics that analysts and finance educators consistently recommend, and delivers a practical multi-metric framework readers can apply immediately.
Net profit, the figure sitting at the bottom of the income statement after all expenses and taxes have been deducted, became the standard shorthand for business health because it answers the most intuitive question an investor can ask: did this company make money? The P/E ratio extended that logic into valuation by dividing the share price by earnings per share, producing a single number that appears to answer a second intuitive question: is this stock expensive or cheap?
Both metrics are genuinely useful as starting points. They compress complex financial realities into figures that can be compared across companies, sectors, and time periods in seconds. The problem lies not in the metrics themselves but in how they are used.
P/E and net profit sit within a broader set of fundamental analysis metrics that each answer a different question about the same company; EPS, revenue growth, profit margins, and return on equity collectively provide a more complete picture than any single figure examined in isolation.
CFA Institute, 2026: Sixty-two per cent of millennial and Gen Z high-net-worth investors globally rely heavily on P/E ratios, yet fewer than 45% factor in growth adjustments when interpreting that figure.
Morningstar’s 2026 Investor Perspectives Report reinforced this finding, identifying widespread over-reliance on simple earnings-based metrics among retail investors broadly, a pattern the report correlated with suboptimal investment decisions. Financial media’s frequent citation of P/E as a primary comparison tool has cemented the ratio as a first instinct rather than a first step. The sections that follow examine what that instinct misses.
Before examining where these metrics fail, it is worth establishing exactly what each one captures and, more importantly, what each one quietly assumes to be true.
Net profit equals revenue minus all costs, taxes, and interest, including non-cash items such as depreciation and amortisation. It is an accounting figure, not a cash figure. Three assumptions are embedded in it:
The P/E ratio divides the current share price by earnings per share. A P/E of 20 means the market is pricing in 20 years of current earnings. Its core assumptions are equally specific:
For companies reporting a net loss, P/E becomes undefined or meaningless altogether, which is a direct mechanical limitation that affects a significant portion of listed equities at any given time.
Net profit is an accounting output, and accounting offers choices. Those choices can move the reported number materially without any change in the underlying cash economics of the business.
Three distortion mechanisms appear most frequently in practitioner commentary.
| Distortion Mechanism | How It Works | Effect on Net Profit |
|---|---|---|
| Depreciation policy | Management selects the rate at which assets are written down. Accelerated depreciation reduces profit faster; slower schedules inflate it. | Directly raises or lowers reported net profit with no change to cash generation |
| One-off item exclusion | Companies present “adjusted” earnings figures that selectively remove losses or costs classified as non-recurring. | Inflates adjusted net profit by stripping out real costs that may recur |
| Aggressive revenue recognition | Revenue is booked before cash is received, or channel stuffing pushes product to distributors to inflate top-line figures prematurely. | Inflates net profit in the recognition period; creates a gap between earnings and cash flow |
The gap between reported and adjusted earnings is most visible during earnings season, when non-GAAP earnings adjustments in press releases routinely exclude items companies classify as non-recurring but which analysts often find repeating across multiple reporting periods.
The most consequential distortion for investors is the gap between positive net profit and negative free cash flow. A company can report healthy earnings on its income statement while actually consuming cash, a situation that is invisible to anyone relying solely on the bottom line. Practitioners consistently warn that one-year earnings figures are vulnerable to single-year anomalies that do not represent ongoing performance.
These distortions are not always deliberate fraud. Many are legal accounting choices within established standards. They nonetheless obscure economic reality, and recognising that net profit is an accounting figure rather than a cash figure is one of the most consequential conceptual shifts a retail investor can make.
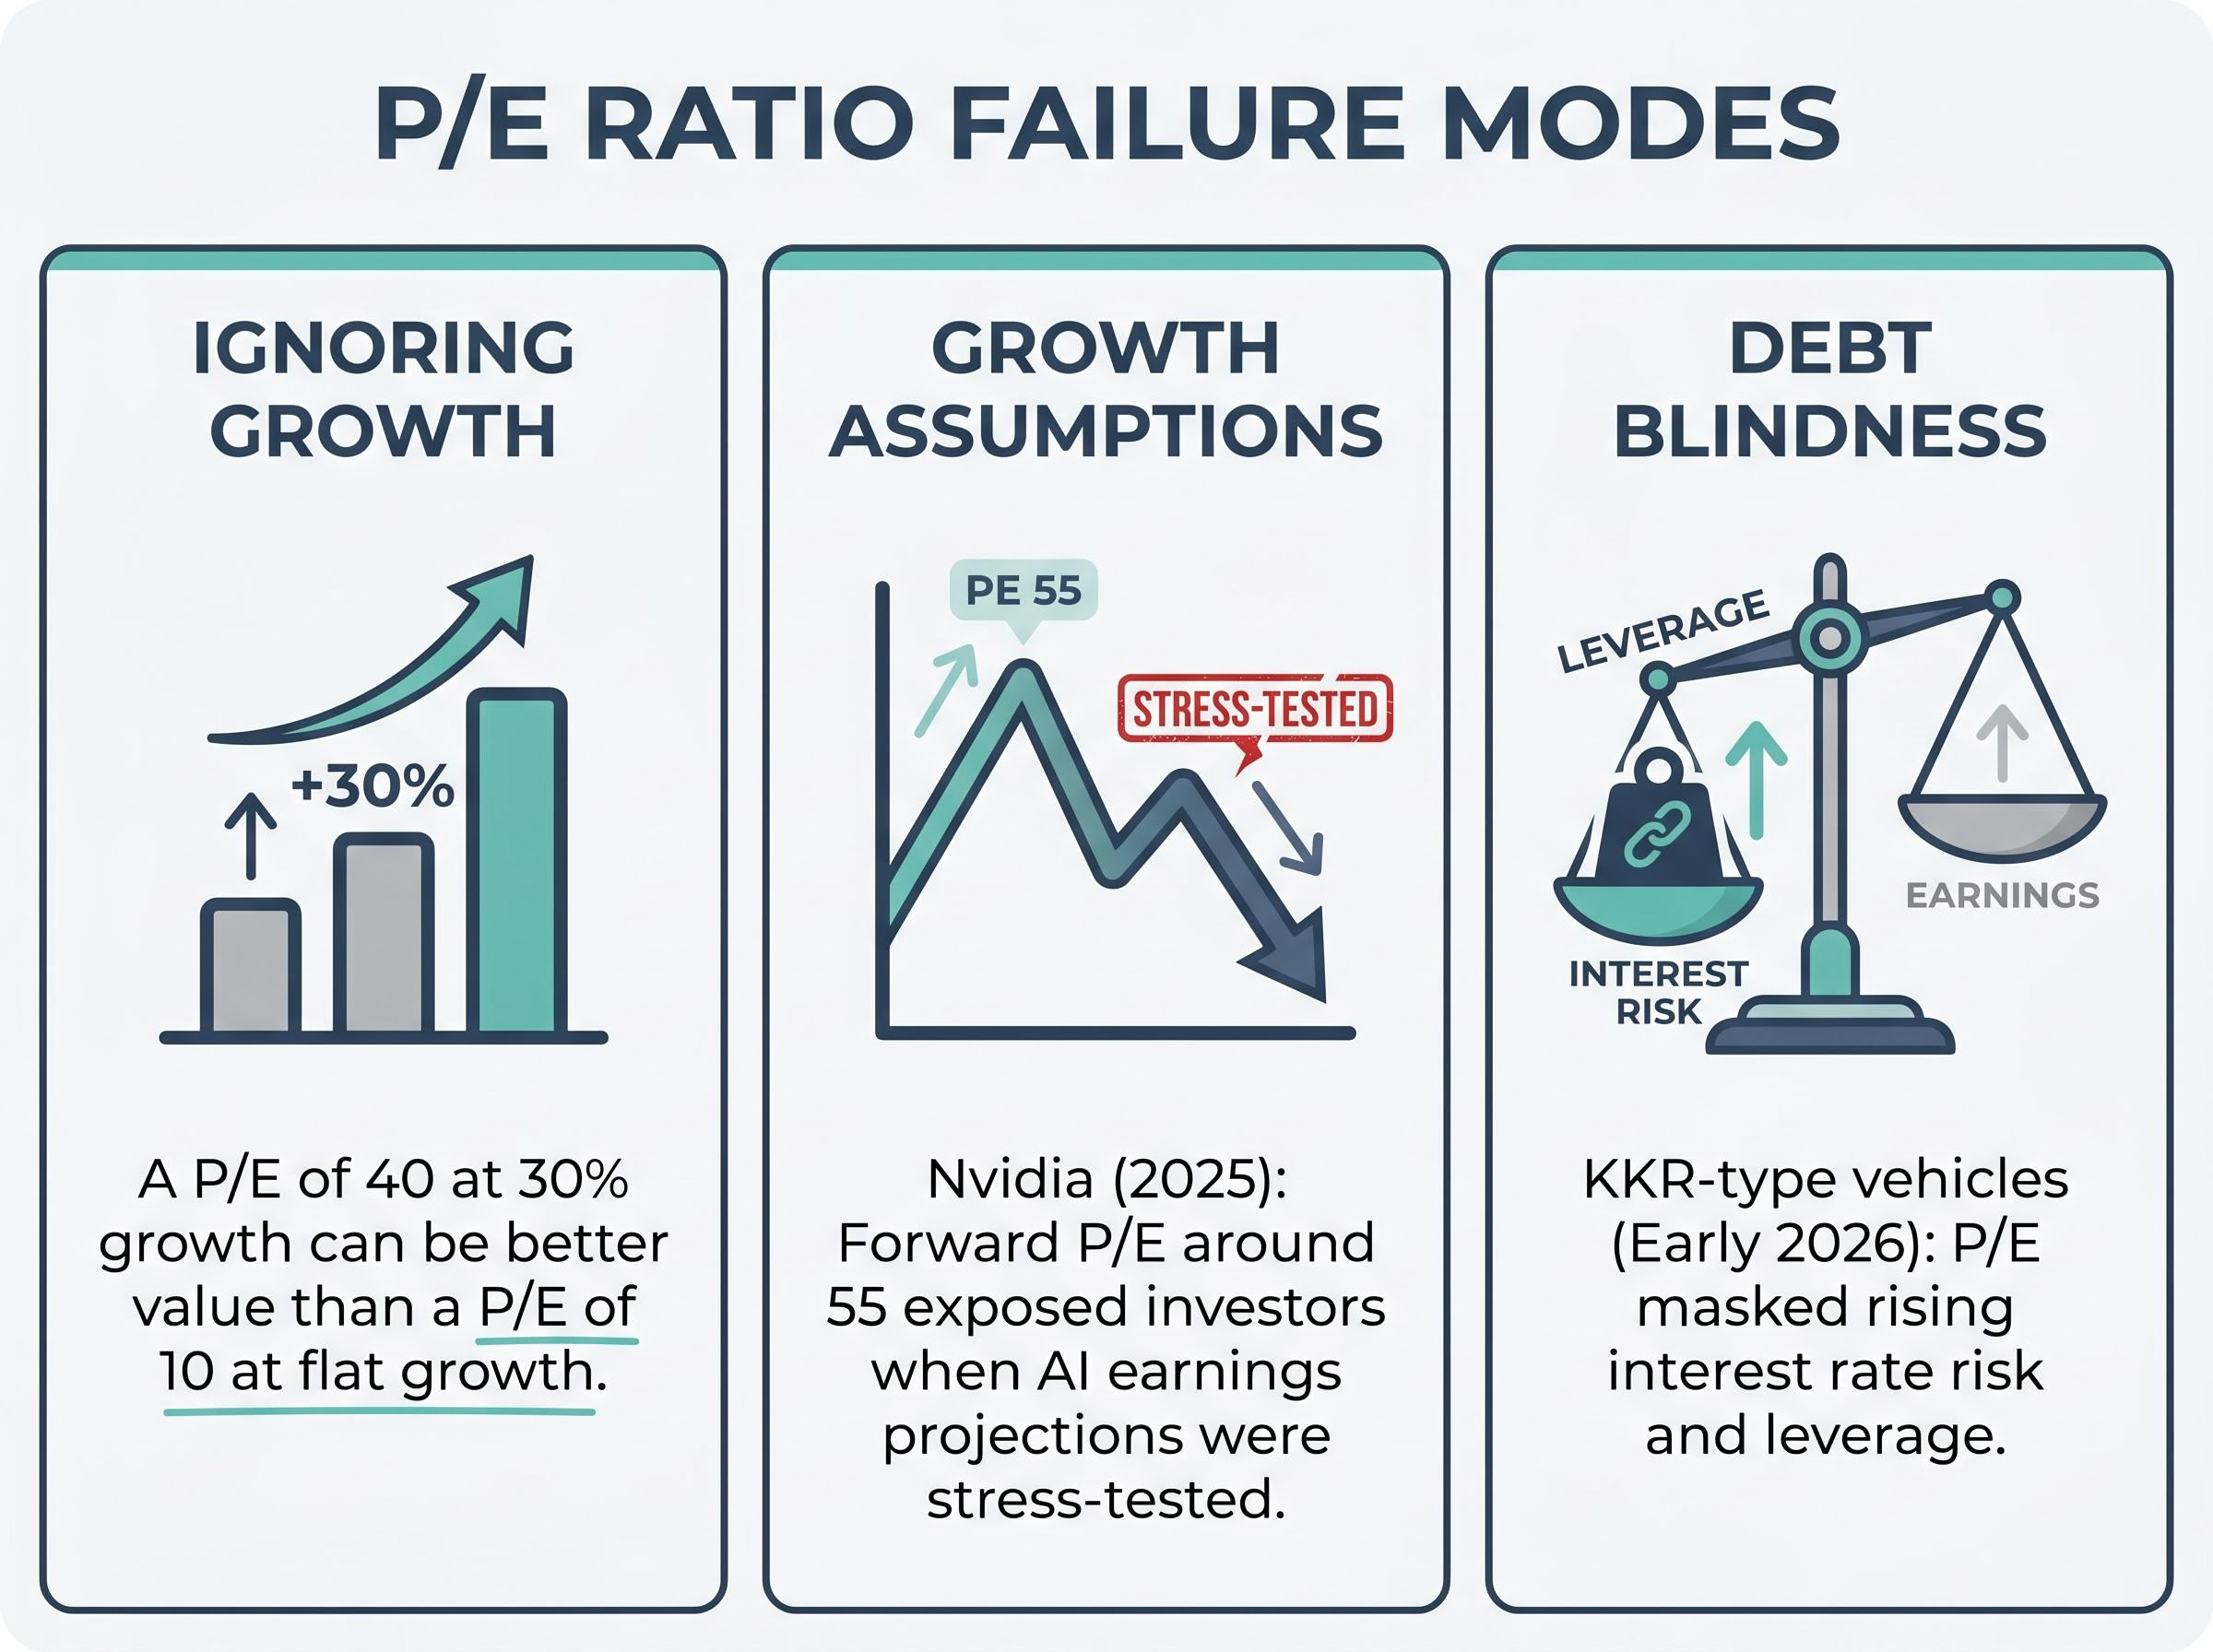
The P/E ratio’s limitations are not theoretical. They have produced identifiable losses for real investors in recent years, and the failure modes follow predictable patterns.
Four core failure modes recur across practitioner and educator commentary:
Nvidia in 2025 illustrated the growth-assumption risk with precision. The chipmaker’s forward P/E hovered around 55, premised on aggressive AI-driven earnings growth projections. When those assumptions were stress-tested against actual earnings volatility and valuation sensitivity, price corrections followed. Investors who had relied on forward P/E without examining the underlying cash flow assumptions found themselves exposed to a downside the multiple had not signalled.
Growth stock valuation discounts of the kind documented by Morningstar in early 2026, where technology equities including Nvidia traded at a 21% discount to estimated fair value, illustrate precisely how sensitive high-P/E stocks are to shifts in earnings growth assumptions, the same vulnerability the PEG ratio is designed to surface.
A different failure mode appeared in private equity structures, including KKR-type vehicles, in early 2026. P/E expansion in these stocks masked rising interest rate risk embedded in their portfolio companies. The resulting underperformance highlighted how earnings-based multiples can obscure leverage and rate sensitivity, costs that were visible in cash flow and debt service metrics but invisible in P/E. The pattern echoes the broader tech bubble lesson that educators have cited consistently across 2024-2026: high P/E ratios in growth stocks can mask an absence of free cash flow generation.
Each failure mode identified above has a corresponding metric designed to address it. The goal is not to discard P/E but to know which supplementary tool corrects which specific blind spot.
The PEG ratio (P/E divided by the earnings growth rate) directly addresses P/E’s growth blindness. A PEG below 1.0 is generally considered a signal of potential undervaluation; above 1.0 suggests potential overvaluation, according to widely cited Investopedia benchmarks. The PEG ratio forces growth into the equation, making it far harder to confuse a cheap stagnating business with an expensive fast grower.
Price-to-Free-Cash-Flow (P/FCF) corrects the net profit distortions outlined earlier. Free cash flow strips away the accounting choices that inflate or deflate net profit, measuring the actual cash a business generates after capital expenditure. It is harder to manipulate and more directly tied to a company’s ability to fund operations, pay dividends, and service debt.
EV/EBITDA solves P/E’s debt blindness. Enterprise Value (market capitalisation plus net debt) replaces the share price in the numerator, while EBITDA (earnings before interest, taxes, depreciation, and amortisation) removes non-cash charges from the denominator. The result is a metric that enables cross-company comparisons regardless of capital structure. A variant, EV/EBIT, retains depreciation in the calculation and is more appropriate for asset-heavy industries where depreciation reflects a genuine economic cost rather than an accounting artefact.
Price-to-Book (P/B) focuses on asset value rather than earnings. It is particularly suited to banks and asset-heavy financial companies, where reported earnings can be volatile or distorted by provisioning decisions, but the underlying book value provides a more stable valuation anchor.
Lyn Alden, a widely cited investment strategist, has advocated combining growth context with cash flow and balance sheet metrics rather than relying on any single ratio. No alternative is a universal replacement for P/E; each solves a specific problem.
A 2025 PEG ratio reliability analysis published through the CFA Institute’s Enterprising Investor platform found that while the ratio offers genuine utility at the individual stock level, its effectiveness as a broad market-timing tool is inconsistent, reinforcing the article’s position that no single metric functions as a universal valuation answer.
| Metric | What It Measures | Problem It Solves | Best Used For |
|---|---|---|---|
| PEG | P/E adjusted for earnings growth rate | P/E’s growth blindness | Comparing growth stocks to mature companies |
| P/FCF | Price relative to free cash flow | Net profit distortion and accounting manipulation | Validating reported earnings with cash reality |
| EV/EBITDA | Enterprise value relative to operating earnings before non-cash charges | P/E’s debt and capital structure blindness | Cross-company comparisons regardless of leverage |
| P/B | Price relative to net asset (book) value | Earnings volatility in asset-heavy sectors | Banks, financials, and asset-intensive industrials |
Knowing the alternative metrics is one thing. Knowing when to reach for each one, and in what order, is the step that transforms awareness into analytical practice.
The following five-step framework reflects the approach that analyst commentary across the Saxo Bank valuation guide, Lyn Alden’s investment commentary, and multiple financial education platforms converges on:
The goal is not to calculate all five metrics for every stock. It is to identify which failure modes are most relevant to the specific company under analysis and apply the corrective metric accordingly.
Multi-metric valuation frameworks that sequence P/S screening, EV/EBITDA benchmarking, and DCF analysis into a structured workflow reduce the risk of conviction errors that arise when a single ratio dominates an investment decision, a pattern documented in both ASX-focused and global equity research.
Three company archetypes illustrate how the framework adapts in practice. High-growth unprofitable companies, where P/E is inapplicable because earnings are negative, are best assessed through P/FCF and EV/EBITDA, which can function regardless of whether the bottom line is positive. Capital-intensive mature businesses benefit from EV/EBIT and EV/EBITDA, which account for the significant depreciation charges that distort net profit in these sectors. Financial sector companies, including banks, are best served by P/B as the primary metric, with P/E playing a supporting role, because book value provides a more stable valuation reference than volatile quarterly earnings.
P/E and net profit are useful entry points, not complete answers. The 2026 CFA Institute and Morningstar survey data confirm that treating them as complete answers is the specific error most retail investors make. The corrective toolkit, PEG for growth context, P/FCF for cash reality, EV/EBITDA for debt-adjusted comparison, and P/B for asset-heavy sectors, addresses each known failure mode with a specific instrument.
As retail investor participation in global markets continues to grow, the gap between investors who apply multi-metric frameworks and those who rely on P/E alone is likely to widen in terms of both analytical quality and investment outcomes. Free cash flow data and EV/EBITDA figures are available on most standard financial data platforms at no cost. Running the next stock analysis through at least two of the alternative metrics covered above is a practical first step toward closing that gap.
This article is for informational purposes only and should not be considered financial advice. Investors should conduct their own research and consult with financial professionals before making investment decisions.
The PEG ratio divides the P/E ratio by the earnings growth rate, adjusting for the growth blindness that makes raw P/E misleading. A PEG below 1.0 is generally considered a signal of potential undervaluation, while above 1.0 suggests potential overvaluation.
Net profit is an accounting figure, not a cash figure, meaning management choices around depreciation schedules, one-off item exclusions, and revenue recognition can move the reported number materially without any change to the underlying cash economics of the business.
Price-to-Book (P/B) is the most appropriate primary metric for banks and financial sector companies because book value provides a more stable valuation anchor than quarterly earnings, which can be volatile or distorted by provisioning decisions.
EV/EBITDA replaces share price with Enterprise Value (market capitalisation plus net debt) and removes non-cash charges from the denominator, making it suitable for cross-company comparisons regardless of capital structure, a blind spot that P/E cannot address.
Price-to-Free-Cash-Flow (P/FCF) measures a company's share price relative to the actual cash it generates after capital expenditure, stripping away the accounting choices that can inflate or deflate net profit and making it harder to manipulate than earnings-based metrics.