
The Memo That Halved Meta’s AI Infrastructure Cost Estimate
2 hrs ago

Amcor’s trailing dividend yield sits at just 1.43% against a five-year historical average of 4.38%. That gap, nearly three percentage points, raises an immediate question for ASX income investors: what does this divergence actually signal? Amcor (ASX: AMC) is one of the ASX’s most recognisable blue-chip industrials, a global packaging manufacturer with origins stretching back to the 1860s and operations across more than 200 facilities in 40 countries. For income-focused portfolios, it has historically been a reliable yield stock. The current compression is not the product of a dividend cut. It is the product of significant share-price weakness following the company’s largest-ever acquisition. Understanding why the Amcor dividend yield looks the way it does requires unpacking both the valuation signal and the structural event behind it. This analysis explains how yield comparison works as a valuation tool for mature ASX stocks, what the numbers show for Amcor right now, and what Australian income investors need to weigh before treating a compressed yield as a straightforward opportunity.
Start with the numbers, because the numbers are what make this interesting.
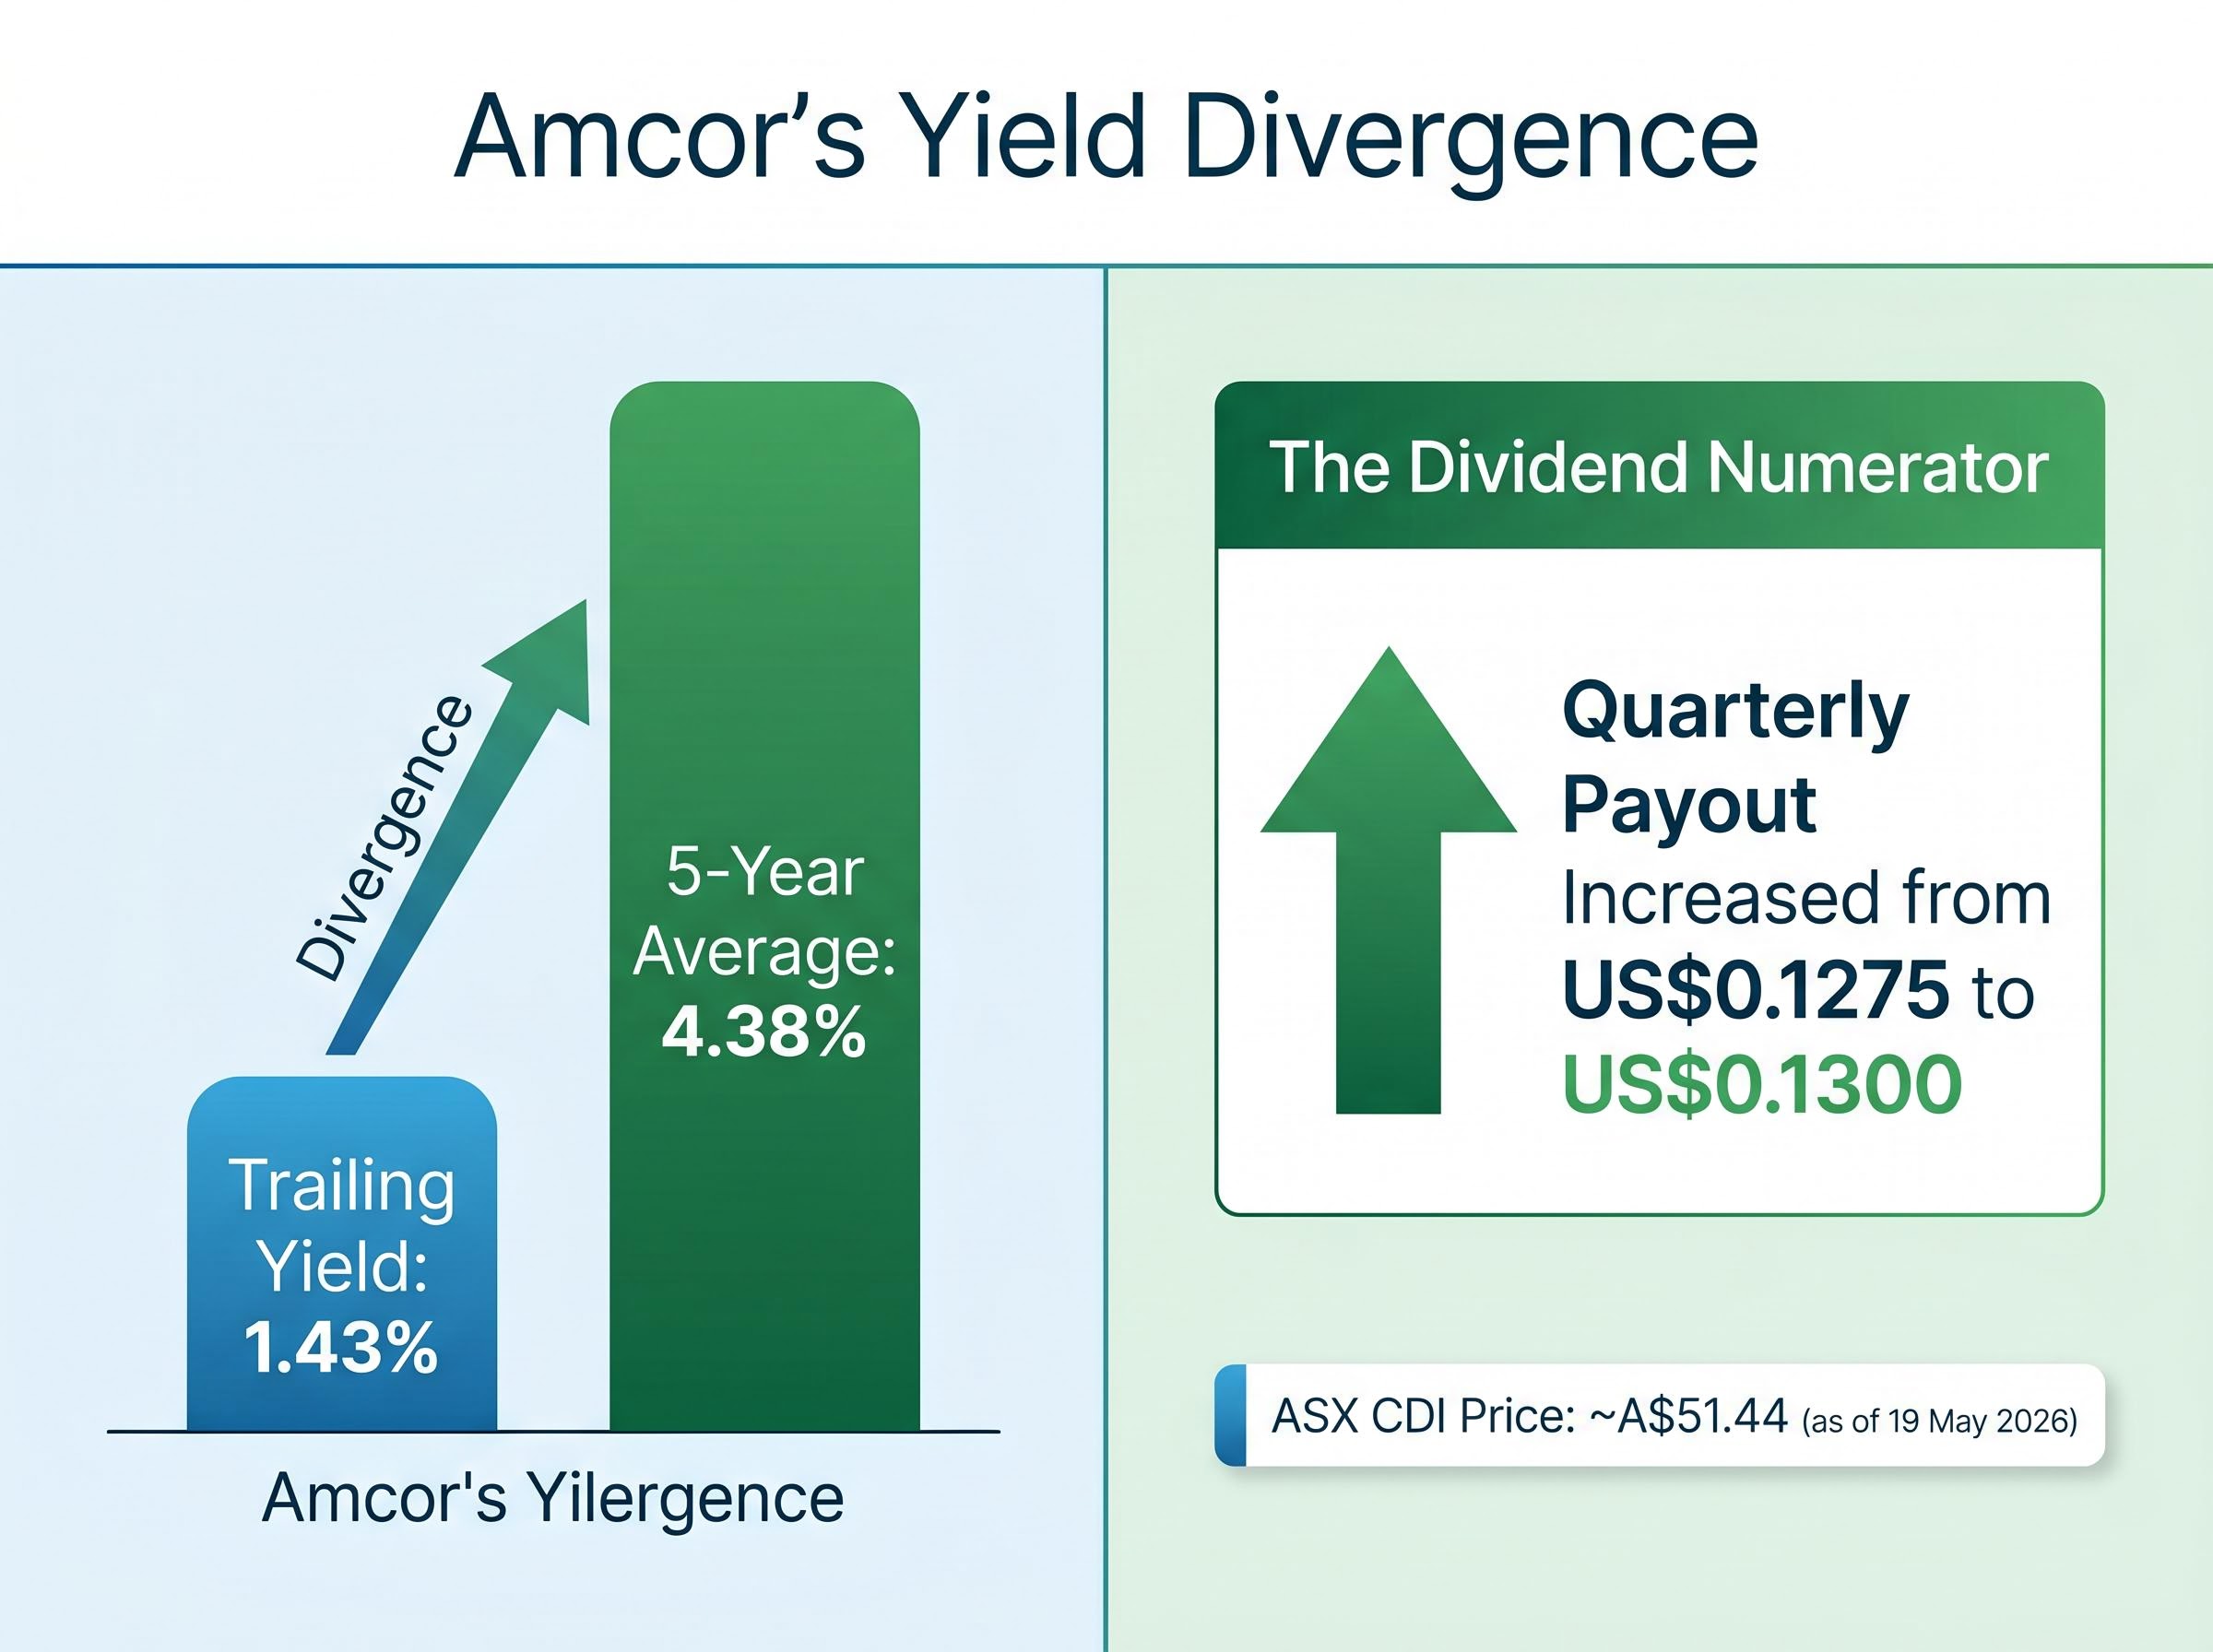
Amcor’s trailing yield of 1.43% sits nearly three percentage points below its five-year historical average of 4.38%.
A gap of that size on a stock with Amcor’s income pedigree warrants attention. But the first instinct, that the dividend must have been cut, is wrong. The quarterly payout has in fact increased modestly, from US$0.1275 to US$0.1300 per share (approximately 19.78 Australian cents per CDI). The compression is entirely a function of what has happened to the share price.
Three variables drive any dividend yield reading:
The yield compression, in other words, is a share-price story. The dividend is intact and growing. The equity has de-rated. Understanding why the price fell is the analytical work that follows.
For stable, mature, income-oriented companies, the dividend yield relative to historical norms functions as a rough guide to whether the market is pricing the stock above or below its long-run income value. When the yield is unusually low relative to history, the stock is either being bid up (a re-rating) or the dividend has been cut. When the yield is unusually high, the stock has either sold off (a de-rating) or the payout has been raised.
Dividend yield theory holds that for stable, mature income stocks, the yield tends to revert toward its long-run historical mean over time, making the gap between a stock’s current yield and its historical average a practical, if imperfect, signal of relative over- or under-valuation.
The distinction matters. A low yield driven by a rising share price signals optimism. A low trailing yield driven by a falling share price, where the denominator has moved sharply while the numerator held steady, signals something different: the market is repricing the equity lower for reasons the yield number alone cannot explain.
The relationship between yield and total return is where many income investors encounter their most costly blind spot: a rising yield caused by a falling share price does not make an investor wealthier, it merely redistributes the question of whether the underlying business can sustain its payout.
| Yield Scenario | What It Typically Signals | Investor Implication |
|---|---|---|
| Yield well above historical average | Share price has fallen or dividend has been raised | Potential value signal, but requires payout sustainability check |
| Yield in line with historical average | Price and dividend moving in proportion | Market pricing consistent with long-run income expectations |
| Yield well below historical average (Amcor’s current position) | Share price has risen sharply or fallen with a trailing metric lag | Requires investigation into what is driving the divergence |
The five-year average yield of 4.38% serves as the historical benchmark in this analysis. It is a useful reference point, not a price target.
Yield compression caused by a specific structural event, such as an acquisition-driven re-rating, requires additional analysis beyond the yield number alone. The market may be pricing in genuine earnings risk, integration uncertainty, or payout sustainability concerns. A yield comparison cannot capture any of those dynamics by itself. Dividend yield is one of several applicable valuation methods for Amcor; Discounted Cash Flow (DCF) and Dividend Discount Model (DDM) frameworks offer more comprehensive views. No single metric should drive an investment decision.
The Berry Global acquisition is the single event that explains the de-rating.
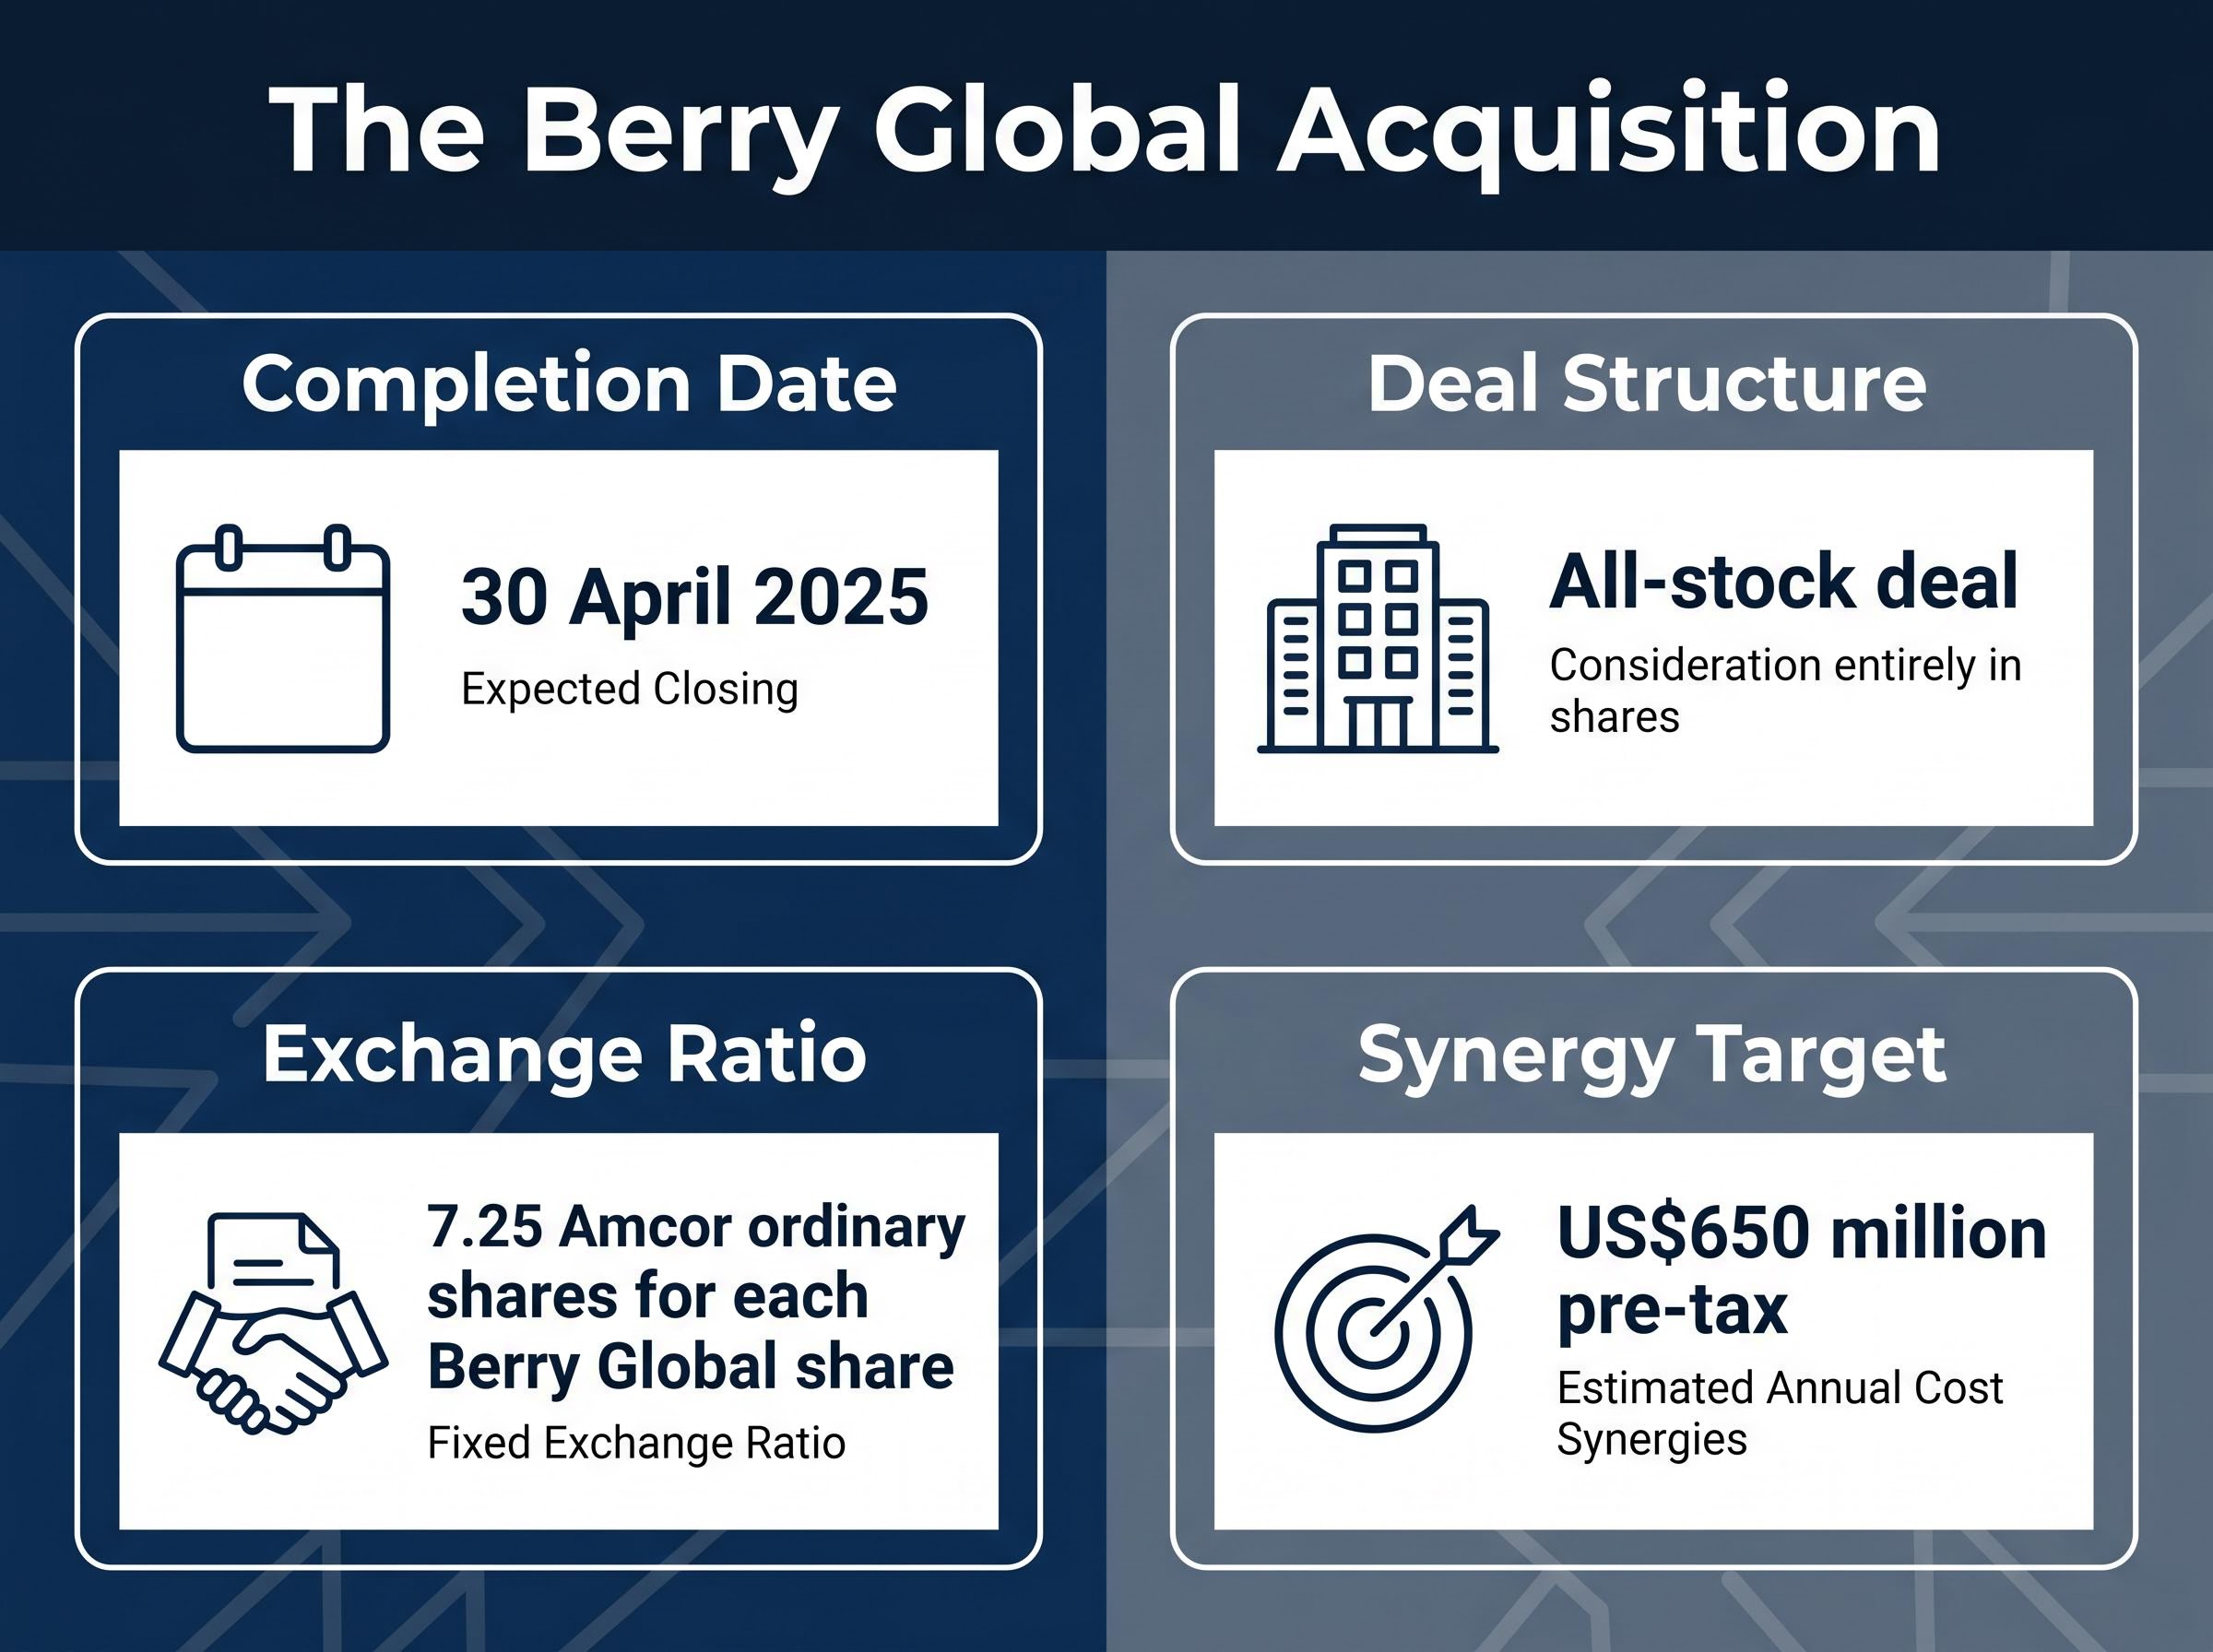
Completed on 30 April 2025, the transaction was structured as an all-stock deal at a fixed exchange ratio of 7.25 Amcor ordinary shares for each Berry Global share. It was the largest strategic transaction in Amcor’s history, fundamentally altering the company’s size, earnings base, and balance sheet.
The market’s response was cautious. Reuters reported on 1 May 2025 that shares fell on integration and leverage concerns. Three specific investor worries drove the equity repricing:
Amcor has maintained a US$650 million pre-tax synergy target from the Berry integration, but the market is pricing execution uncertainty rather than the potential upside.
The company reaffirmed its FY2026 outlook following Q1 FY2026 results, released on 5 November 2025, describing the quarterly performance as solid. The synergy target remains in place. But the market is waiting for delivered synergies rather than guidance on them. That gap between management confidence and investor scepticism is what holds the share price near its lows, and it is what makes the yield divergence analytically interesting rather than straightforwardly actionable.
Amcor’s synergy delivery progress has become the single most-watched variable among analysts tracking the stock, with adjusted EBIT margins expanding 280 basis points to 10.4% in Q3 FY2026 and the synergy target upgraded to $270 million, a figure that has moved the conversation from ‘will the merger work’ to ‘how quickly will execution translate into re-rating.’
On a forward basis, Amcor’s annualised dividend of approximately US$0.52 per share (four quarters at US$0.13) translates to a yield of approximately 7.1% at the current ASX CDI price of roughly A$51.44. That is high relative to both Amcor’s own history and the broader ASX industrials universe.
Two competing interpretations sit behind that number.
| Metric | Historical Average | Current Position |
|---|---|---|
| Trailing dividend yield | 4.38% (five-year average) | 1.43% (trailing) |
| Quarterly dividend per share | US$0.1275 (prior rate) | US$0.1300 (current rate) |
| ASX CDI price context | Historical range supported ~4% yield | ~A$51.44, approximately 2.6% above 52-week low |
No dividend cut or suspension has been announced through the Berry integration period. That is the constructive data point. The unresolved question is whether the earnings base can sustain the payout through what may be a multi-year integration cycle.
Income alternatives at the 4.35% cash rate have materially shifted the hurdle rate that any ASX dividend stock must clear to justify the equity risk premium, meaning a 7.1% unfranked forward yield on Amcor competes against term deposit rates that have not been this high in years.
The yield divergence is a prompt for deeper investigation, not a buy signal and not a warning to avoid. Treating it as either, without further work, misreads what the number is communicating.
Three specific variables determine whether the current yield is sustainable. Income investors should monitor each:
ASX continuous disclosure obligations require listed companies to immediately notify the exchange of any information a reasonable person would expect to materially affect the security’s price, which means integration milestones, leverage updates, and dividend policy changes from Amcor must be disclosed as they occur, giving income investors a timely and reliable signal to monitor.
The FY2026 outlook was reaffirmed as of the Q1 FY2026 results on 5 November 2025. The most recent quarterly dividend payment date was 17 June 2026, confirming continuity through the integration period.
For income investors who want to move from evaluating a single yield signal to building a framework for assessing payout sustainability across their full portfolio, our dedicated guide to ASX dividend portfolio construction covers payout ratio thresholds, franking credit mechanics, and the specific warning signs that precede dividend cuts in mature ASX industrials.
DDM analysis prices a stock based on the present value of expected future dividends, making it well suited to mature income stocks like Amcor. DCF analysis adds a full free cash flow dimension, useful for assessing whether the post-Berry earnings base can sustain the current payout. Investors seeking detailed financial guidance figures for either framework can access quarterly presentations and filings on Amcor’s investor relations results page at amcor.com/investors/financial-information/results.
Amcor’s yield compression is not a dividend story. It is a share-price story, and the cause, the Berry Global re-rating, is both the source of the analytical opportunity and the source of the genuine risk. The dividend has been maintained and modestly increased even as the equity price fell. That is the constructive signal income investors should hold alongside the integration uncertainty.
The yield comparison gets investors to the right question. The answer requires engagement with the Berry integration timeline, the leverage position, and a more comprehensive valuation framework than any single metric can provide. For ASX income investors screening for opportunity in a 7.1% forward yield, the work begins here. It does not end here.
This article is for informational purposes only and should not be considered financial advice. Investors should conduct their own research and consult with financial professionals before making investment decisions. Past performance does not guarantee future results. Financial projections are subject to market conditions and various risk factors.
Dividend yield theory holds that for stable, mature income stocks, the yield tends to revert toward its long-run historical mean over time, making the gap between a stock's current yield and its historical average a practical signal of relative over- or under-valuation. For ASX stocks like Amcor, comparing the current yield against its five-year historical average helps investors assess whether the equity is priced above or below its long-run income value.
Amcor's trailing yield of 1.43% sits well below its five-year historical average of 4.38% because the share price has fallen materially following the Berry Global acquisition completed on 30 April 2025, while the quarterly dividend has actually increased modestly from US$0.1275 to US$0.1300 per share. The yield compression is entirely a share-price story, not the result of a dividend cut.
At the ASX CDI closing price of approximately A$51.44, Amcor's annualised dividend of approximately US$0.52 per share translates to a forward yield of approximately 7.1%. This figure sits well above both Amcor's own historical average and the broader ASX industrials universe.
Investors should track three key variables: progress against Amcor's US$650 million pre-tax Berry integration synergy target (reported in quarterly results), the trajectory of the combined entity's leverage and balance sheet, and any forward dividend policy communications from Amcor's investor relations disclosures. These signals will indicate whether the current distribution level can be maintained through the integration period.
Completed on 30 April 2025 as an all-stock deal at a fixed exchange ratio of 7.25 Amcor shares per Berry Global share, the acquisition introduced integration execution risk, increased leverage, and a more cyclical earnings profile, prompting the market to reprice Amcor's equity lower. Amcor has maintained a US$650 million pre-tax synergy target, but investors are waiting for delivered results rather than guidance before re-rating the stock.


