Commonwealth Bank of Australia earned $13.10 in profit for every $100 of shareholder equity in its most recent financial year. The ASX banking sector average sat at $9.35. That single figure, return on equity, explains more about why CBA commands a premium valuation than almost any other statistic. Bank stocks are among the most widely held in Australian share portfolios, yet the metrics analysts use to evaluate them, net interest margin (NIM), return on equity (ROE), and Common Equity Tier 1 capital ratio (CET1), remain poorly understood by most retail investors. Reading a bank’s financial health requires a different toolkit than reading a retailer or a miner. This article explains each of the three metrics, defines what a good number looks like for an Australian major bank, and uses CBA’s latest reported FY25 figures alongside peer data from ANZ, NAB, and Westpac to show how to apply these tools when assessing any ASX-listed bank.
Why banks need their own valuation playbook
Standard valuation ratios fall apart when applied to banks. Enterprise value to EBITDA, for instance, is built for companies whose assets are factories, inventory, and equipment. A bank’s assets are overwhelmingly financial instruments: loans, mortgages, and securities. Revenue does not flow from selling a product at a gross margin; it flows from borrowing cheaply (deposits) and lending at higher rates, with profitability measured by the spread between the two.
Standard valuation tools break down in banking for a reason: PE ratios mislead bank investors because a single provision movement can swing reported earnings dramatically without reflecting any change in the underlying business, which is precisely why NIM, ROE, and CET1 have become the professional standard for cross-bank comparisons.
This structural difference is why price-to-book (P/B) ratio serves as the core valuation anchor for bank stocks, alongside price-to-earnings. Book value is more meaningful for a bank because loan assets sit closer to market value than a warehouse or production line ever would. A bank earning ROE consistently above its cost of equity deserves to trade above 1x book; one earning below deserves to trade below. As of early 2025, Morningstar noted CBA was trading at approximately 1.9x its FY25 book value estimate, a premium built on the foundation of the three metrics this article covers.
The three metrics that matter most when valuing an ASX-listed bank:
- Net interest margin (NIM): the profitability of the bank’s core lending activity
- Return on equity (ROE): how efficiently the bank converts shareholders’ capital into profit
- CET1 capital ratio: the safety buffer protecting shareholders from loss absorption and dilution
When big ASX news breaks, our subscribers know first
Net interest margin: the engine of bank profitability
NIM measures the difference between what a bank earns on its loans and what it pays on deposits and wholesale funding, expressed as a percentage of interest-earning assets. For CBA, net interest income accounts for approximately 85% of total revenue, making NIM the single most important driver of earnings.
NIM is not static. It expands when lending rates rise faster than funding costs, as occurred during the 2022-2024 rate cycle, and compresses when deposit competition intensifies or wholesale funding costs climb. Experienced analysts watch the trajectory as closely as the absolute figure. A NIM spike driven purely by a rate cycle may not prove sustainable once conditions normalise.
CBA’s FY25 NIM came in at 2.08%, up from 1.96% in FY24. That expansion occurred while the RBA cash rate was cut in 2025 before being hiked back to 4.35% by May 2026, meaning the near-term NIM compression forecasts circulating in early 2025 have not materialised. CBA’s advantage of approximately 15-20 basis points over peers is attributed to its low-cost deposit franchise.
Deposit funding composition is one of the most underrated single-figure NIM indicators across the sector: CBA’s approximately 70% deposit share versus Macquarie’s 40-45% directly explains the difference in earnings cyclicality and NIM resilience that the headline margin figures reflect but do not fully account for.
“A sustainable through-the-cycle NIM of around 1.70-1.90 per cent is considered healthy; anything over 2 per cent is exceptional.” (Livewire Markets)
| Bank | FY25 NIM | vs sector average (1.78%) |
|---|---|---|
| CBA | 2.08% | +30 bps |
| Westpac | 1.95% | +17 bps |
| NAB | 1.74% | -4 bps |
| ANZ | 1.57% (FY24) | -21 bps |
Return on equity: what the profit-per-dollar-of-capital figure reveals
For every $100 of shareholders’ equity on the balance sheet, how many dollars of profit did the bank generate? That is what ROE measures. It is the most direct link between a bank’s profitability and the valuation multiple the market assigns to its shares.
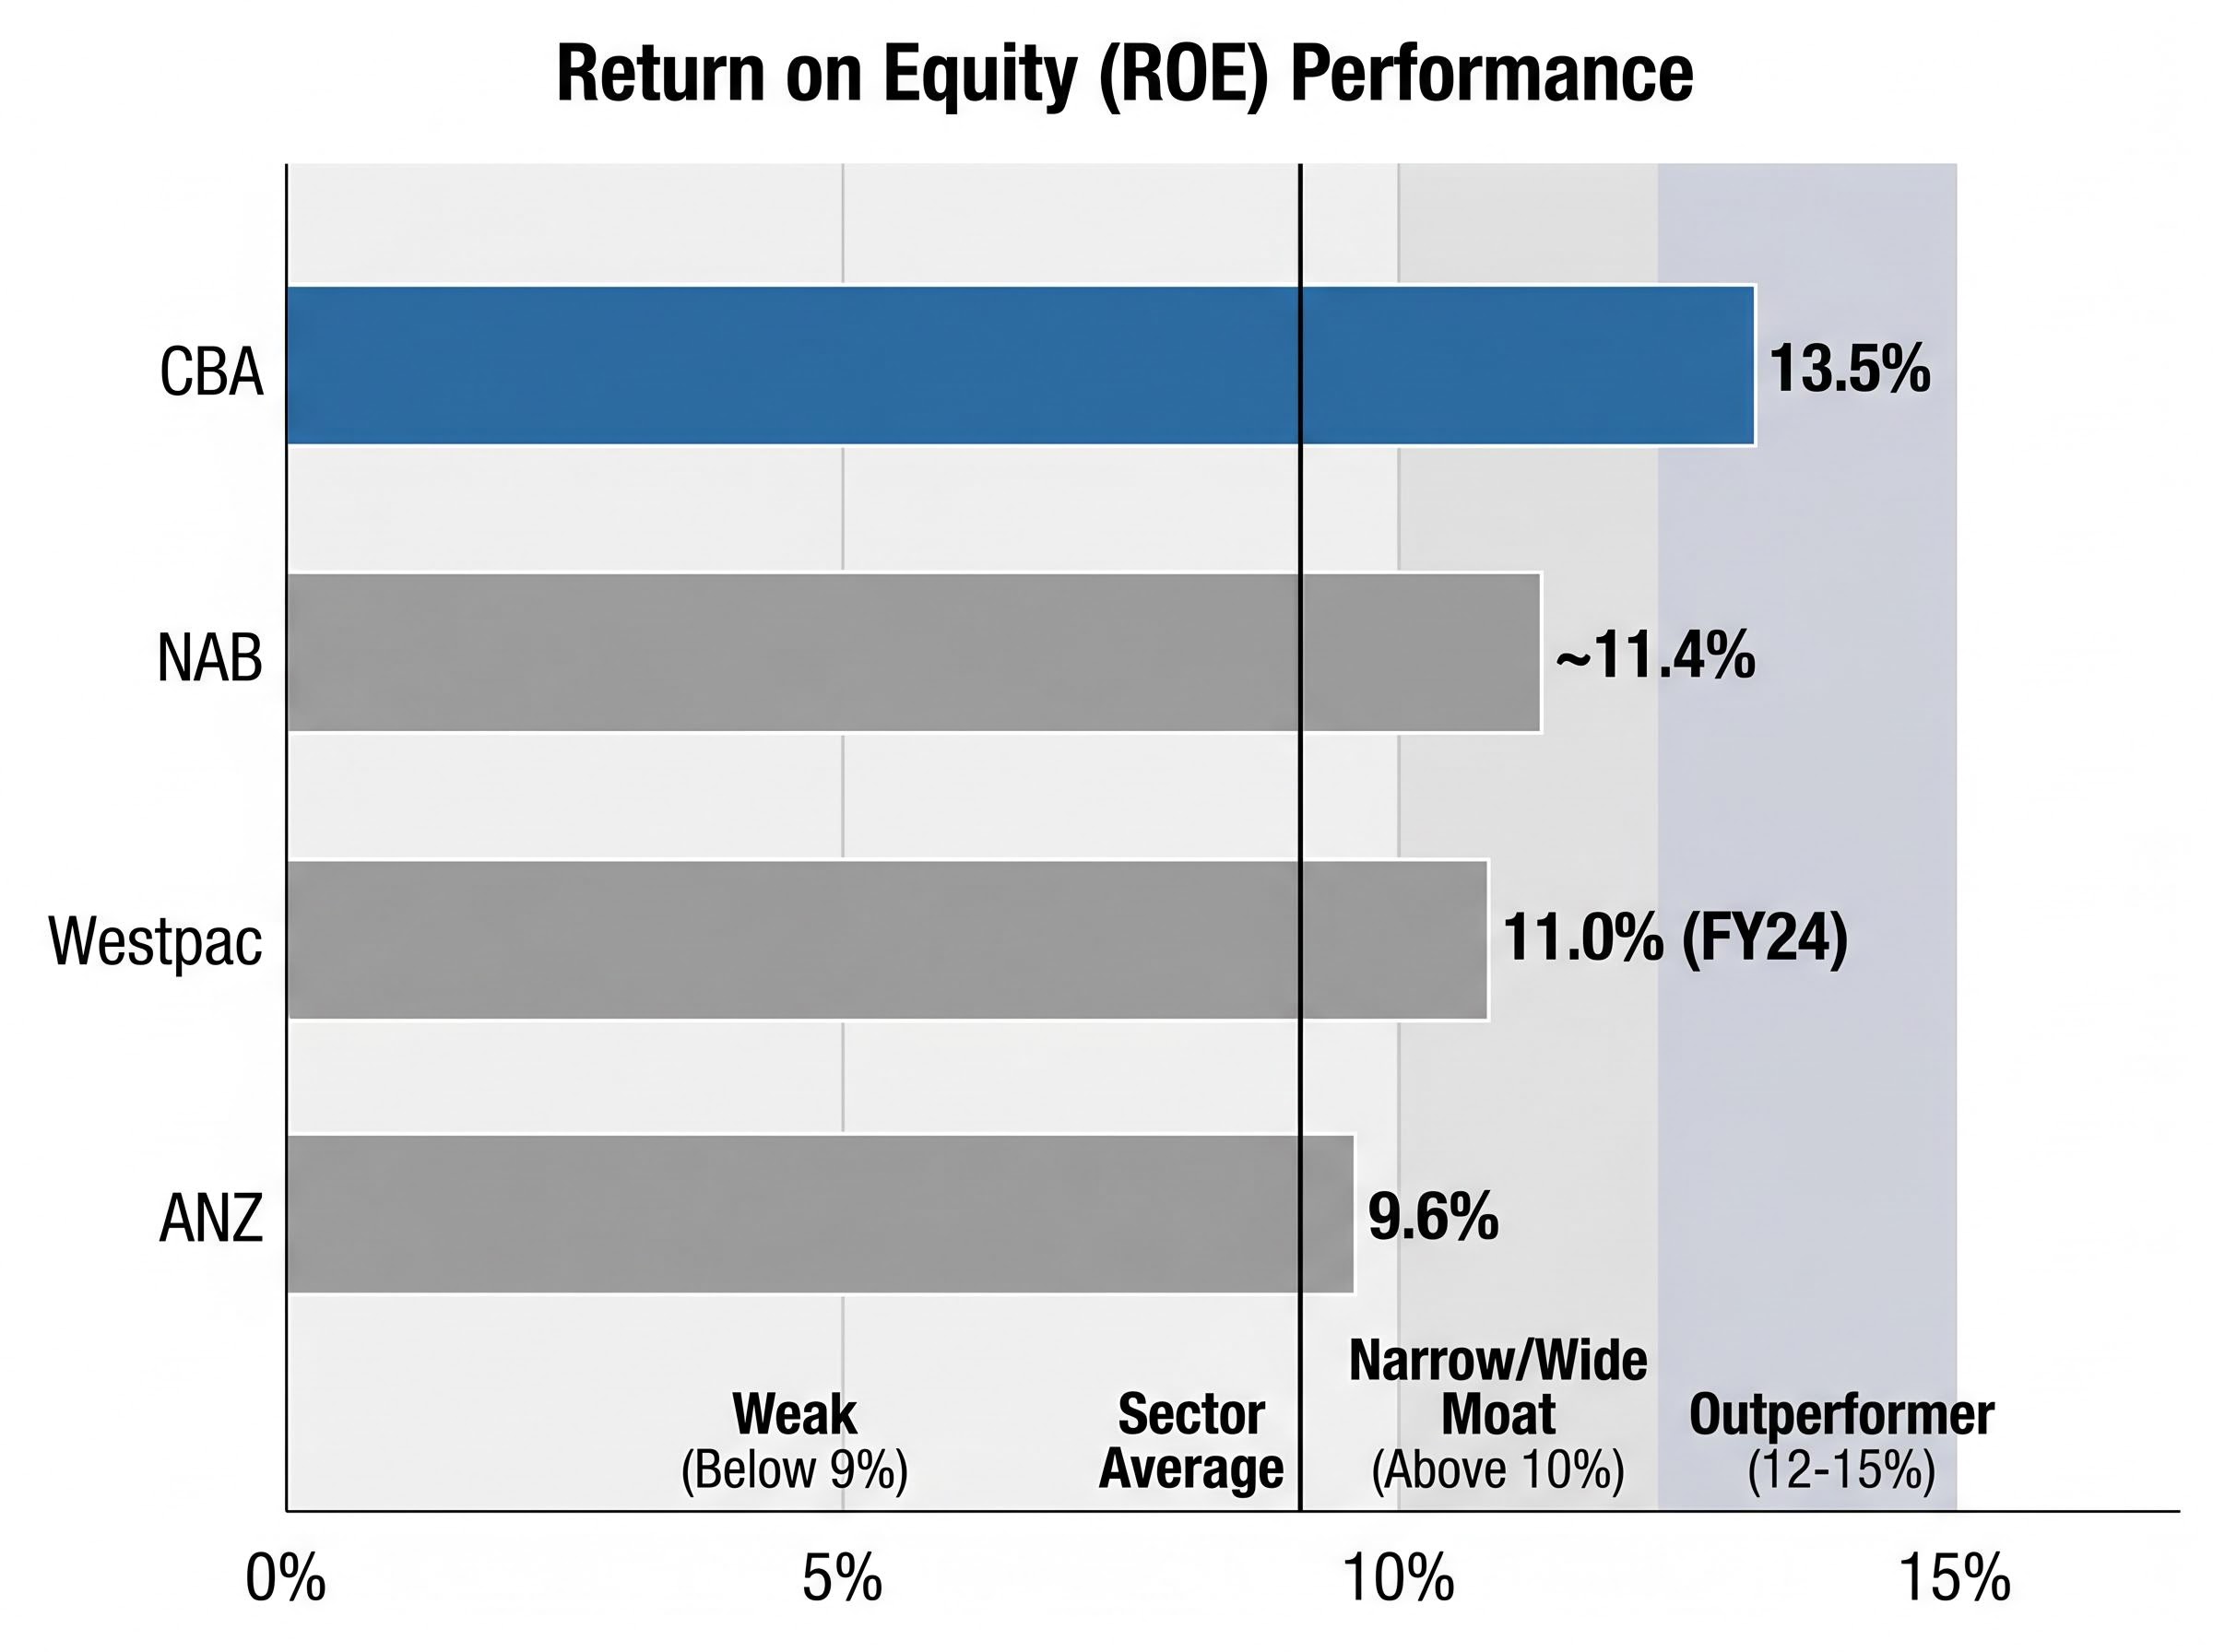
CBA’s FY25 cash ROE came in at 13.5%, down from 14.8% in FY24 but still sector-leading by a wide margin. The Rask-calculated ASX banking sector average ROE sits at 9.35%. For context, Morningstar associates ROE above 10% with narrow or wide moat franchises among major Australian banks, and considers 12-15% outperformer territory. Persistent readings below 9% are generally viewed as weak.
The ROE figure also explains valuation premiums directly. A bank that consistently earns ROE above its cost of equity deserves a price-to-book multiple above 1x. CBA’s structurally higher ROE is the primary reason it commands the highest P/B ratio among the four majors.
Cash ROE vs statutory ROE: which figure to use
Banks report ROE on both a cash earnings basis and a statutory earnings basis. The difference typically reflects items such as amortisation of acquired intangibles, one-off restructuring charges, and treasury share adjustments. Cash ROE is the figure management emphasises and analysts use for cross-bank comparisons, as it better reflects underlying operational performance.
As an example, CBA’s FY24 statutory ROE was 14.3% compared to a cash ROE of 14.8%. NAB reported statutory ROE of 10.9% against cash ROE of 11.6% in the same period. When the two figures diverge materially, it is worth investigating what is driving the gap.
| Bank | FY25 cash ROE | Sector average (9.35%) |
|---|---|---|
| CBA | 13.5% | Above |
| NAB | ~11.4% | Above |
| Westpac | 11.0% (FY24) | Above |
| ANZ | 9.6% | Near threshold |
ANZ’s FY25 cash ROE of 9.6% sits near the threshold analysts consider adequate, a figure worth monitoring given the bank’s declining return profile from 11.2% in FY24.
CET1 capital ratio: the safety buffer every investor should check
How much punishment can a bank absorb before shareholders face dilution? That is the question CET1 answers, and it is the metric investors rarely examine until a crisis forces the question.
CET1 measures the proportion of a bank’s risk-weighted assets funded by its highest-quality capital: ordinary shares plus retained earnings. It functions as the first line of defence against losses before depositors or creditors are affected. The Australian Prudential Regulation Authority (APRA) requires major banks to hold CET1 meaningfully above minimum requirements under its “unquestionably strong” framework, creating a tiered system from minimum through comfortable to surplus.
APRA’s unquestionably strong framework sets the capital floors that determine where each tier of the CET1 benchmark ranges sits, with the January 2023 effective date cementing the requirements that underpin the 11-12.5% comfortable range observed across the four majors today.
There is a trade-off. A higher CET1 ratio reduces the risk of dilutive capital raisings in a downturn, but if CET1 climbs too high, it can weigh on ROE because shareholders’ funds are being held unproductively.
All figures quoted here are APRA Level 2 CET1 ratios. Banks also disclose “internationally comparable” CET1 ratios that are substantially higher (CBA’s APRA figure of 12.3% equates to an internationally comparable equivalent of approximately 18%). These figures are not directly comparable across jurisdictions.
According to Morningstar, “Ratios materially above 12 per cent may imply surplus capital that could be returned, assuming no major acquisitions or stress.”
ANZ’s movement from 13.4% in FY24 to 12.0% in FY25 provides a worked example of surplus capital normalising, shifting from well above the comfortable range to the middle of it.
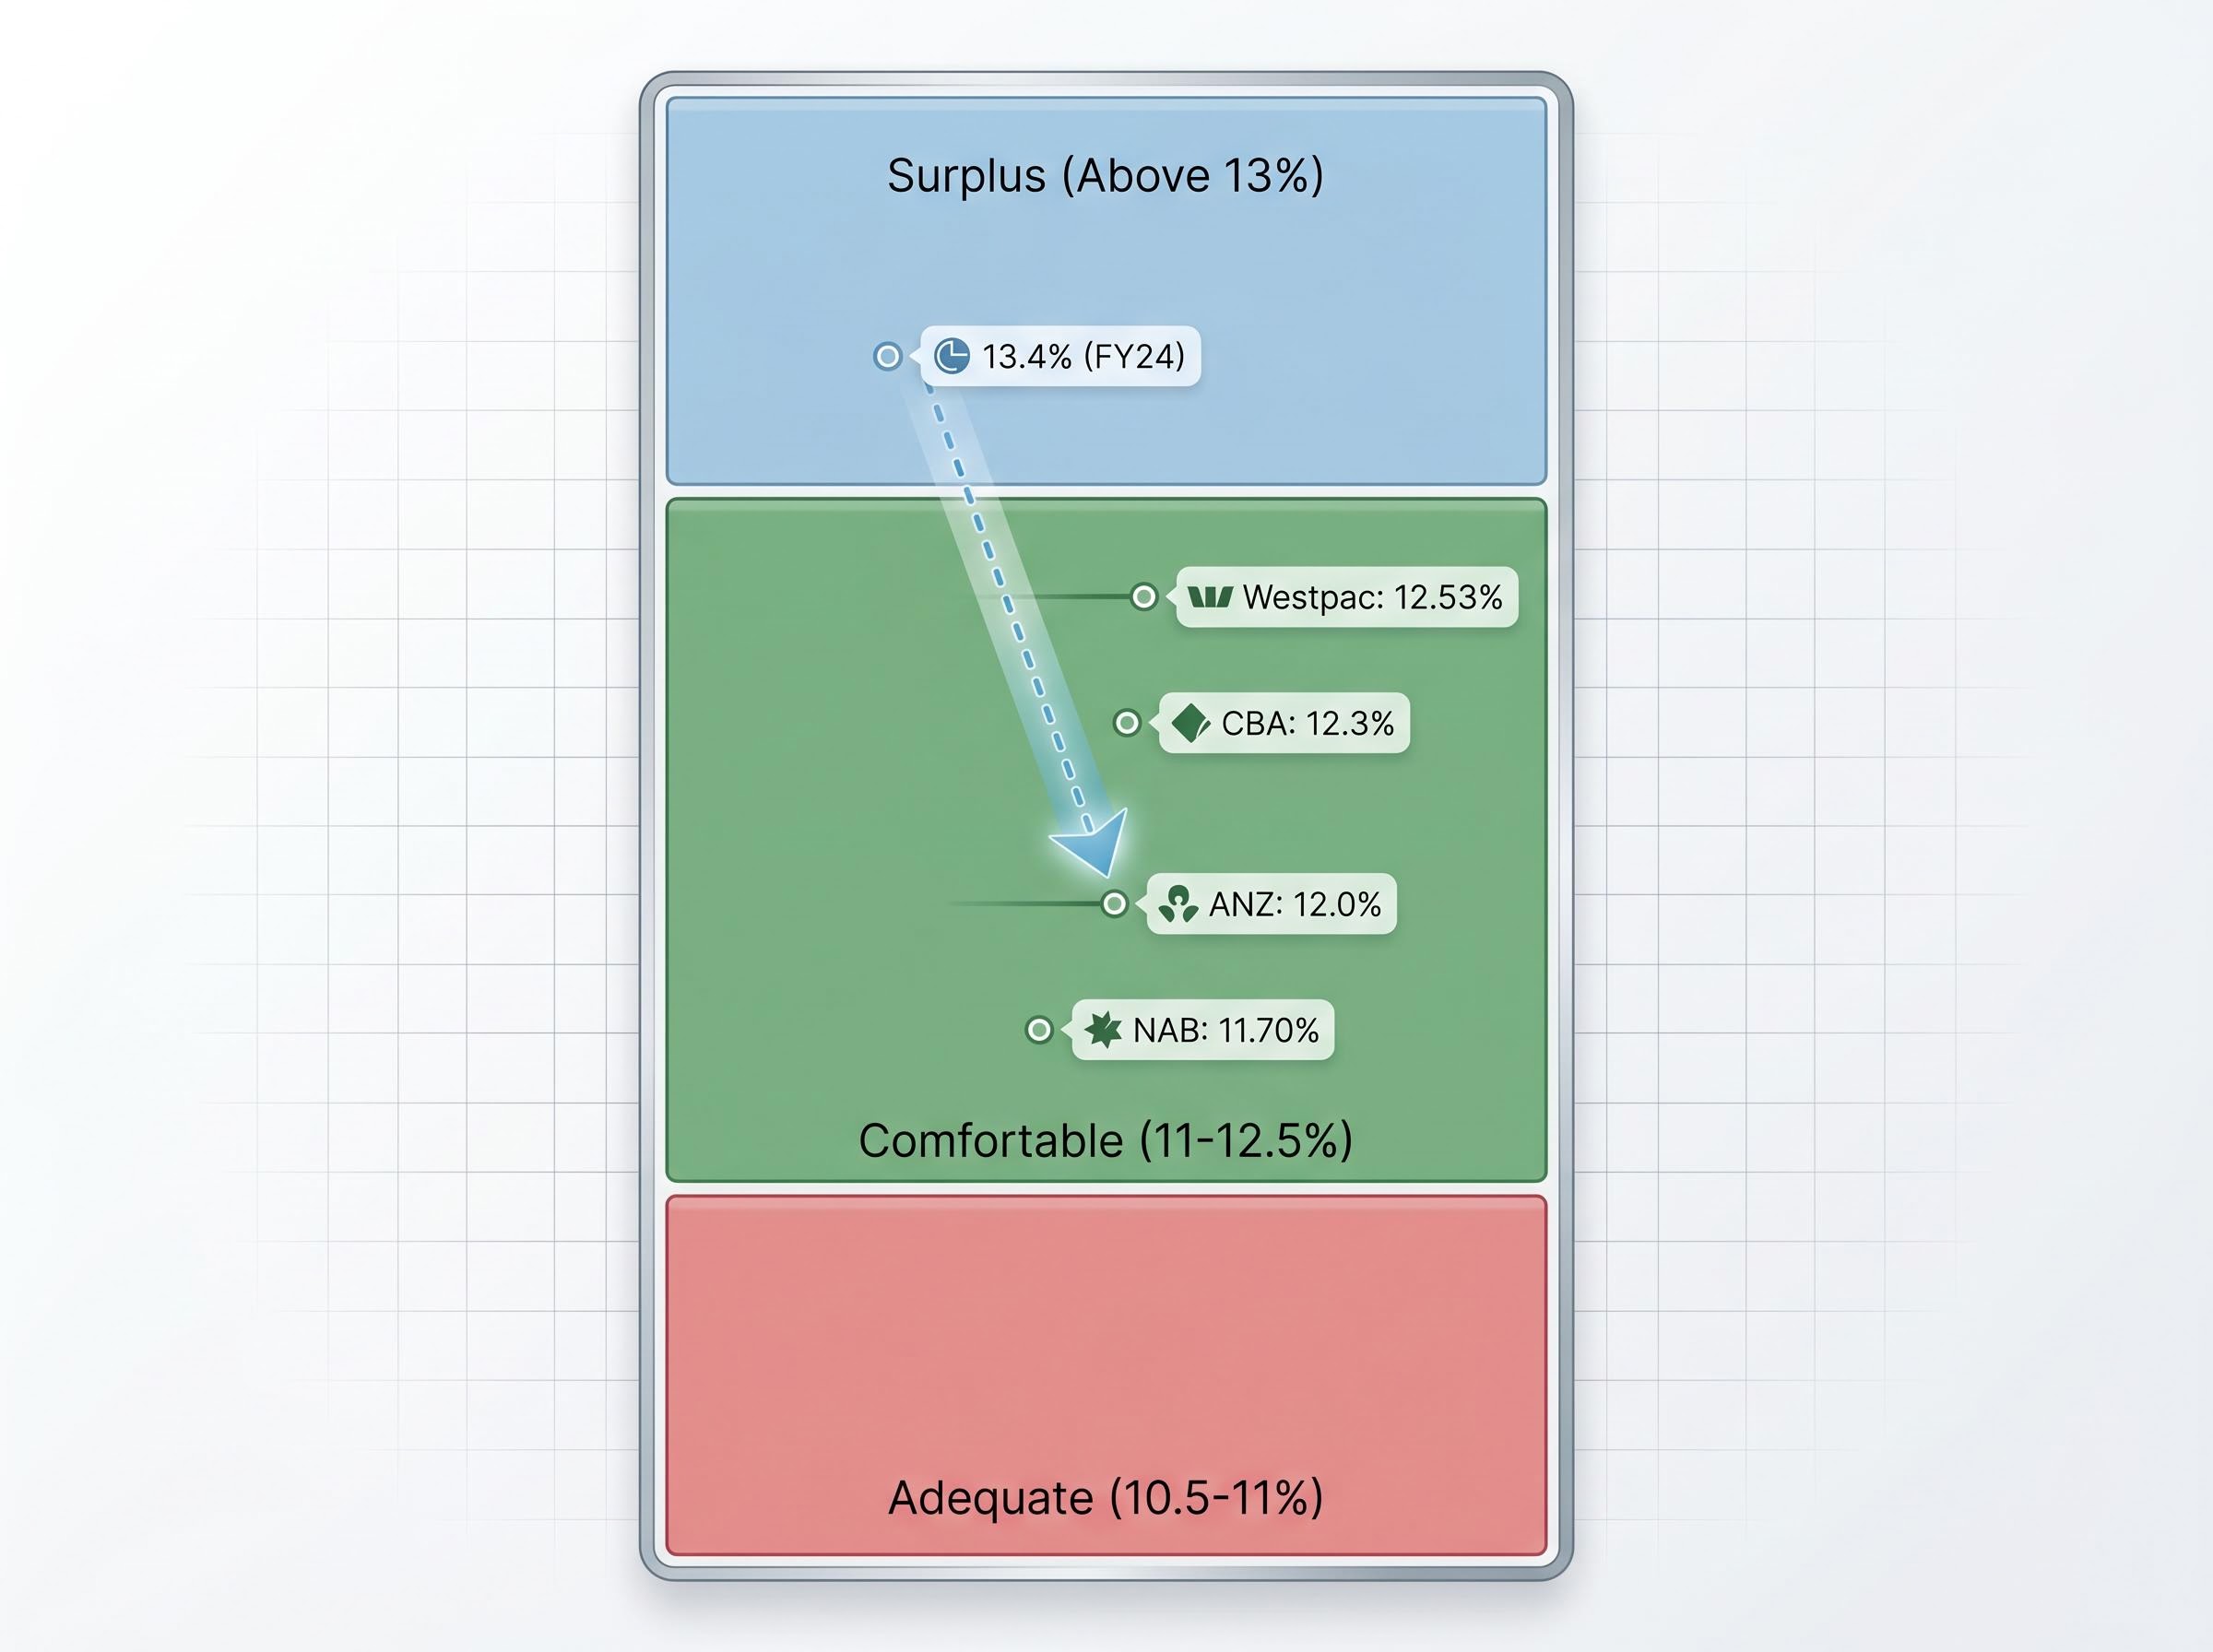
| Bank | FY25 CET1 | Benchmark assessment |
|---|---|---|
| Westpac | 12.53% | Comfortable |
| CBA | 12.3% | Comfortable |
| ANZ | 12.0% | Comfortable |
| NAB | 11.70% | Comfortable (lower end) |
Benchmark ranges for context: 10.5-11% is considered adequate; 11-12.5% comfortable and typical for 2024-25; above 13% is often viewed as surplus capital.
The next major ASX story will hit our subscribers first
Putting the three metrics together: reading CBA against the sector
Individually, NIM, ROE, and CET1 each tell part of the story. Together, they form a system that explains why one bank trades at a premium and another does not.
CBA’s FY25 combination of sector-leading NIM (2.08%), sector-leading cash ROE (13.5%), and comfortable CET1 (12.3%) collectively builds the case for a premium P/B multiple over peers. No other major bank matches CBA on more than one of the three metrics.
| Bank | NIM | Cash ROE | CET1 |
|---|---|---|---|
| CBA | 2.08% | 13.5% | 12.3% |
| Westpac | 1.95% | 11.0% (FY24) | 12.53% |
| NAB | 1.74% | ~11.4% | 11.70% |
| ANZ | 1.57% (FY24) | 9.6% | 12.0% |
Sector commentary from Livewire Markets captures the investor trade-off concisely: if an investor wants quality and a stable earnings profile, CBA is the default choice; if an investor wants value, the search starts elsewhere in the sector.
The market reaction to bank results often diverges from headline profit figures, as NAB’s nearly 3% share price decline on a day when underlying profit grew 6.4% illustrates: investors price the NIM trajectory, ROE trend, and CET1 buffer, not the headline number, meaning a bank can post record profits and still sell off if the margin story disappoints.
Strong fundamentals and an elevated valuation can coexist, however, and the price paid still matters. CBA’s share price of approximately $159.40 (as at 17 May 2026, per Rask data) compares to Rask’s dividend discount model (DDM) central estimates of approximately $98-$101 on a trailing and forecast dividend basis. Adjusted for the full value of franking credits, the estimate rises to approximately $143.80. DDM outputs are highly sensitive to the discount rate and growth assumptions chosen, and the franking-adjusted figure is the most appropriate anchor for Australian investors given the full imputation credit benefit.
The three-metric framework is transferable to any ASX-listed bank:
- What is the NIM trend and how does it compare to peers?
- Is ROE structurally above 10%, and what drives it?
- Is CET1 in the comfortable range, and what is management doing with any surplus?
CBA as a benchmark, not a buy signal
Strong metrics at the company level always need to be weighed against the price being paid. CBA’s own numbers demonstrate this: high-quality fundamentals and an elevated valuation coexist, and it is the investor’s job to decide whether the premium is justified at the current share price.
The NIM, ROE, and CET1 framework works best as a starting screen across the major banks before moving to valuation, rather than relying on any single metric in isolation. Readers looking to apply this approach can begin with each major bank’s latest full-year result: CBA reports on a June year-end, while ANZ, NAB, and Westpac report on September year-ends.
Investors wanting to move from the three-metric diagnostic framework to a full valuation model will find our comprehensive walkthrough of bank DDM valuation useful, covering a step-by-step Dividend Discount Model applied to verified FY2025 figures, with worked calculations for required return, growth assumptions, and franking credit adjustments that are directly portable to CBA or any other ASX bank.
This article is for informational purposes only and should not be considered financial advice. Investors should conduct their own research and consult with financial professionals before making investment decisions. Past performance does not guarantee future results. Financial projections, including DDM estimates, are subject to market conditions and various risk factors.