A PE ratio can tell an investor what the market is paying for an Australian bank. It cannot tell them what happens to that bank’s loan book if unemployment climbs toward 5% while Sydney house prices are falling. That is the gap this guide fills.
With NAB trading around $36 in May 2026 and dividend yields drawing retail investors toward the major banks, the temptation to act on a single valuation number is real. But a PE ratio or dividend discount model (DDM) figure is only as reliable as the business assumptions sitting beneath it. In a banking system where residential mortgages make up nearly two-thirds of total lending, where household debt-to-income sits near 186%, and where unemployment is already tracking upward, those assumptions deserve serious scrutiny before capital is committed.
This guide walks Australian retail investors through the five qualitative and macroeconomic factors that determine whether a major bank is worth owning at the price a model suggests, drawing on current data, regulatory commentary, and the lessons of past stress cycles.
Beyond the number: what a bank valuation model cannot tell you
Valuation models are useful starting points. A PE ratio of 16.1x for NAB, against a sector average of roughly 18x, gives an investor a relative reference. A DDM output gives them an absolute one. Both methods, covered in a companion valuation article, produce a number. The risk is treating that number as a verdict.
The problem is not the arithmetic. It is the assumptions the arithmetic encodes. A DDM calculation, for instance, requires inputs for earnings stability, dividend growth, and discount rate. Change those inputs modestly and the output shifts dramatically.
A DDM applied to NAB can produce a fair value estimate ranging from $19.00 to $85.50, depending on the growth and discount rate assumptions used. The number a model produces is only as trustworthy as the inputs feeding it.
The macro assumptions behind bank valuations are not interchangeable: NAB and ANZ carry approximately 85% variable-rate mortgage exposure, meaning the same DDM model produces a dramatically different output depending on whether the analyst assumes rates plateau at 4.35% or climb further, a sensitivity that helps explain why Morgans holds a Sell on NAB at $37.27 while Jefferies holds a Buy at $50.64.
For a bank specifically, those inputs are not abstract. A bank’s business model is a leveraged bet on borrowers’ ability to repay. That makes its earnings unusually sensitive to macroeconomic conditions, property values, and household financial health. Investors who skip the step of interrogating those conditions are effectively underwriting business assumptions they have not checked.
When big ASX news breaks, our subscribers know first
The business behind the balance sheet: how Australian banks actually make money
Banks generate earnings primarily through net interest margin (NIM), the spread between the rate they pay on deposits and the rate they charge on loans. Fee and service income, along with trading and markets revenue, provides a secondary income stream. The balance between these sources matters for investment assessment because it determines how exposed a bank’s earnings are to interest rate movements and credit conditions.
What makes the Australian major banks distinctive is concentration. In a November 2025 speech, APRA Chair John Lonsdale stated that residential mortgages make up nearly two-thirds of total lending across the majors. That single statistic means property market health and borrower repayment capacity are not background factors for Australian bank investors; they are the primary earnings drivers.
How the income mix is shifting
All four majors are working to diversify away from pure mortgage-driven revenue, though the pace and strategy differ.
| Bank | Primary growth strategy | Main income diversification lever |
|---|---|---|
| NAB | SME and business banking | Payments and markets income; modest mortgage volume growth |
| CBA | Digital platforms and technology | CommBank app, BNPL, merchant acquiring, insurance |
| ANZ | Queensland expansion via Suncorp; institutional growth | Transaction banking and cross-border payments |
| Westpac | Simplified domestic focus (mortgages and SME) | Fee recovery still subdued; core banking consolidation |
None of the four majors is pursuing aggressive mortgage volume growth as a primary earnings lever in 2025-2026. The pattern is cautious balance-sheet growth, incremental fee diversification, and active capital management through buybacks rather than loan expansion. For investors assessing earnings trajectory, this discipline is a positive signal, but it also means income growth is likely to remain modest.
The two macroeconomic gauges every bank investor should watch
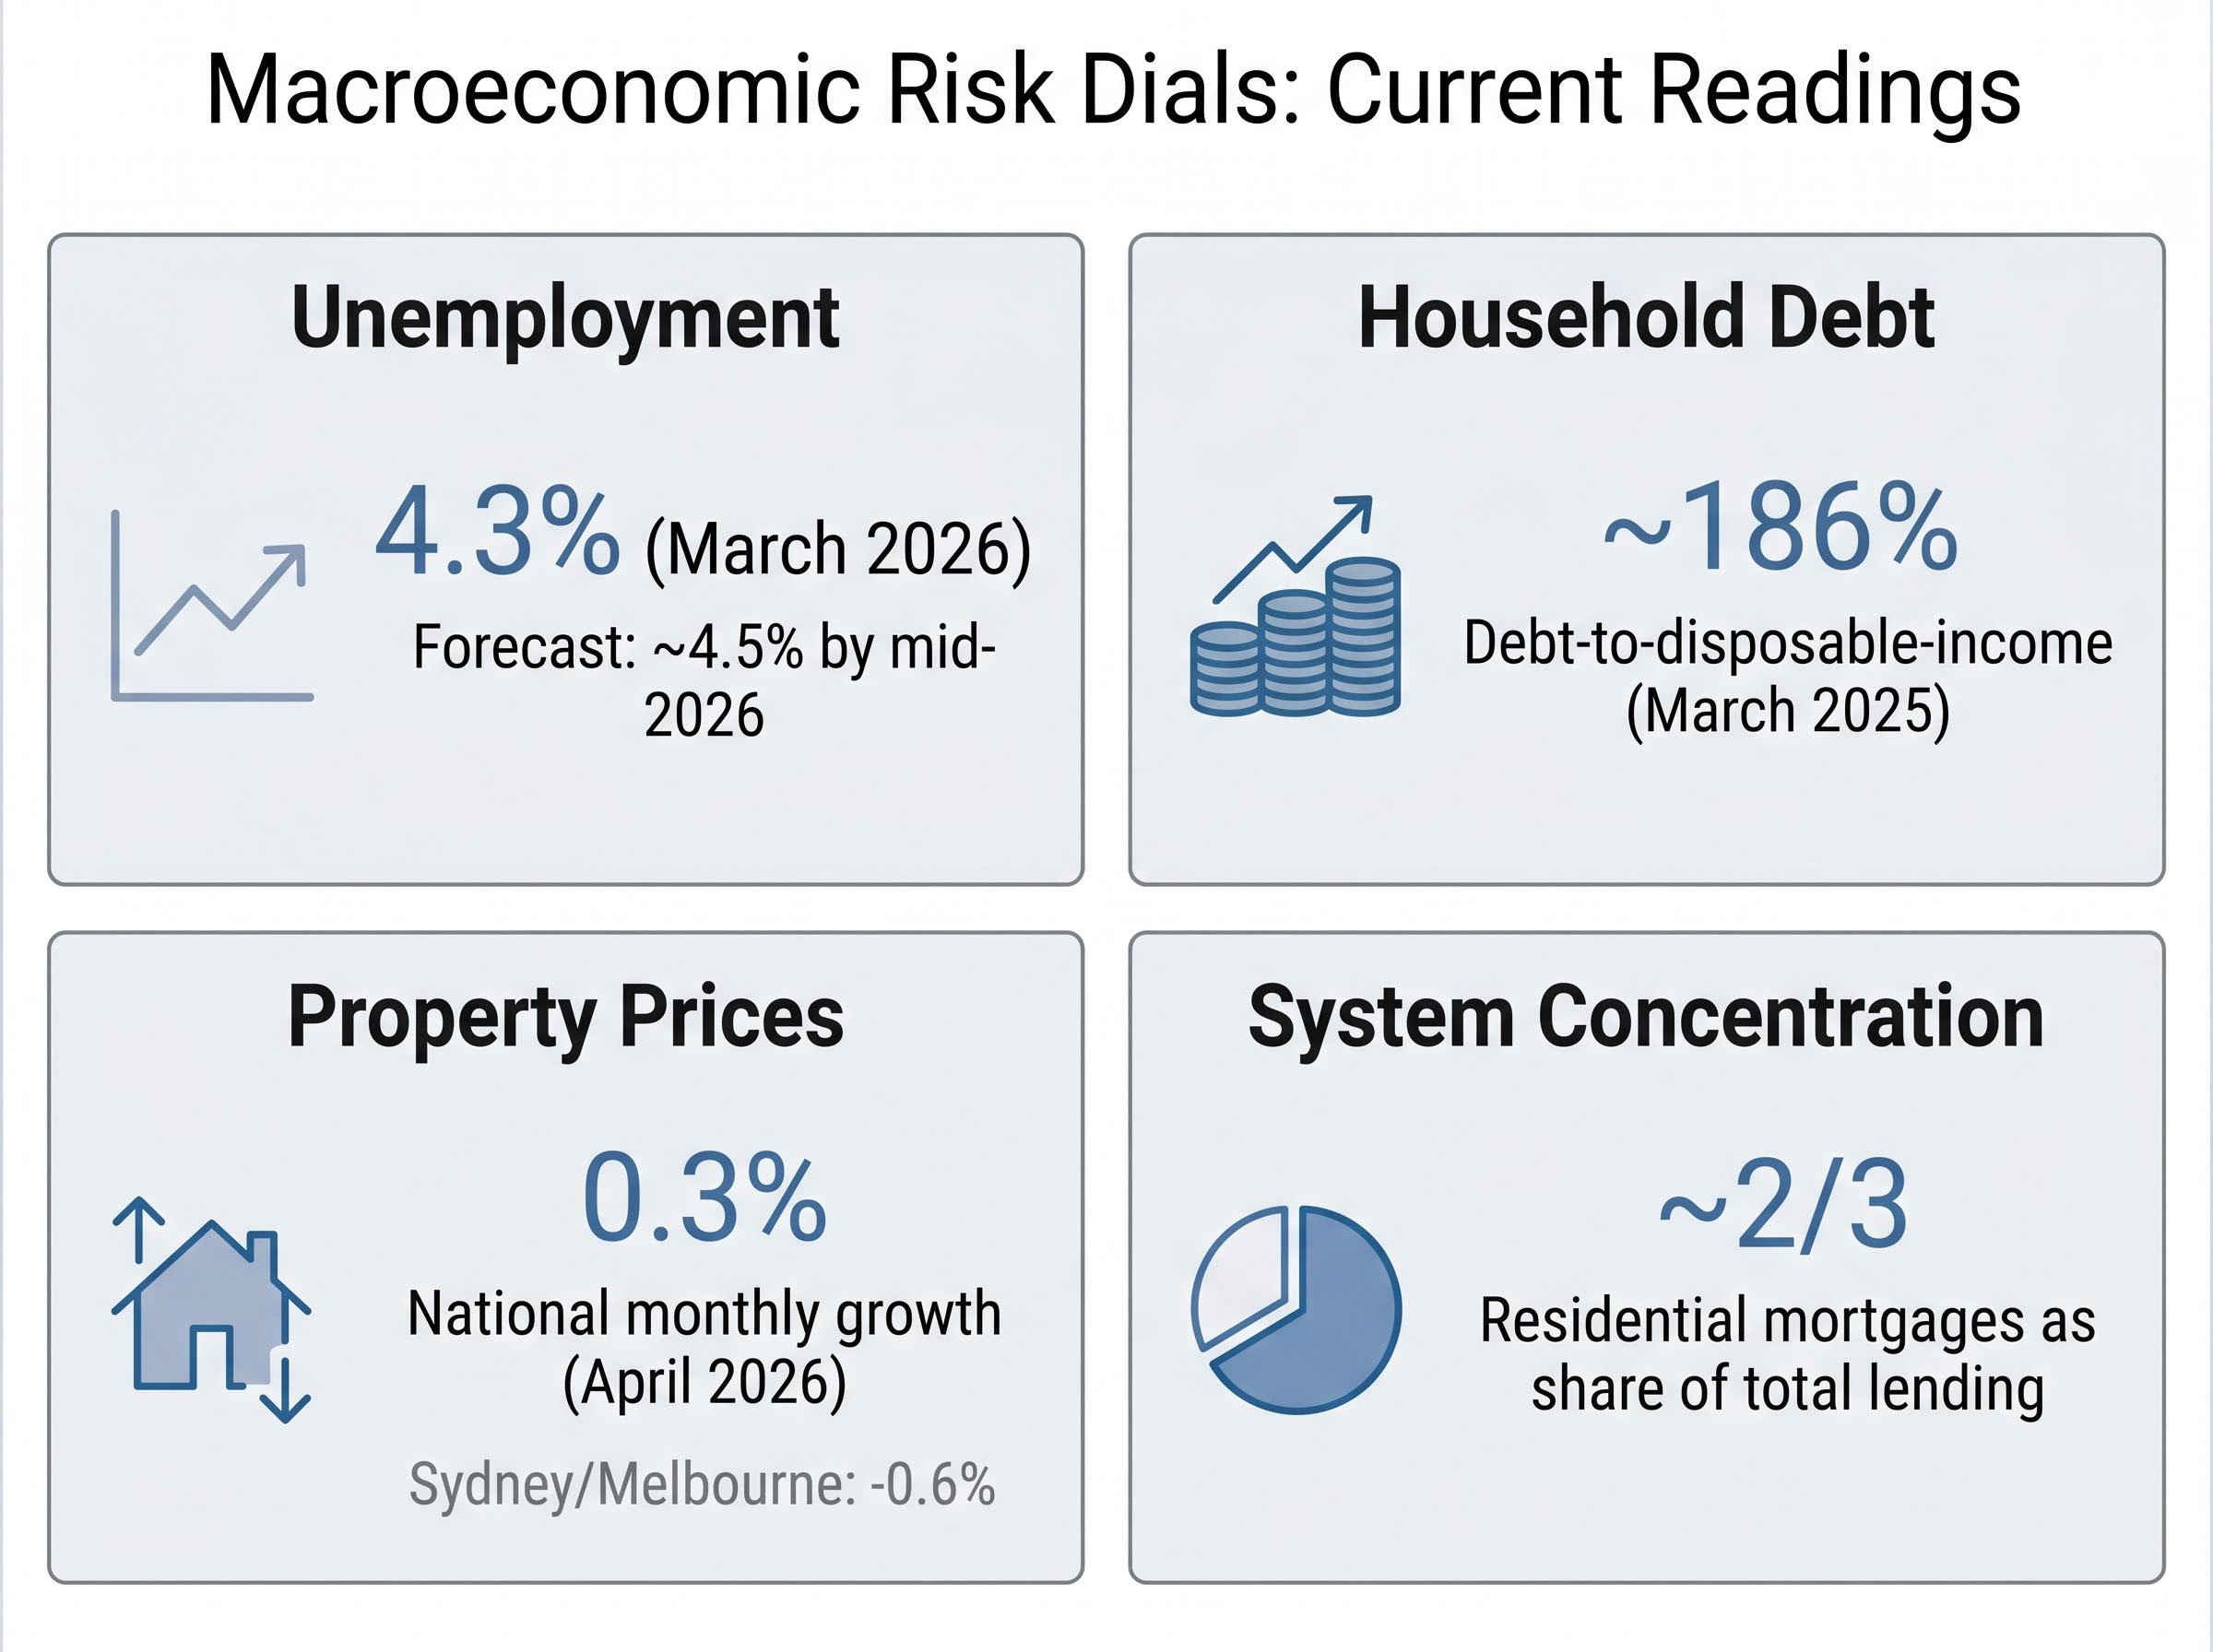
Two data points sit at the centre of any informed assessment of Australian bank risk: property prices and unemployment. In a mortgage-heavy banking system with near-record household leverage, these are the live dials that directly control credit quality.
The current readings:
- Property prices: The Cotality Home Value Index recorded 0.3% national monthly growth in April 2026, slowing from 0.6% in March. Sydney and Melbourne both posted monthly declines of -0.6%. The RBA noted that national housing prices rose approximately 8% over 2024, but price-to-income ratios remain elevated by historical standards.
- Household debt: The debt-to-disposable-income ratio sits at approximately 186% (RBA Chart Pack, March 2025). Housing credit alone accounts for roughly 140% of disposable income, according to APRA’s 2024 Year in Review.
- Unemployment: The ABS reported a seasonally adjusted unemployment rate of 4.3% in March 2026, tracking toward the RBA’s forecast of approximately 4.5% by mid-2026.
The RBA’s May 2025 Statement on Monetary Policy warned that “a larger-than-expected rise in unemployment would increase credit risk for highly indebted borrowers and banks.”
The direction of travel matters more than any single reading. Property price growth is decelerating and turning negative in the two largest markets. Unemployment is rising from post-COVID lows. Household savings buffers built during the pandemic period have been run down. None of these readings signals an imminent crisis, but they describe an environment where credit quality is more likely to deteriorate than improve.
The RBA rate tightening cycle running through 2026 creates a dual effect on bank earnings: variable-rate mortgage books generate modest NIM support as rates reprice upward, but the same rate path increases debt serviceability stress for the highly leveraged households that the mortgage book depends on, and eight of nine Board members voted for the May hike, signalling that policy is not yet close to a pivot.
What rising arrears would mean for earnings
Credit charges, the provisions banks set aside for expected loan losses, directly reduce profits. APRA’s quarterly statistics show housing loans 90+ days past due at approximately 0.8% as of December 2025, up from approximately 0.6% in 2023. These remain low by historical standards.
The earnings sensitivity, however, is material. According to Morgan Stanley’s April 2025 analysis, credit charges peaked at 60-80 basis points of loans during the early 1990s recession and the GFC, compared with mid-teens basis points in recent years. A reversion even halfway toward those historical stress levels would compress bank earnings meaningfully and could place pressure on dividend payments, the very returns many retail investors are buying these stocks for.
Management quality and strategic direction: the qualitative checklist
Numbers describe a bank’s current position. Management determines where it goes next. In a leveraged business, capital allocation decisions compound quickly in both directions, making executive quality and strategic discipline a hard analytical factor rather than a soft one.
Two live examples illustrate why this matters now. NAB announced in March 2025 that CEO Ross McEwan would retire, with Rachel Slade named as CEO-elect for a transition expected during FY26. At ANZ, the completion of the Suncorp Bank acquisition in March 2025 created a new Australian Retail and Commercial division under Maile Carnegie, an integration task that will test execution capability over the next 12-18 months.
Before committing capital to any major bank, investors can apply the following checklist:
- Credit discipline: Is the bank chasing mortgage volume for short-term earnings growth, or maintaining underwriting standards? Review half-year results commentary on loan growth and risk appetite.
- Management experience: Has the executive team navigated a credit cycle before? A new CEO entering a deteriorating macro environment carries different risk from a seasoned team. Check ASX announcements for recent leadership changes.
- Capital returns philosophy: Is the bank balancing buybacks and dividends against balance-sheet strength, or prioritising shareholder returns over provisioning? Review CET1 ratios in APRA quarterly statistics.
- Strategic clarity: Does the bank have a coherent plan for income diversification, or is it relying on a single growth lever? Compare stated strategy in results presentations against actual revenue mix changes.
- Communication quality: Does management acknowledge risks candidly in results commentary, or default to optimistic framing? Read the risk discussion sections of half-year and annual reports.
Across all four majors, capital discipline has been a consistent theme through 2025-2026. NAB maintained its CET1 ratio above APRA’s unquestionably strong benchmark while continuing buybacks at a slower pace. Westpac reduced its buyback pace, citing uncertainty about economic conditions and regulatory capital settings. Neither pattern guarantees future outcomes, but both suggest management teams are not chasing growth at the expense of resilience.
How past banking crises calibrate the risk in today’s environment
History does not predict what will happen next, but it calibrates the range of outcomes an investor should prepare for. Two stress episodes are particularly relevant: the Global Financial Crisis of 2008-2009 and the early 1990s Australian recession.
APRA Chair John Lonsdale noted in November 2025 that Australian banks remain heavily exposed to housing, with residential mortgages making up nearly two-thirds of total lending, emphasising the need for strong capital and provisioning given that concentration.
What made the GFC destructive for bank shareholders was the combination of concentrated credit losses, inadequate capital, and forced dividend cuts. Today’s environment differs on several of these dimensions.
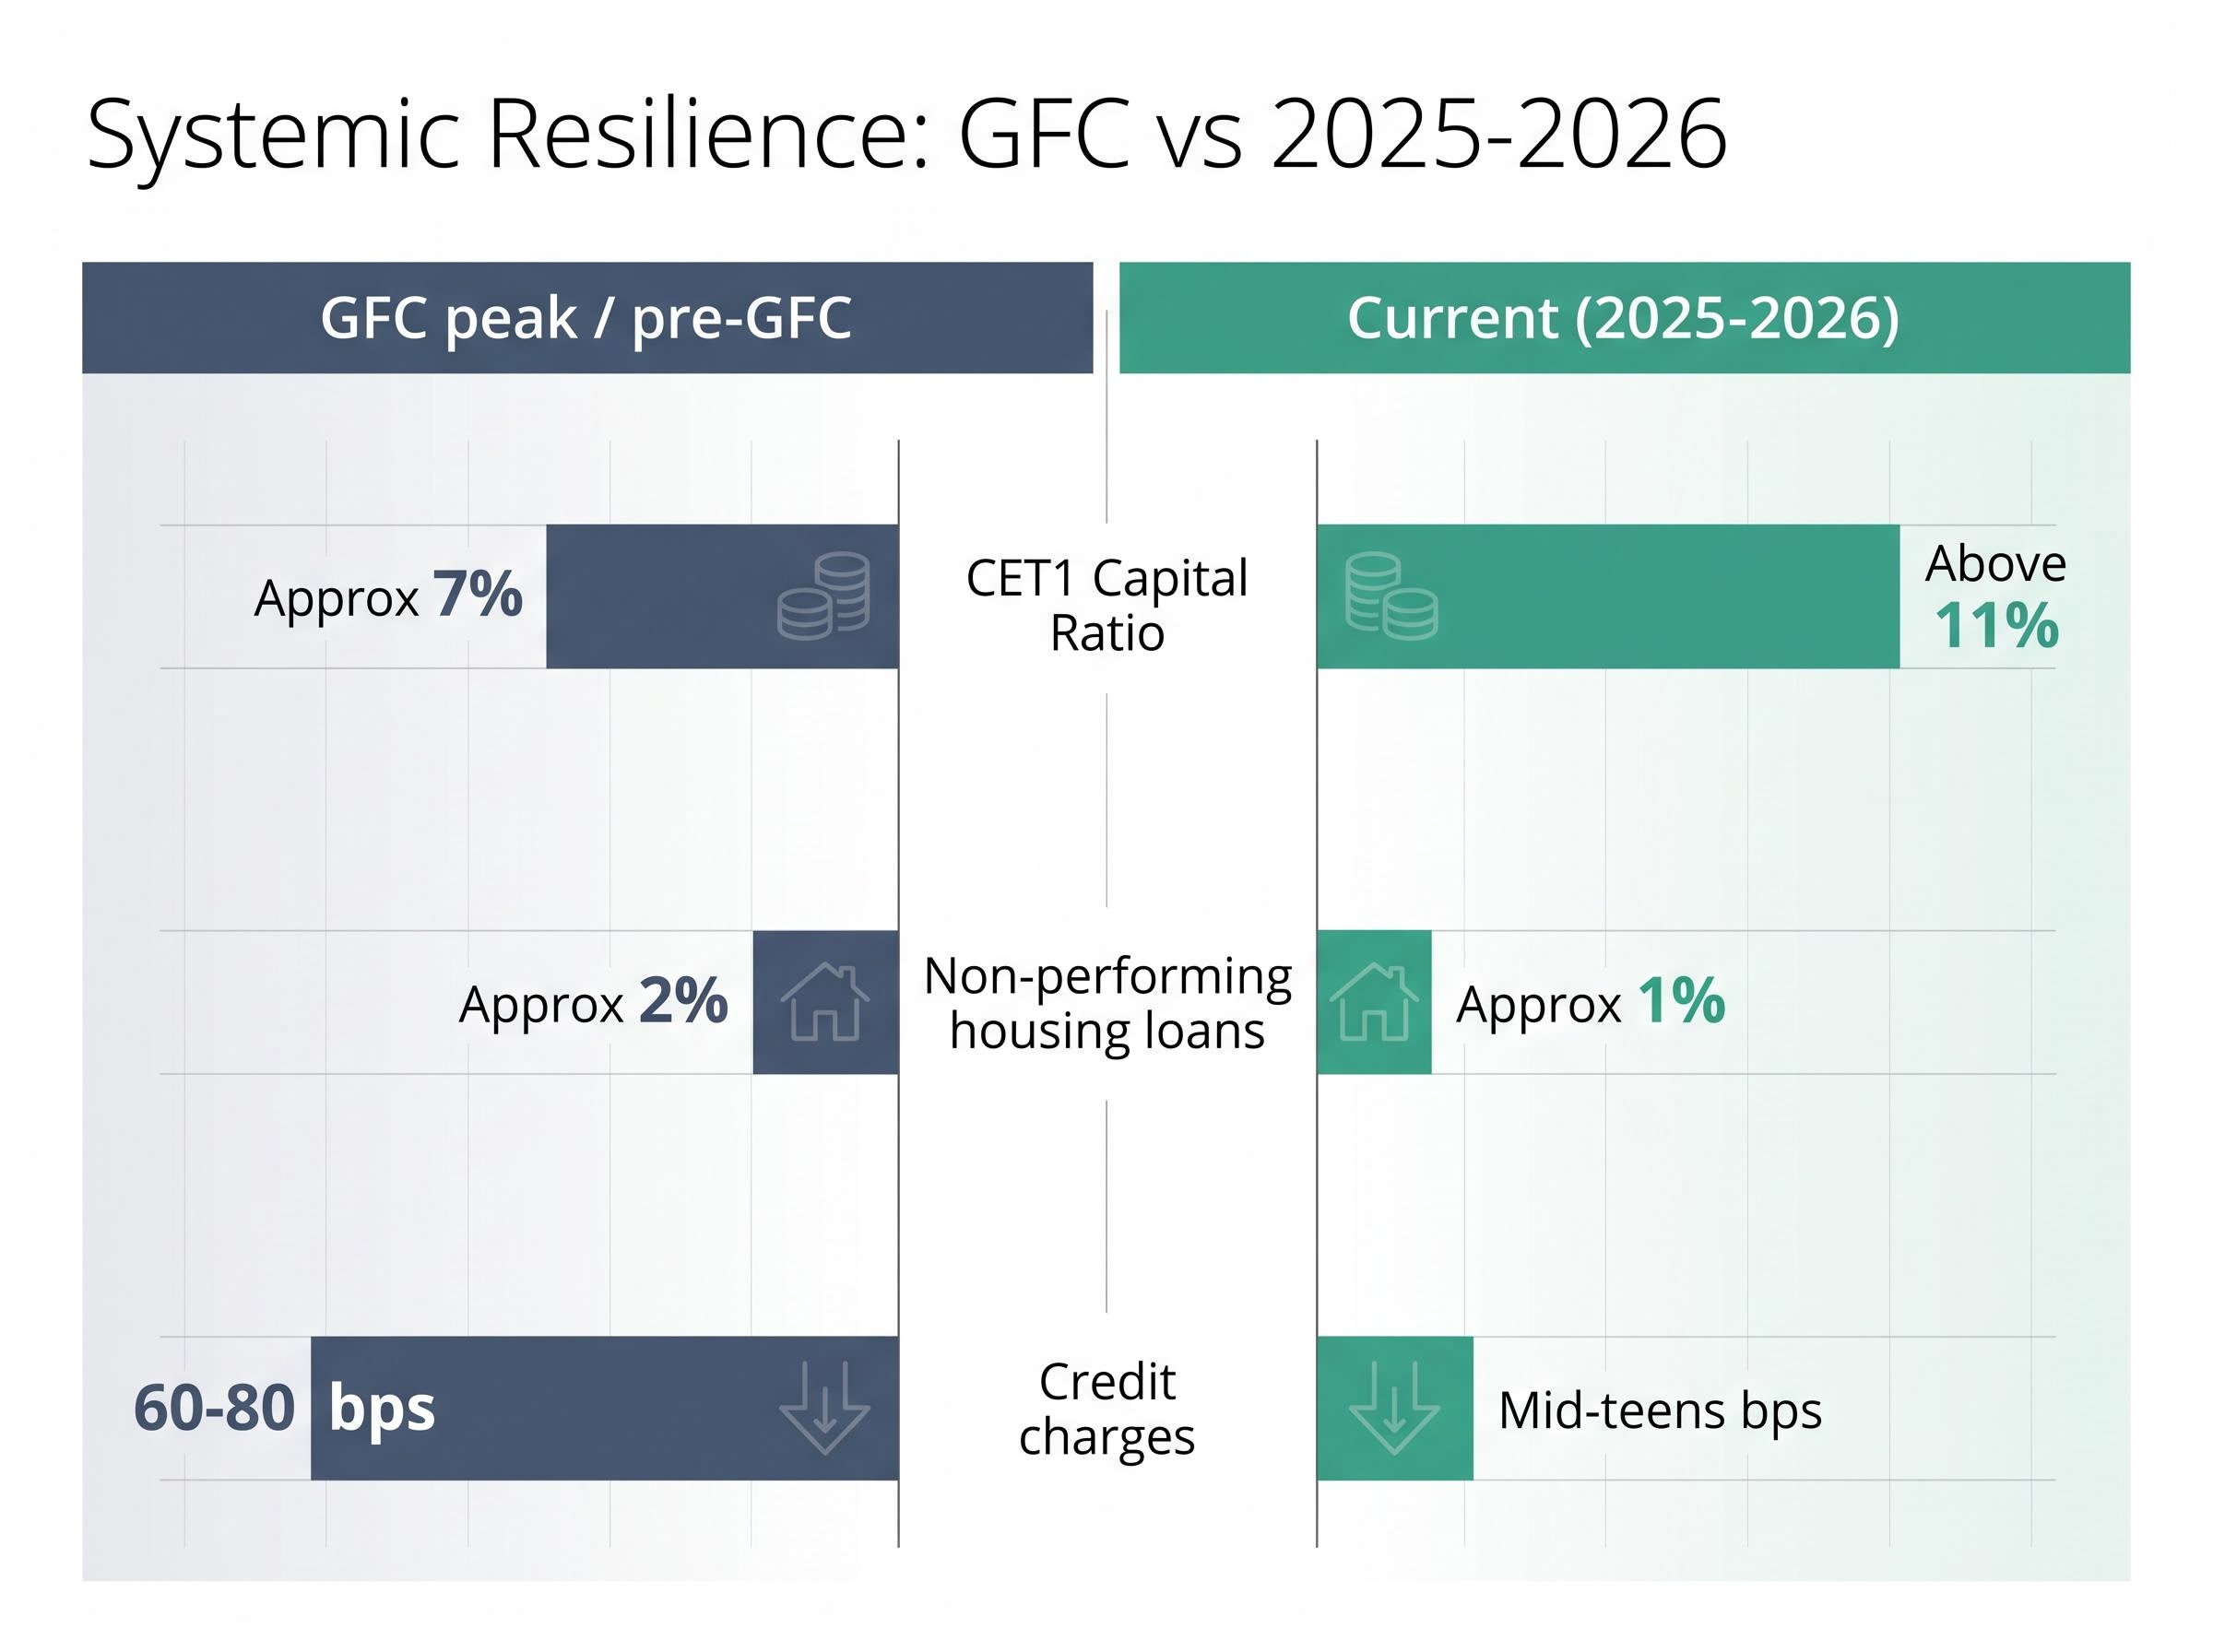
| Metric | GFC peak / pre-GFC level | Current level (2025-2026) |
|---|---|---|
| CET1 capital ratio | Approximately 7% | Above 11% |
| Non-performing housing loans | Approximately 2% | Approximately 1% |
| Credit charges (basis points of loans) | 60-80 bps (peak in 1990s and GFC) | Mid-teens bps |
The RBA’s March 2025 Financial Stability Review noted that non-performing housing loans remain around half the levels seen during the GFC, while APRA’s 2024 Year in Review confirmed that major bank CET1 ratios are roughly double pre-GFC levels. According to UBS Australia’s January 2025 sector outlook, high capital ratios and conservative underwriting make a GFC-style systemic crisis unlikely.
CET1 capital adequacy ratios above 11% across the majors represent a structural improvement from the approximately 7% levels that prevailed before the GFC, but rising risk-weighted assets can erode that buffer faster than headline capital figures suggest; CBA’s Q3 FY2026 disclosure showed total RWA growing 2.4% in a single quarter even as the CET1 ratio held at 11.6%, illustrating the tension between loan book expansion and capital preservation.
The reassurance has limits. The housing market is larger and more expensive than at any prior crisis point. Household leverage is near record highs. Credit charges at mid-teens basis points are abnormally low by historical standards, and Morgan Stanley’s April 2025 analysis warned that normalisation toward past stress levels would materially compress earnings, even without a systemic event. “Not a GFC” does not mean “no risk.” It means the downside is likely smaller but still capable of eroding the earnings and dividends that justify current valuations.
The next major ASX story will hit our subscribers first
Building your own checklist: turning context into conviction
The five factors covered in this guide, income structure, property exposure, unemployment trajectory, management quality, and stress-cycle resilience, are not reasons to avoid Australian bank stocks. They are the conditions under which a valuation number becomes trustworthy or fragile.
Before acting on a PE ratio or DDM output for any major bank, work through this checklist:
- Income structure: Is the bank diversifying its revenue mix, or is earnings growth dependent on mortgage volumes? (Source: bank half-year results presentations.)
- Property exposure: Are national dwelling prices still rising, or are key markets like Sydney and Melbourne declining? What are current price-to-income ratios? (Source: Cotality monthly Home Value Index.)
- Unemployment trajectory: Is the unemployment rate stable, rising, or falling? How close is it to the RBA’s forecast? (Source: ABS monthly Labour Force release.)
- Management and capital discipline: Has leadership changed recently? Is the bank maintaining CET1 ratios and managing buybacks conservatively? (Source: ASX announcements, APRA Quarterly ADI Performance statistics.)
- Arrears and provisions: Are 90+ day arrears stable or rising? How do current credit charges compare with historical stress levels? (Source: APRA quarterly statistics, bank results commentary.)
As of May 2026, several of these checks return positive signals. CET1 ratios are above 11% across all majors. Arrears at 0.8% remain well below GFC peaks. No bank is chasing volume-led growth into a weakening environment. Other readings warrant caution: unemployment at 4.3% and rising, property prices falling in Sydney and Melbourne, and household debt near 186% of disposable income.
Analyst consensus on Big Four bank shares in 2026 reveals a striking disconnect between price momentum and fundamental conviction: all 14 analysts covering CBA rate it a sell with an average target implying approximately 25.5% downside, while ANZ is the only major where buy ratings outnumber sells, a divergence that reflects the same qualitative and macro factors this checklist is designed to surface before capital is committed.
These are not one-time checks. Quarterly results, APRA data releases, and RBA monetary policy statements all update the picture. Investors who revisit this checklist periodically, not just at the point of purchase, will be better positioned to adjust their conviction as conditions evolve.
This article is for informational purposes only and should not be considered financial advice. Investors should conduct their own research and consult with financial professionals before making investment decisions. Past performance does not guarantee future results, and financial projections are subject to market conditions and various risk factors.
Bank stocks are not just income: they are a bet on the Australian economy
A PE or DDM valuation provides a starting point for assessing an Australian bank. For a mortgage-heavy, leverage-exposed business operating in an economy with near-record household debt and rising unemployment, the qualitative and macroeconomic context is what determines whether that starting point holds.
The strengths are real. Capital ratios are at historical highs. Arrears remain low. Management teams across the majors are demonstrating credit discipline. Regulatory standards, from APRA’s serviceability buffers to concentration risk oversight, are tighter than at any prior stress point.
The vulnerabilities are equally real. Property momentum is slowing, unemployment is rising, and household savings buffers have eroded. These conditions do not signal crisis, but they do mean that the earnings stability embedded in current bank valuations is not guaranteed.
Before buying any major ASX bank at any price, work through the five-factor checklist, revisit the assumptions in the valuation model, and treat the macroeconomic gauges as live inputs that should update conviction over time. For the numerical side, the companion valuation methodology article covers PE and DDM methods applied to NAB. For ongoing monitoring, APRA’s quarterly statistics and the RBA’s Financial Stability Review are the two most useful public sources.