Who Really Runs a Public Company: Shareholders, Board or CEO?
1 hr ago

Markets dropped sharply in the first quarter of 2026, dragged lower by fears many analysts now consider overblown. The S&P 500 pulled back toward correction territory from its late-February highs, driven not by collapsing earnings or a deteriorating economy, but by anxiety over the Iran conflict and its potential oil supply disruptions. Yet that very pessimism may be precisely what sets up the next sustained leg higher. Two structural forces are converging as the second half of 2026 approaches: the well-documented tendency for US stocks to rally in the 12 months following midterm elections, and the “wall of worry” dynamic in which cautious investor positioning leaves sidelined capital ready to re-enter. What follows is a clear explanation of why legislative gridlock tends to help stocks, how sentiment resets create the conditions for further gains, and what the historical post-midterm record actually shows, so readers can evaluate whether the months ahead are as constructive as some institutional analysts suggest.
Not all pullbacks are created equal. The distinction between why markets fall and how far they fall is the more useful lens for assessing what comes next.
Classifying a selloff correctly is the prerequisite step before any assessment of recovery timing: a decline rooted in sentiment fear resolves differently from one rooted in structural earnings deterioration or a permanently impaired competitive landscape.
The Q1 2026 equity selloff was primarily a sentiment event. Iran-related fears, centred on the Strait of Hormuz and potential oil supply disruptions, drove a wave of risk-off positioning that pushed the S&P 500 toward, but not into, formal correction territory from its late-February peak. The decline looked alarming on a chart. The underlying economy told a different story.
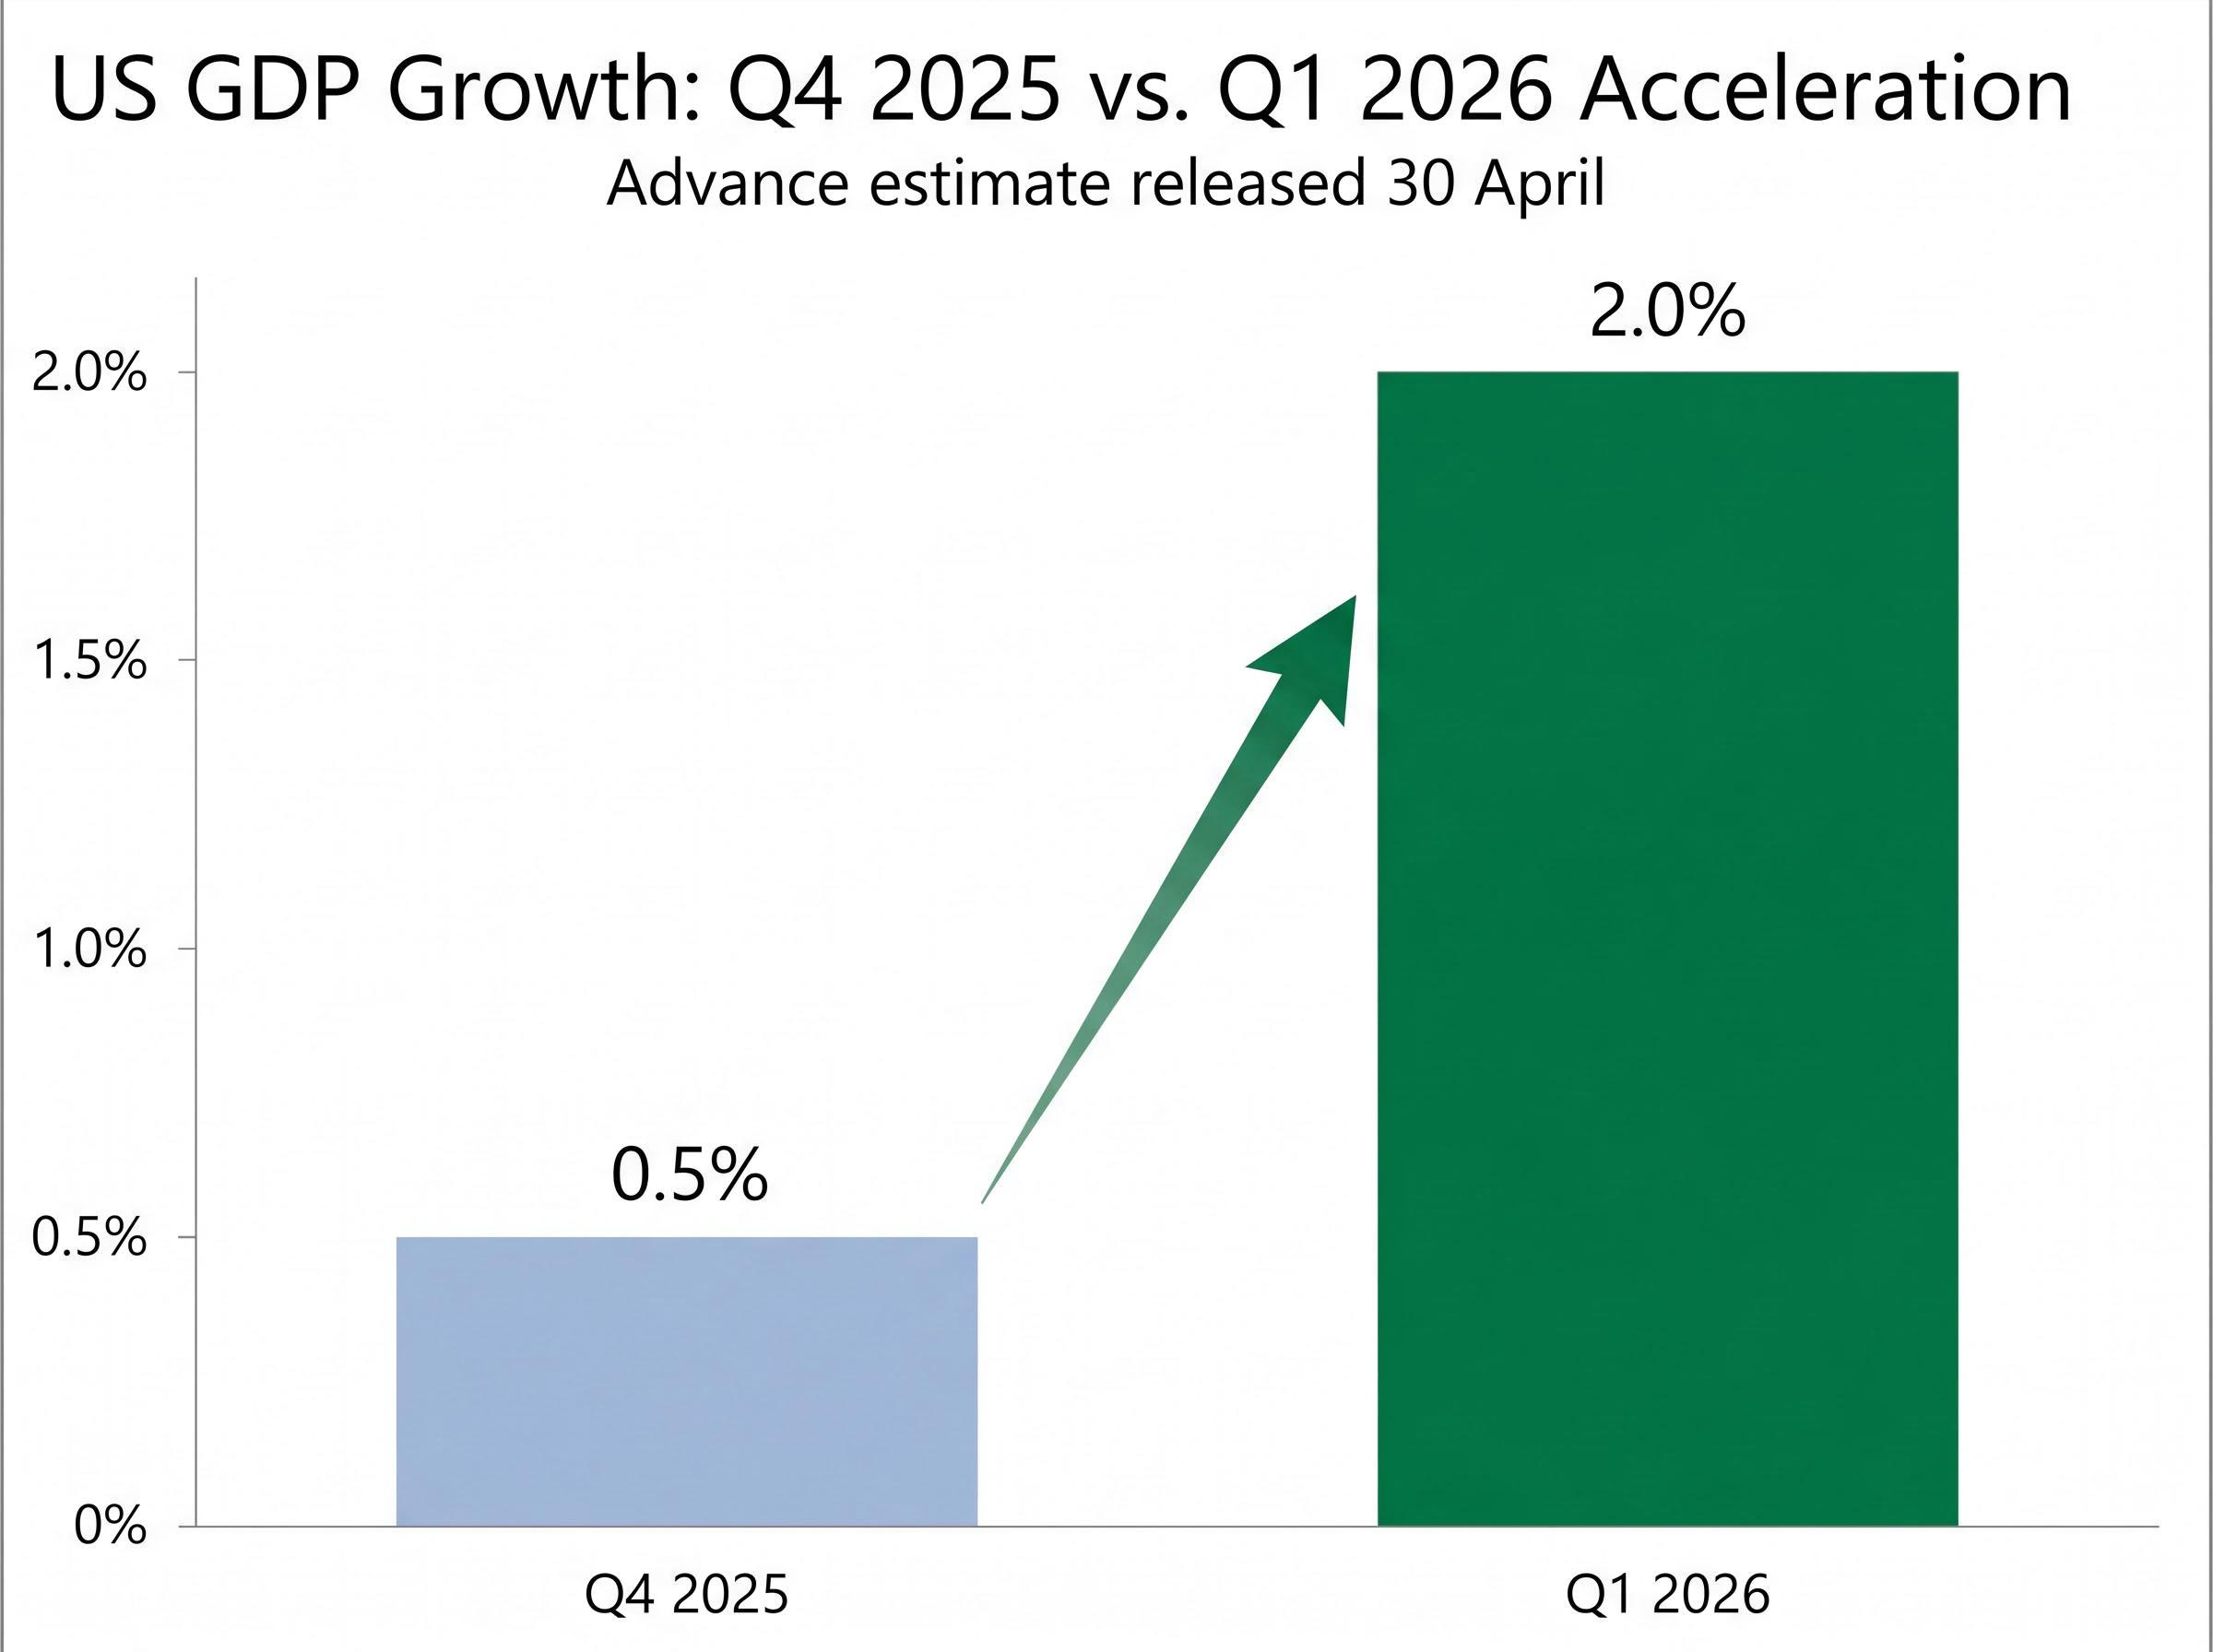
The Bureau of Economic Analysis released its advance GDP estimate for Q1 2026 on 30 April, showing the US economy grew at an annualised rate of 2.0%, a meaningful rebound from Q4 2025’s sluggish 0.5%. Growth was accelerating, not contracting.
The U.S. Treasury’s Q1 2026 economic statement confirmed real GDP growth accelerated to 2.0% at an annual rate in the first quarter, corroborating the Bureau of Economic Analysis advance estimate and reinforcing the case that underlying economic conditions remained sound through the Iran-driven market turbulence.
This matters because sentiment-driven pullbacks and fundamentals-driven bear markets follow different recovery paths:
Fisher Investments characterised the Q1 2026 downturn as sentiment-driven, noting that the overall bull market forecast remained intact as of May 2026.
The rest of this article builds on that distinction. If the decline was a sentiment shock imposed on a fundamentally sound economy, the question becomes: what happens when the sentiment resets?
The idea that pessimism can be good for stocks sounds counterintuitive. It is, until the mechanism becomes clear.
Wall of worry: A market condition in which equity prices climb despite widespread investor anxiety, because cautious positioning leaves capital on the sidelines. As worries gradually ease, that sidelined capital re-enters the market, providing sustained buying pressure that supports further gains.
The concept is not about optimism. It is about positioning. When investors are fearful, they hold more cash, reduce equity exposure, and hedge aggressively. That creates a large pool of potential buying power. Each piece of better-than-expected news, each worry that fails to materialise, releases some of that capital back into equities. The market climbs not because everyone is confident, but because enough people are cautiously re-entering.
In Q1 2026, that mechanism reset. Investor confidence that had been gradually rebuilding following the 2025 market correction was effectively erased by Iran-conflict fears. Sentiment returned to a cautious baseline, recreating the conditions that historically precede sustained rallies.
The consumer confidence divergence from equity market performance in April and May 2026 reached historically unprecedented levels, with the University of Michigan’s final April reading hitting a record low of 49.8 while the S&P 500 traded near all-time highs, a pattern that prior cycles suggest tends to coincide with market troughs rather than the onset of sustained declines.
The mid-May 2026 sentiment picture is notably mixed:
These two readings appear to contradict each other. The AAII survey, which polls individual investors directly, shows bears nearly matching bulls, with 36.6% bearish sentiment remaining elevated relative to long-term averages. The CNN index, which aggregates multiple market-based indicators including momentum, options activity, and junk bond demand, registers a greed reading.
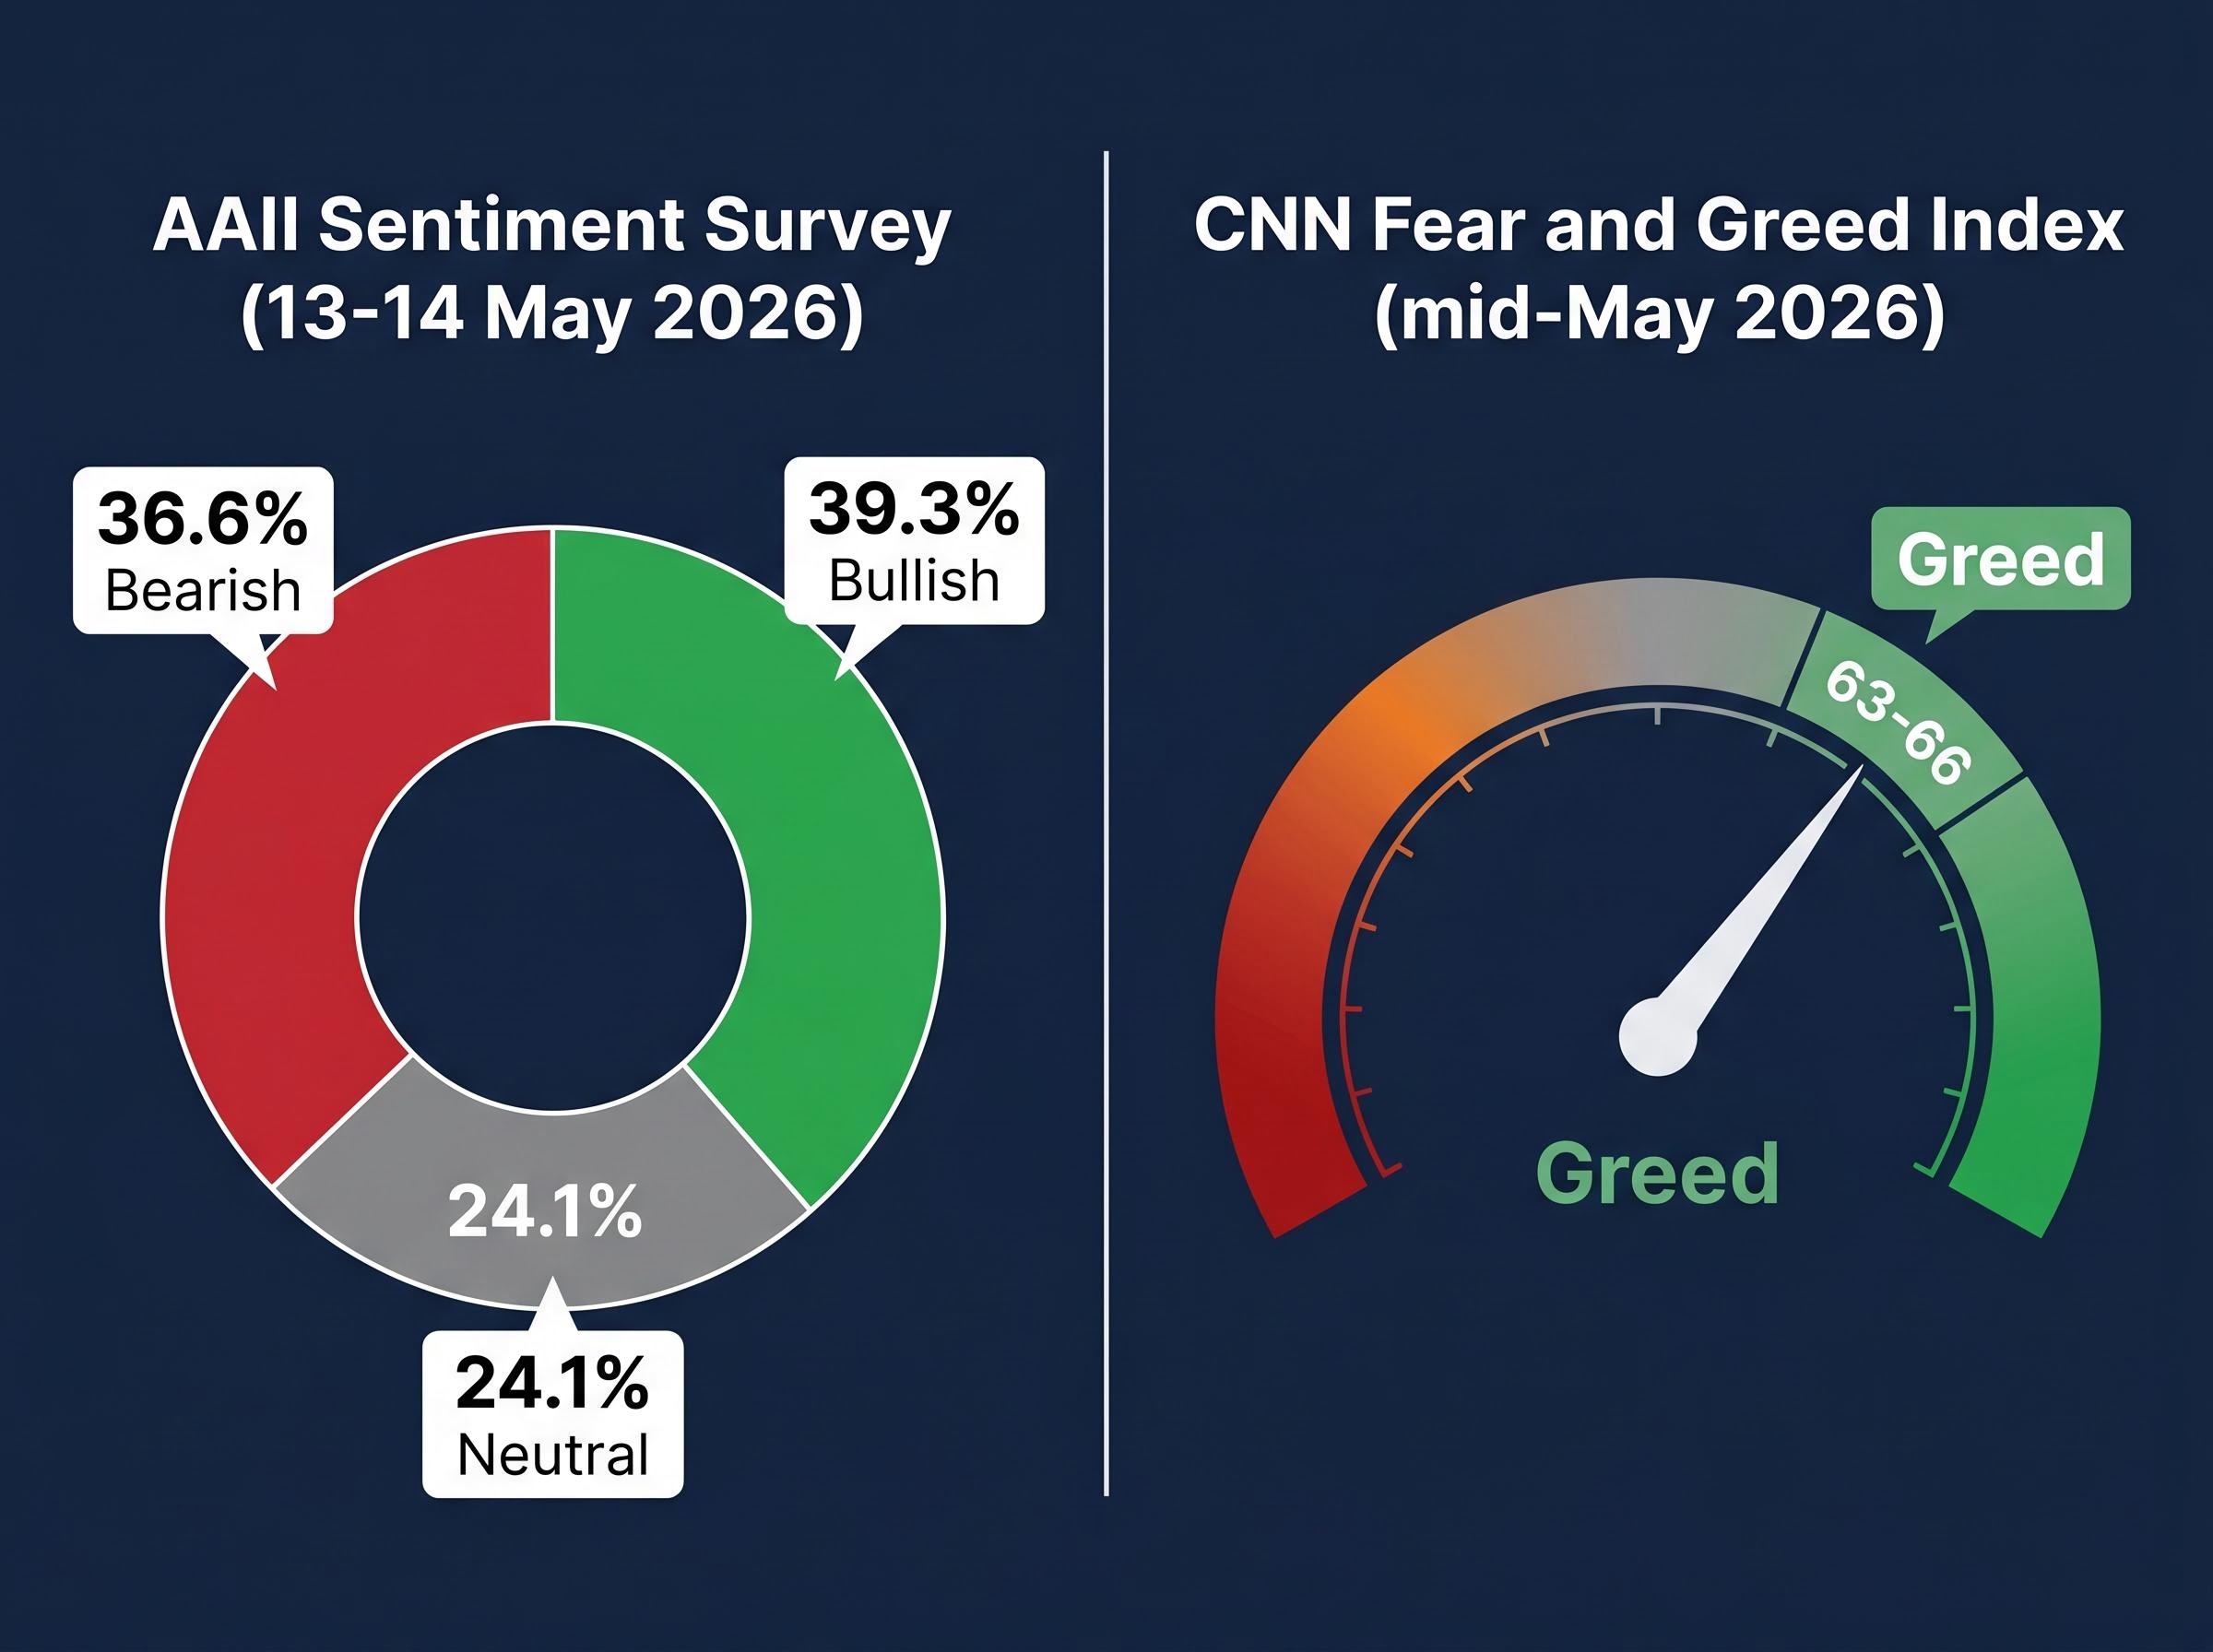
The divergence itself is informative. Individual investors remain cautious even as market-derived signals turn more positive. That gap, where the market’s behaviour is running ahead of investor confidence, is consistent with a wall of worry rather than the kind of universal complacency that typically precedes major selloffs. Even the CNN “Greed” reading sits well below euphoric extremes.
Consider the record before the interpretation.
US equity markets have historically delivered above-average returns in the 12 months following midterm elections. Analysts refer to this pattern as the “Midterm Miracle,” and it rests on a straightforward logic: midterm elections resolve a significant source of political uncertainty, giving corporations and investors greater clarity on the legislative environment for the following two years.
| Midterm Election Year | S&P 500: 12-Month Post-Midterm Return | Notes |
|---|---|---|
| 2022 | +10.1% | Recovery from 2022 bear market; divided Congress confirmed |
| 2018 | +10.9% | House flipped to Democrats; gridlock materialised |
| 2014 | +1.4% | Below-average; global growth concerns weighed |
| 2010 | +11.0% | Post-GFC recovery; strong earnings rebound |
| 2006 | +14.3% | Pre-financial crisis gains; House shifted to Democrats |
The pattern is visible but not mechanical. The 2014 cycle delivered below-average returns despite the historical tendency, a reminder that broader macro conditions still matter. The general direction, however, has been consistent: post-midterm 12-month periods have more often produced above-average than below-average equity returns.
Fisher Investments, in its Q1 2026 outlook and subsequent May commentary, explicitly applied this framework to the current cycle, characterising existing market volatility as establishing the kind of pessimistic baseline that has historically preceded strong post-midterm recoveries.
The 2026 midterms approach with that baseline already in place. Current volatility, driven by Iran-related fears rather than economic deterioration, mirrors the pattern of pre-midterm pessimism that the historical record suggests tends to resolve positively.
Investors wanting to stress-test the historical case more rigorously will find our deep-dive into the post-midterm rally record, which examines all 19 cycles since 1950, the role of uncertainty resolution versus party composition, and the specific complication posed by the S&P 500’s already-elevated starting point heading into November 2026.
Most voters view a gridlocked Congress as a failure of governance. Equity markets have historically treated it as something closer to a stabilising force.
The logic is not ideological. It is structural. Three factors explain why reduced legislative activity tends to support equity prices:
Analysts at Fisher Investments have characterised the anticipated outcome of the 2026 midterms as likely to increase legislative gridlock, a development they view favourably for equity returns. Their analysis also notes a broader tailwind: the number of major global elections in 2026 is limited compared to recent prior years, and most international trade negotiations have been characterised as largely resolved. The aggregate political risk premium that markets have been pricing is therefore diminishing from multiple directions simultaneously.
Geopolitical crises feel unique and unresolvable while they are unfolding. The historical record suggests they follow a more predictable arc than investors tend to assume in the moment.
Fisher Investments’ analysis of prior conflicts identifies a consistent pattern:
Equity markets have historically rebounded, and oil prices normalised, within approximately 6-12 months of conflict onset, well before hostilities formally ended.
This does not mean the Iran situation is trivial. It means markets are forward-looking instruments that begin pricing in resolution before resolution arrives. The key question is not whether the conflict ends, but whether its market impact follows the historical recovery arc.
Three distinct mechanisms support the case that it will:
Fisher Investments has characterised Iran-related oil supply fears as overstated relative to historical precedent, consistent with their broader view that the current pullback is sentiment-driven rather than reflective of a genuine structural shift in energy markets.
Three forces covered in this article are converging: a sentiment reset that has recreated a constructive wall of worry, an approaching midterm election that historically resolves political uncertainty in favour of equities, and a geopolitical risk premium that historical patterns suggest will decline within the conflict’s first year.
The convergence of cautious sentiment positioning, anticipated political clarity from the 2026 midterms, and a geopolitical recovery arc consistent with historical precedent creates a structurally constructive backdrop for US equities in the second half of the year.
That backdrop is constructive. It is not a guarantee. The thesis is conditional, and the conditions can be monitored.
The Q1 2026 GDP rebound to 2.0% provides the current fundamentals anchor. Fisher Investments’ bull market forecast remains intact as of May 2026, representing one institutional perspective that the underlying conditions support continued equity appreciation. Other analysts may weigh the risks differently, and readers should consider multiple viewpoints when forming their own assessment.
Tactical inflection signals worth monitoring include the BofA Bull and Bear Indicator, which moved from 6.1 in mid-April to approximately 7.6 by mid-May 2026, approaching the formal 8.0 contrarian sell threshold, alongside the Philadelphia Semiconductor Index trading at levels of technical overextension comparable to the Nasdaq at the dot-com peak.
Historical patterns, including the post-midterm rally tendency, are observations across multiple cycles. They are not mechanical laws that apply identically in every instance.
The convergence of a sentiment reset, approaching political clarity, and geopolitical de-escalation creates a structurally constructive backdrop for the second half of 2026. That said, readers should weigh this framework alongside their own financial situation, risk tolerance, and investment timeline. No historical pattern eliminates the possibility of outcomes that deviate from the average.
The more useful takeaway is not a prediction. It is a distinction: the ability to separate noise from signal. Short-term sentiment shocks generate headlines and anxiety. Underlying fundamentals and historical patterns tend to prevail over longer timeframes, though not without interruption. Understanding that distinction does not remove uncertainty. It does make the uncertainty more readable.
Revisit the sentiment indicators, the political calendar, and the geopolitical de-escalation arc periodically as 2026 unfolds. The framework outlined here provides specific, measurable signposts rather than abstract reassurance, and the signposts will either confirm or challenge the thesis in real time.
This article is for informational purposes only and should not be considered financial advice. Investors should conduct their own research and consult with financial professionals before making investment decisions. Past performance does not guarantee future results. Financial projections are subject to market conditions and various risk factors.
The post-midterm election stock market rally pattern refers to the historical tendency for US equities to deliver above-average returns in the 12 months following midterm elections, driven largely by the resolution of political uncertainty and the increased likelihood of legislative gridlock.
Legislative gridlock benefits equity markets because it increases policy certainty, reduces the probability of sweeping regulatory changes, and compresses the risk premium that investors demand for potential adverse legislation, which can lift valuations independently of earnings growth.
The Q1 2026 equity pullback was primarily a sentiment-driven event, caused by investor fears surrounding the Iran conflict and potential oil supply disruptions through the Strait of Hormuz, rather than any genuine deterioration in US economic fundamentals, which showed GDP growth accelerating to 2.0% annualised in Q1 2026.
The wall of worry describes a market condition where equity prices continue to rise despite widespread investor anxiety, because cautious positioning leaves large amounts of capital on the sidelines that gradually re-enters the market as individual worries fail to materialise, providing sustained buying pressure.
Investors should track the AAII bearish sentiment reading (36.6% in mid-May 2026 is the baseline), the post-midterm legislative outcome to confirm whether gridlock materialises, and the Iran conflict arc to see whether oil prices and geopolitical risk follow the historical 6-12 month normalisation pattern.