Why the 2026 Midterm Could Break a Rare Presidential Streak
2 hrs ago

The S&P 500 has never posted a losing 12-month period following a midterm election since 1950. Across all 19 cycles, through recessions, financial crises, and geopolitical shocks, the index has delivered positive returns in the year after voters go to the polls. That is not a forecast. It is a historical record that covers every US midterm election of the past seven decades.
With US midterm elections approaching in November 2026, and a brief but sharp equity pullback from the Iran conflict already absorbed in Q1, several institutional voices, Fisher Investments among the most vocal, are arguing that the second half of the year could represent a setup rather than a stumbling block. The pattern has a name: the US Midterm Miracle.
What follows is an analysis of why the political calendar tends to favour equities after midterm elections, what role legislative gridlock specifically plays in that dynamic, and why the sentiment reset from the Iran conflict may be amplifying the potential upside rather than undermining it. The limitations of the thesis receive equal attention.
Midterm election years are historically the weakest phase of the four-year presidential cycle. Data compiled by Capital Group using RIMES and S&P index data from 1931 through December 2025 shows a consistent pattern: flat to negative returns in the first half of the year, sharper weakness in the six to twelve months before the election, and a pronounced rebound once results are settled.
The typical midterm year produces low single-digit full-year returns, well below the average for non-election years. Volatility is elevated, and the deepest intra-year pullbacks of the presidential cycle tend to cluster in this phase.
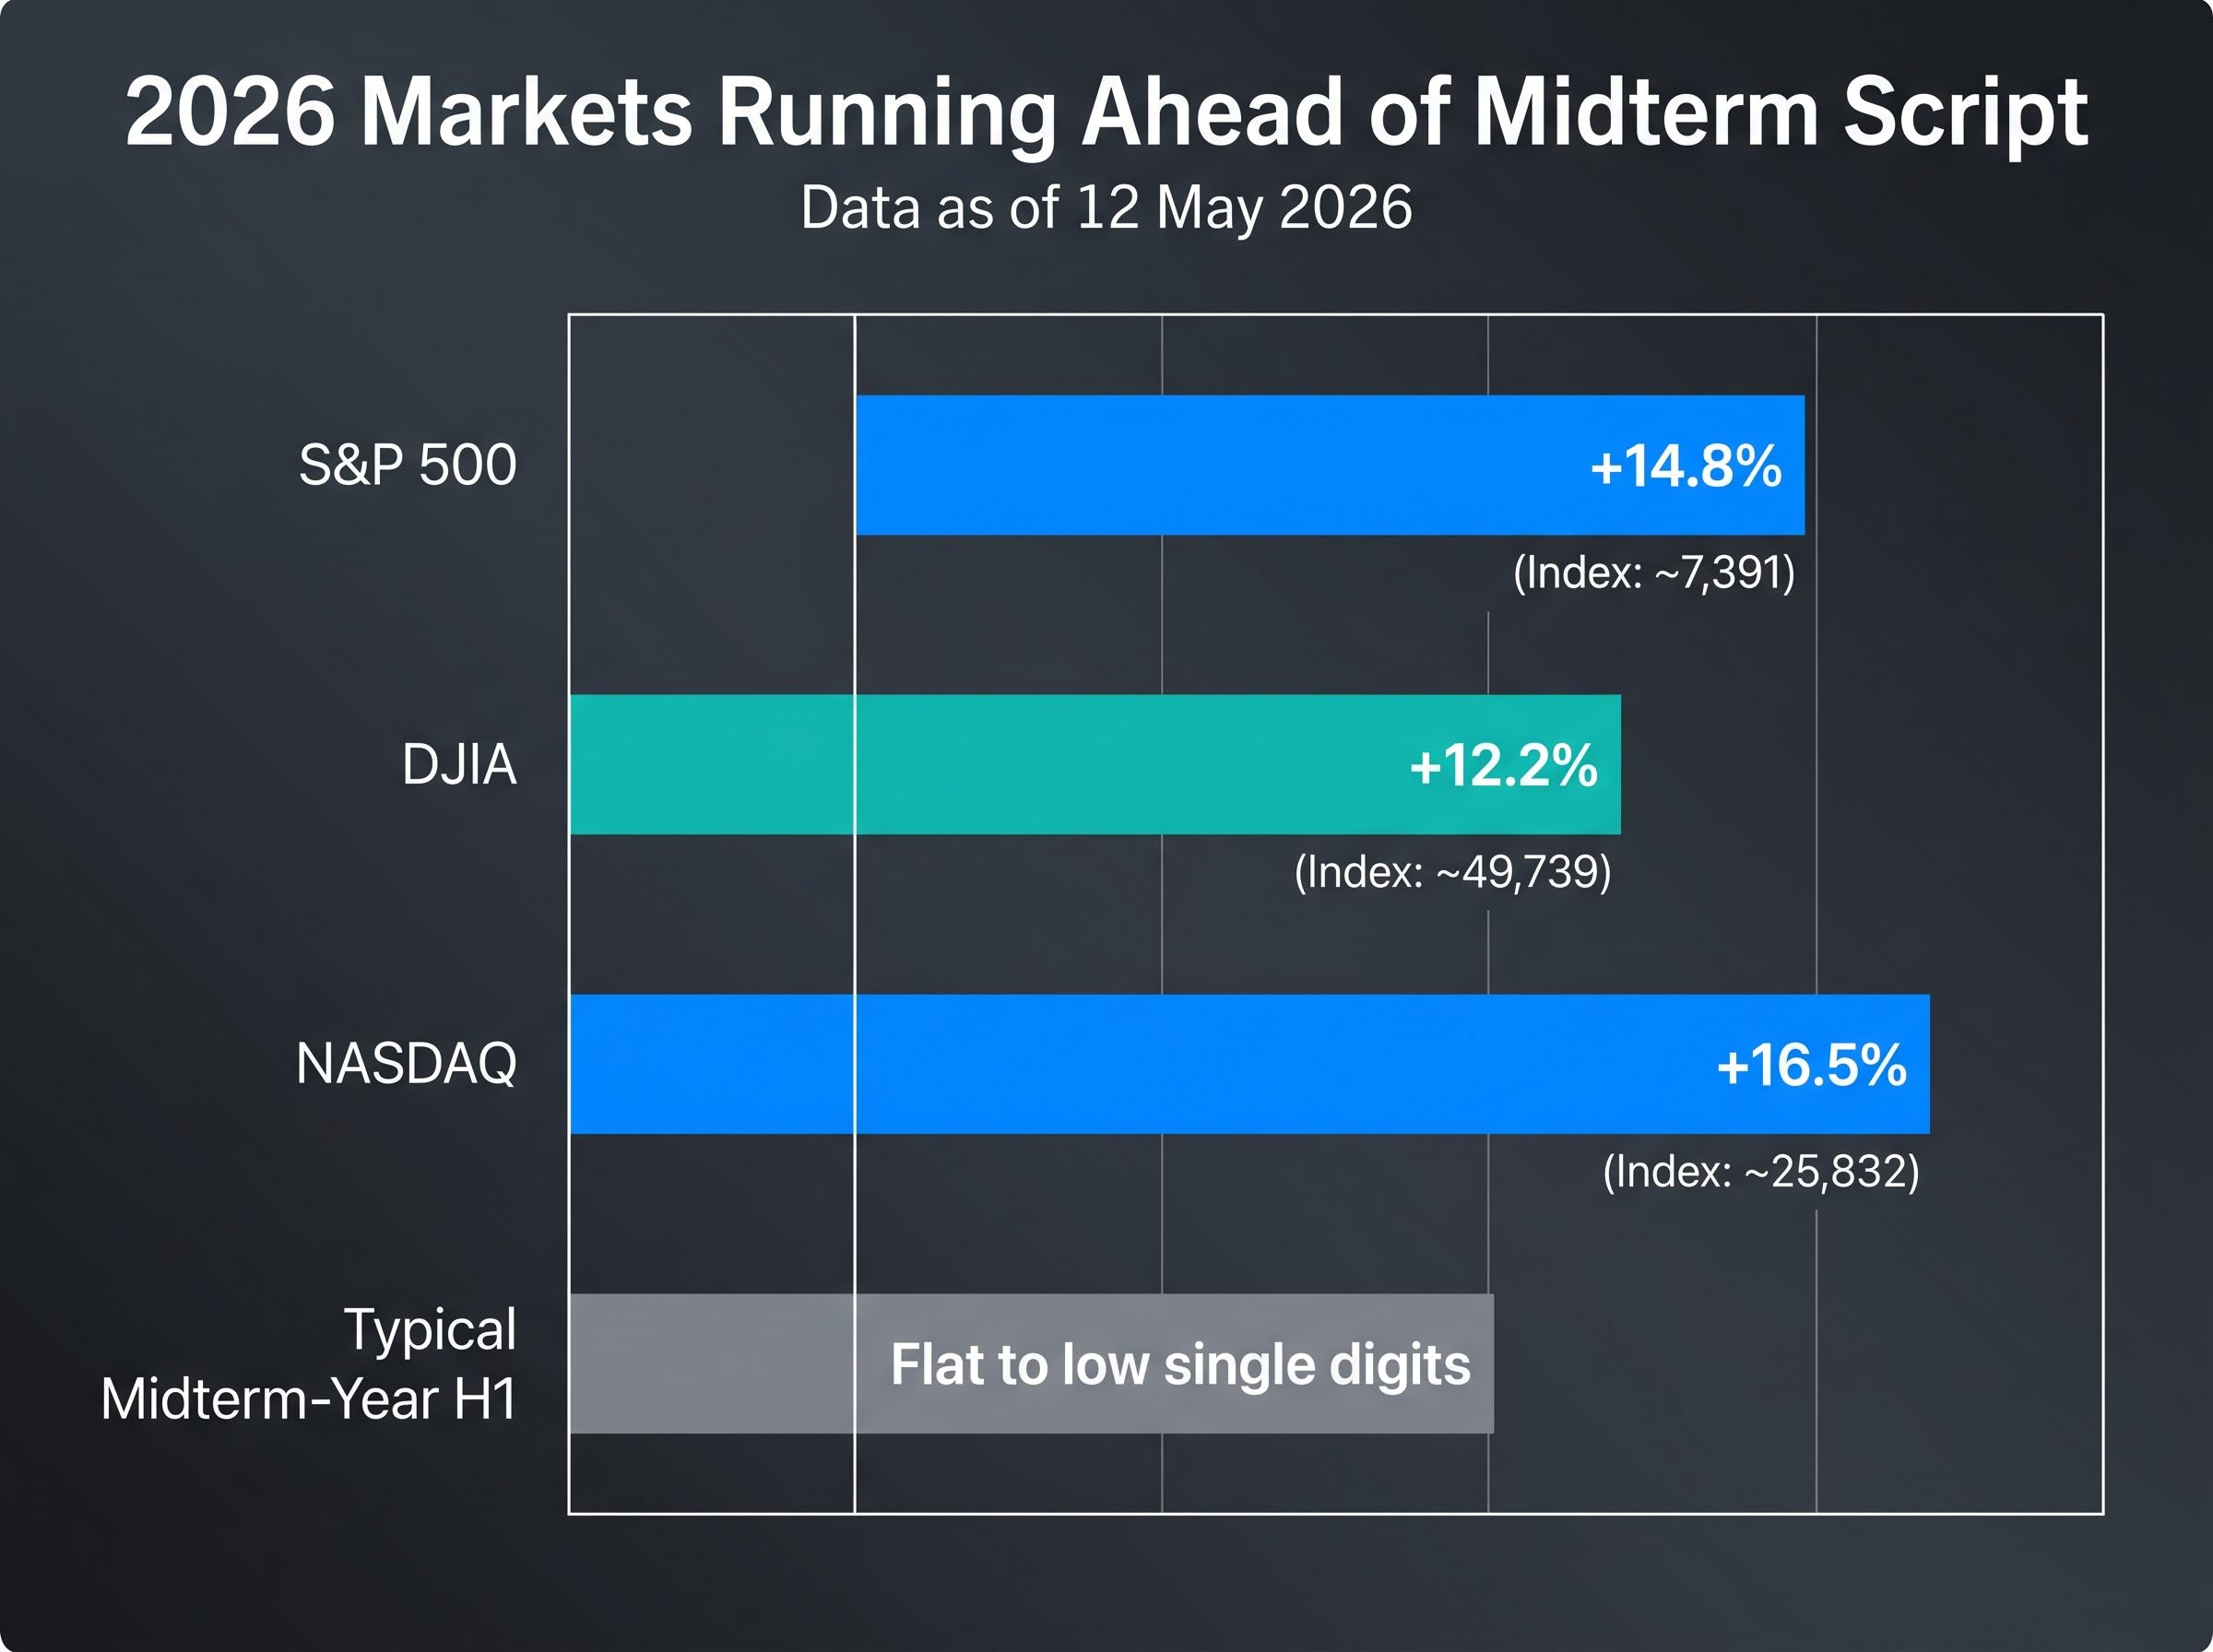
Through 12 May 2026, US equities are running materially ahead of that template.
| Index | Level (12 May 2026) | YTD Return | Typical Midterm-Year H1 |
|---|---|---|---|
| S&P 500 | ~7,391 | +14.8% | Flat to low single digits |
| DJIA | ~49,739 | +12.2% | Flat to low single digits |
| NASDAQ | ~25,832 | +16.5% | Flat to low single digits |
The February 2026 Iran conflict dip, an approximately 5% equity decline, superficially resembled the typical midterm-year pullback. But it was shallow by historical standards and brief, with markets recovering to new highs by May. Strong corporate earnings appear to be overriding the usual political-uncertainty drag.
That divergence is the central tension. If the pre-election weakness phase has been compressed or skipped entirely, can the post-election tailwind still apply? Or has 2026 already consumed the gains that normally arrive after the vote?
The post-midterm rally is one of the most consistent patterns in US equity market history. Understanding why it holds requires looking past the statistic and into the mechanism.
The S&P 500 has posted positive returns in the 12 months following every midterm election since 1950, across all 19 cycles through the 2022 midterms, with no exceptions, including during financial stress periods. (Yahoo Finance, 4 May 2026; 24/7 Wall St., May 2026)
The driver is not which party wins. It is that the election itself resolves uncertainty. Markets dislike unresolved policy questions, and the months leading up to a midterm are saturated with them: which committees will change hands, which legislative agenda survives, which regulatory posture shifts. Once the vote settles those questions, capital that had been waiting on the sidelines finds reason to deploy.
Three specific conditions emerge in the post-midterm environment:
The average 12-month post-midterm S&P 500 return is approximately 15-19%, depending on methodology. Perplexity cites 15.4%; Forbes reports approximately 18.6%. The precise figure is debated, but the directional conclusion is well supported. Morgan Stanley (2026) frames post-election gridlock as neutral-to-positive for equities by limiting extreme fiscal moves.
Capital Group’s midterm election market analysis, drawing on RIMES and S&P index data from 1931 through December 2025, puts the average one-year post-midterm return at 15.4%, with no negative 12-month period recorded across any of the 19 cycles since 1950.
The rebound is strongest in the transition into year three of the presidential cycle (the pre-presidential election year), historically the strongest of the four years. The distinction between “elections drive markets” and “uncertainty resolution drives markets” is one of the most practically useful pieces of financial literacy a retail investor can carry. It reframes the entire relationship between political headlines and portfolio decisions.
The affirmative case is straightforward. A divided government limits the scope for major fiscal disruptions. Neither party can push through extreme legislation without the other’s cooperation, which reduces the probability of sudden tax overhauls, aggressive new spending programmes, or regulatory reversals that might catch markets off guard.
Fisher Investments (May 2026) frames post-2026 midterm gridlock as a tailwind for second-half equities, arguing that it gives businesses and investors a more predictable operating environment. Capital Group’s Chris Buchbinder (January 2026) echoes the broader principle: long-term returns are driven by earnings, not politics. Ameriprise Chief Strategist Anthony Saglimbene (April 2026) argues that fundamentals, including growth, profits, and rates, outweigh the electoral cycle as market drivers.
The gridlock story, however, is not uniformly positive. The “government gap” refers to an observed pattern in which divided government may modestly underperform united government in aggregate equity returns over the full cycle, even while it reduces downside tail risk. The trade-off is real: less disruption, but also less fiscal stimulus.
The effects are not uniform across market segments. Small-cap stocks, which tend to be more domestically policy-sensitive, typically suffer more from legislative paralysis than large-cap multinationals with diversified revenue streams.
| Dimension | Gridlock (divided government) | United government |
|---|---|---|
| Policy risk | Lower; extreme fiscal moves constrained | Higher; large legislative packages possible |
| Aggregate return tendency | Modestly lower average; reduced tail risk | Modestly higher average; greater variance |
| Small-cap vs. large-cap | Small-caps more vulnerable to paralysis | Small-caps may benefit from targeted fiscal policy |
Investors who understand the government gap nuance are better positioned to think about sector-level allocation, not just broad index exposure, when considering how political outcomes interact with portfolio strategy.
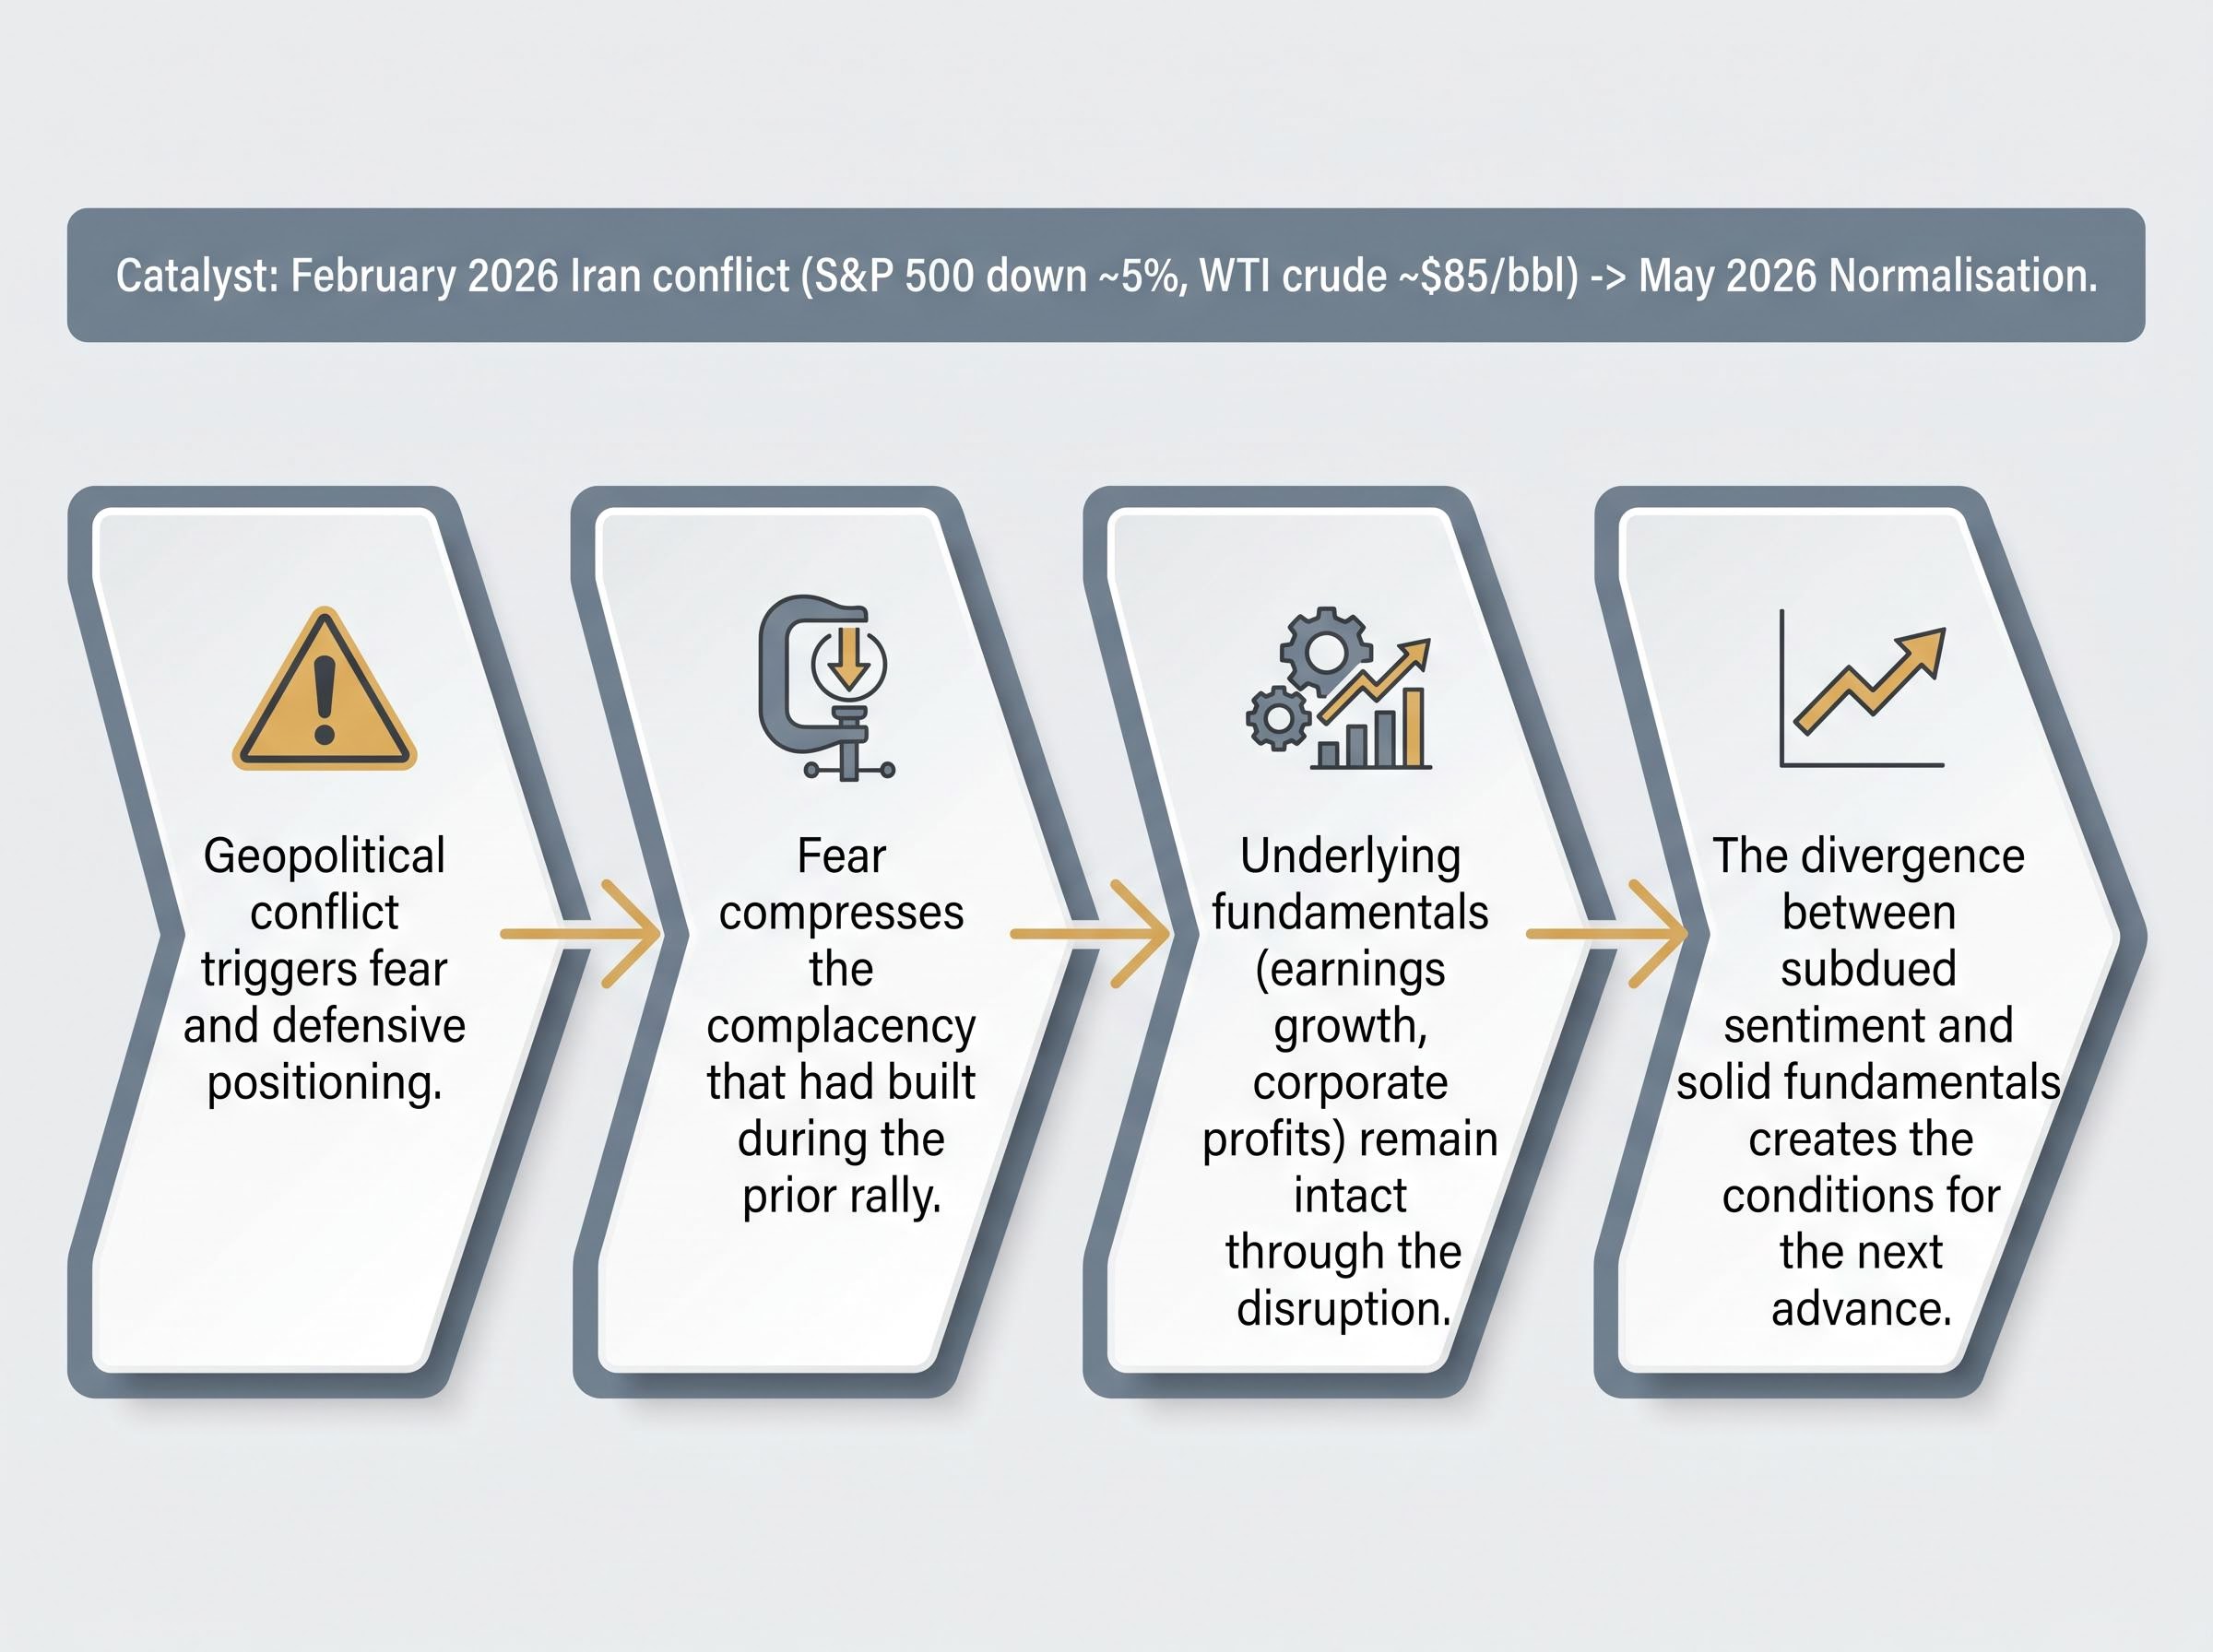
The Iran conflict rattled equity markets in February 2026, pushing the S&P 500 down approximately 5% and WTI crude oil to around $85 per barrel. By May 2026, both metrics had normalised: equities were at or near highs, and the energy market had absorbed the disruption.
The pattern of forward earnings pricing during geopolitical conflict helps explain why the S&P 500 was hitting records above 7,200 in May 2026 even as the Strait of Hormuz remained partially blocked: Goldman Sachs projected 11% total equity returns into 2027 anchored to profit growth, treating the Iran conflict as a secondary variable rather than a primary earnings-cycle risk.
The recovery itself is unremarkable. What Fisher Investments argues is more interesting is what the conflict did to sentiment.
Fisher Investments has noted that investor anxiety over worst-case geopolitical scenarios has historically proven excessive relative to actual outcomes, with equity markets typically rebounding and oil prices normalising within approximately 6-12 months of conflict onset.
The Iran conflict, according to Fisher’s framing, built what the firm calls a “wall of worry.” Before the conflict, investor sentiment had become stretched toward optimism following the 2025 correction recovery. The February pullback compressed that complacency, resetting expectations to more cautious levels even as underlying fundamentals remained intact.
The sentiment reset mechanism follows a specific sequence:
Fisher Investments also highlights a political incentive dimension. The proximity of the midterm elections creates motivation for the Trump administration to pursue rapid resolution of the Iran conflict, which would itself act as a positive sentiment catalyst.
The sentiment reset argument matters because it connects a near-term fear event directly to the structural case for a post-midterm rally, suggesting the two dynamics reinforce rather than compete with each other.
For readers wanting to understand the broader mechanism behind equity resilience during conflict periods, our full explainer on geopolitical risk and stock market behaviour examines why markets process geopolitical events as probability-adjusted earnings inputs rather than proportional headline shocks, covering the April 2026 Caspian Pipeline attack, Taiwan Strait precedents, and the structural adaptive mechanisms in global oil markets that limit economic transmission of localised supply disruptions.
Several threads are now pointing in the same direction for the second half of 2026. The unbroken 19-cycle post-midterm record provides an important historical backdrop, suggesting that uncertainty resolution around the November vote could unlock capital that has been sitting on the sidelines. The prospect of a divided government post-midterms adds another dimension: by constraining both parties from enacting large-scale fiscal changes, legislative gridlock reduces the probability of market-disrupting policy surprises and creates a more predictable operating environment for businesses and investors alike. Alongside these political dynamics, the Iran conflict has left a distinct imprint on market psychology. The February pullback rebuilt the wall of worry that had eroded during the prior rally, and the gap now opening between cautious sentiment and solid underlying fundamentals has historically acted as fuel for further advances.
Fisher Investments (May 2026) maintains its bull market forecast and anticipates stronger performance in the latter portion of the year. Ameriprise (April 2026) anticipates predictable weakness through most of 2026 followed by a rebound post-results. Capital Group (January 2026) recommends bracing for second-half uncertainty while maintaining long-term focus.
The complication is the base effect. When the S&P 500 is already up 14.8% by mid-May, the post-election tailwind, if it arrives, operates from a higher starting point. Historical averages of 15-19% post-midterm returns were calculated from cycles where the pre-election phase often featured flat or negative returns. A rally that begins from an already-elevated base may deliver a smaller incremental gain than the historical average implies.
Narrow market breadth underneath the headline gains adds a further qualification: in April 2026, only 23% of S&P 500 constituents outperformed the benchmark despite a 98th-percentile monthly return, the fourth-lowest breadth reading in nearly four decades of data, which means the strong H1 base effect is concentrated in a small cohort of mega-cap names rather than distributed across the index.
The institutional consensus across firms is that fundamentals, earnings growth, interest rates, and corporate profits, remain the primary long-term driver. The political calendar amplifies or dampens those fundamentals at the margin rather than overriding them. Post-midterm year three of the presidential cycle is historically the strongest of the four years, but 2026’s strong start means expectations should be calibrated accordingly.
Nineteen consecutive positive 12-month periods following midterm elections is a compelling pattern. It is not a guarantee. Every cycle includes variables that the cycle framework alone cannot anticipate.
Several live factors could disrupt the thesis before November and beyond:
Historical oil shock outcomes for equities complicate the bullish read on the Iran conflict’s resolution: every prior episode of Brent crossing $100 per barrel, in 2008, 2011, and 2022, produced S&P 500 returns well below the index’s long-run average over the following 12 months, and Goldman Sachs estimated a global oil supply deficit of 9.6 million barrels per day at the disruption’s peak.
It is also worth noting a gap in the institutional consensus picture. Goldman Sachs and JPMorgan have not been cited in available 2026-specific midterm research, and all supporting analyses in the current base come from practitioner sources (asset managers and financial media) rather than peer-reviewed academic studies. These sources carry their own institutional perspectives and incentives.
Capital Group (January 2026) frames the relationship plainly: elections are one factor among many, and long-term earnings and fundamentals are the primary drivers of market returns.
A calibrated view of what the historical pattern can and cannot predict is more actionable for investors than an unqualified bullish read, because it preserves the thesis while identifying the specific variables worth monitoring.
The post-midterm rally is one of the most consistent patterns in US financial market history. Across 19 cycles since 1950, the S&P 500 has not once delivered a negative 12-month return following Election Day. The mechanism behind it, uncertainty resolution, legislative constraint, sentiment normalisation, is well understood and supported by institutional research from multiple firms.
What makes the 2026 setup distinctive is that two reinforcing dynamics are running in parallel. Reduced political uncertainty following November’s vote and a rebuilt wall of worry from the Iran-driven sentiment reset are pointing in the same direction. The complication, a strong first half that has already consumed some of the expected return potential, tempers the magnitude of the thesis without undermining its direction.
Investors who understand how political cycles interact with sentiment and fundamentals are better positioned to stay disciplined when pre-election volatility returns in the months ahead. The pattern suggests that normal midterm-year noise is not a reason to exit long-term positions; it is a recurring feature of the cycle that has, so far, always resolved to the upside.
This article is for informational purposes only and should not be considered financial advice. Investors should conduct their own research and consult with financial professionals before making investment decisions. Past performance does not guarantee future results. Financial projections are subject to market conditions and various risk factors.
—
The US Midterm Miracle refers to the historical pattern in which the S&P 500 has delivered positive returns in the 12 months following every US midterm election since 1950, across all 19 cycles recorded through the 2022 midterms. The driver is not which party wins but the resolution of policy uncertainty, which encourages sidelined capital to re-enter the market.
Divided government after midterm elections tends to constrain both parties from enacting large fiscal changes, reducing the probability of sudden tax overhauls or aggressive new spending programmes that could disrupt markets. Morgan Stanley frames post-election gridlock as neutral-to-positive for equities, though small-cap stocks that are more policy-sensitive can underperform large-cap multinationals in this environment.
The average 12-month post-midterm S&P 500 return is estimated at approximately 15-19%, depending on the methodology used. Capital Group and Perplexity cite 15.4%, while Forbes reports approximately 18.6%, but all sources agree no negative 12-month return has been recorded across any of the 19 cycles since 1950.
The Iran conflict triggered an approximately 5% equity decline in February 2026, but markets recovered to new highs by May because underlying corporate earnings remained intact and Goldman Sachs projected 11% total equity returns into 2027 anchored to profit growth. Fisher Investments argues the pullback actually helped by resetting investor sentiment from stretched optimism to more cautious levels, creating conditions for further advances.
Key risks include tariff policy uncertainty, the trajectory of inflation and interest rates, potential re-escalation of the Iran conflict, and the possibility that the expected post-midterm gridlock does not materialise depending on election results. The strong first-half performance of the S&P 500, up 14.8% by mid-May 2026, also means any post-election tailwind would operate from an already elevated base, potentially delivering smaller incremental gains than historical averages suggest.