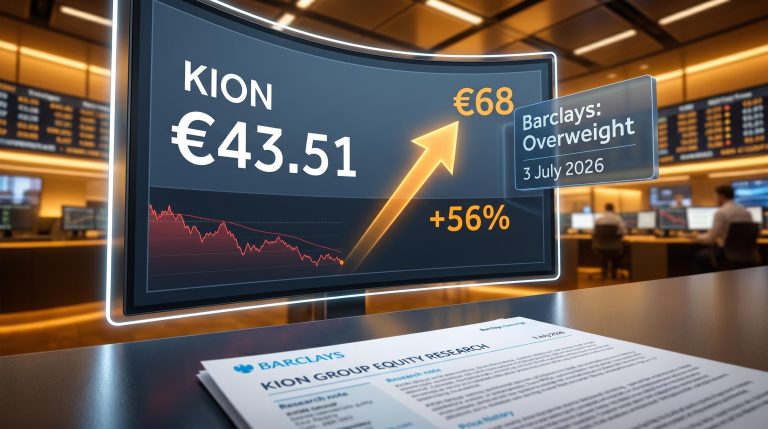
Why Barclays Sees 56% Upside in a Beaten-Down Automation Stock
7 mins ago

The Philadelphia Semiconductor Index is trading approximately 63% above its 200-day moving average, a level of technical overextension not recorded since the Nasdaq’s peak during the dot-com era. That statistic, on its own, would warrant attention. Paired with the broader market backdrop of mid-May 2026, it becomes the centrepiece of one of the most specific contrarian warnings issued on Wall Street this year.
The S&P 500 closed at 7,501 on 14 May 2026. The Nasdaq Composite hit 26,635 on the same day. Record highs across both indices have coincided with a rush of capital back into equities and technology from investors who spent the first quarter in a defensive posture. Bank of America’s Michael Hartnett, the firm’s chief investment strategist, has identified this dynamic as the final stage of a capitulation trade, one he expects to exhaust itself within weeks. His named inflection point: early June 2026.
What follows is an examination of the specific evidence behind Hartnett’s contrarian call, the macro conditions underpinning it, the bullish counterarguments that make it a genuine debate, and the questions investors should be weighing about their positioning right now.
Hartnett’s thesis is not a vague call for caution. It is a time-bound, catalyst-anchored argument that the bearish investors who dominated sentiment surveys in April 2026 are now capitulating into equities and technology at a pace that creates a near-term exhaustion risk. The process, in his framing, has weeks to run rather than months.
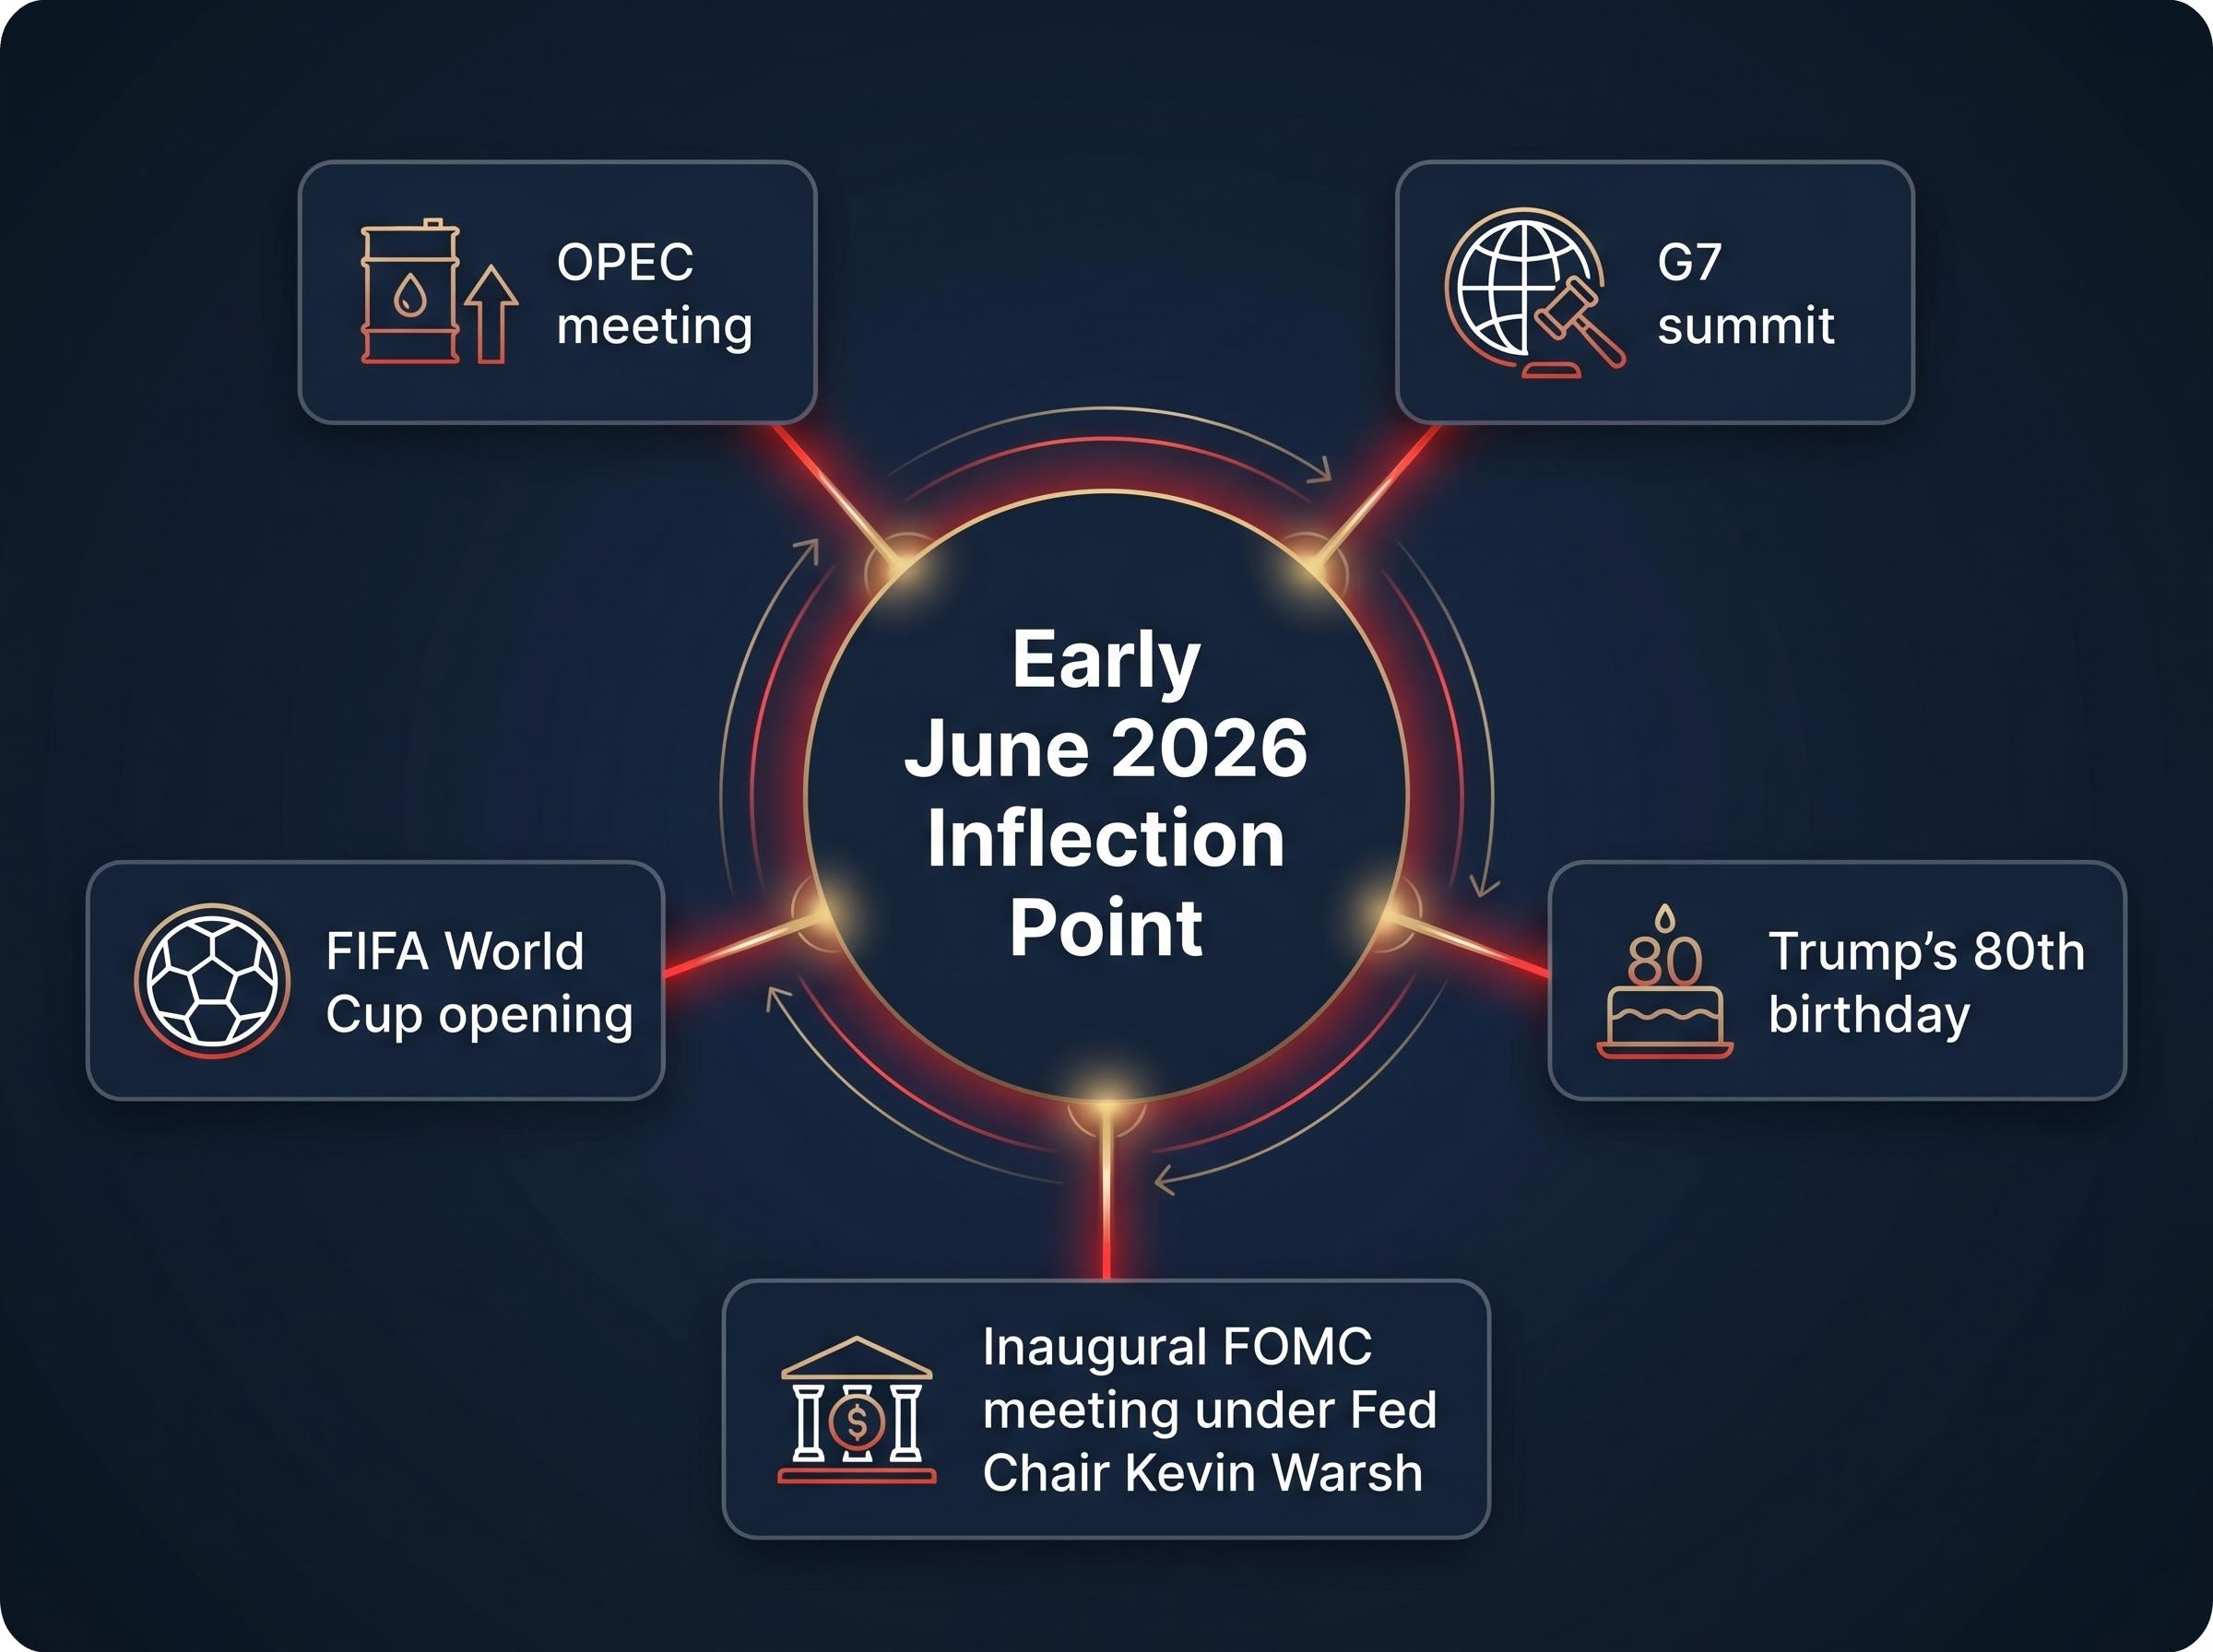
Early June 2026 is the named inflection point because of a specific clustering of macro and political catalysts that BofA identifies as a natural convergence of volatility triggers:
Each event individually carries positioning risk. Clustered within a two-week window, they create the kind of catalyst density that historically forces directional conviction one way or the other. Hartnett’s recommendation, as reported by Investing.com on 15 May 2026, is to use this window for tactical risk trimming, not to exit equities entirely. His broader framework expects positioning in equities and commodities to persist through November 2026.
The distinction matters. This is a near-term positioning recommendation, not a cycle-level bear call.
The Philadelphia Semiconductor Index (SOX) closed at approximately 12,074 on 14 May 2026. Its 200-day moving average sat at approximately 7,376. The gap between the two: roughly 63.7%.
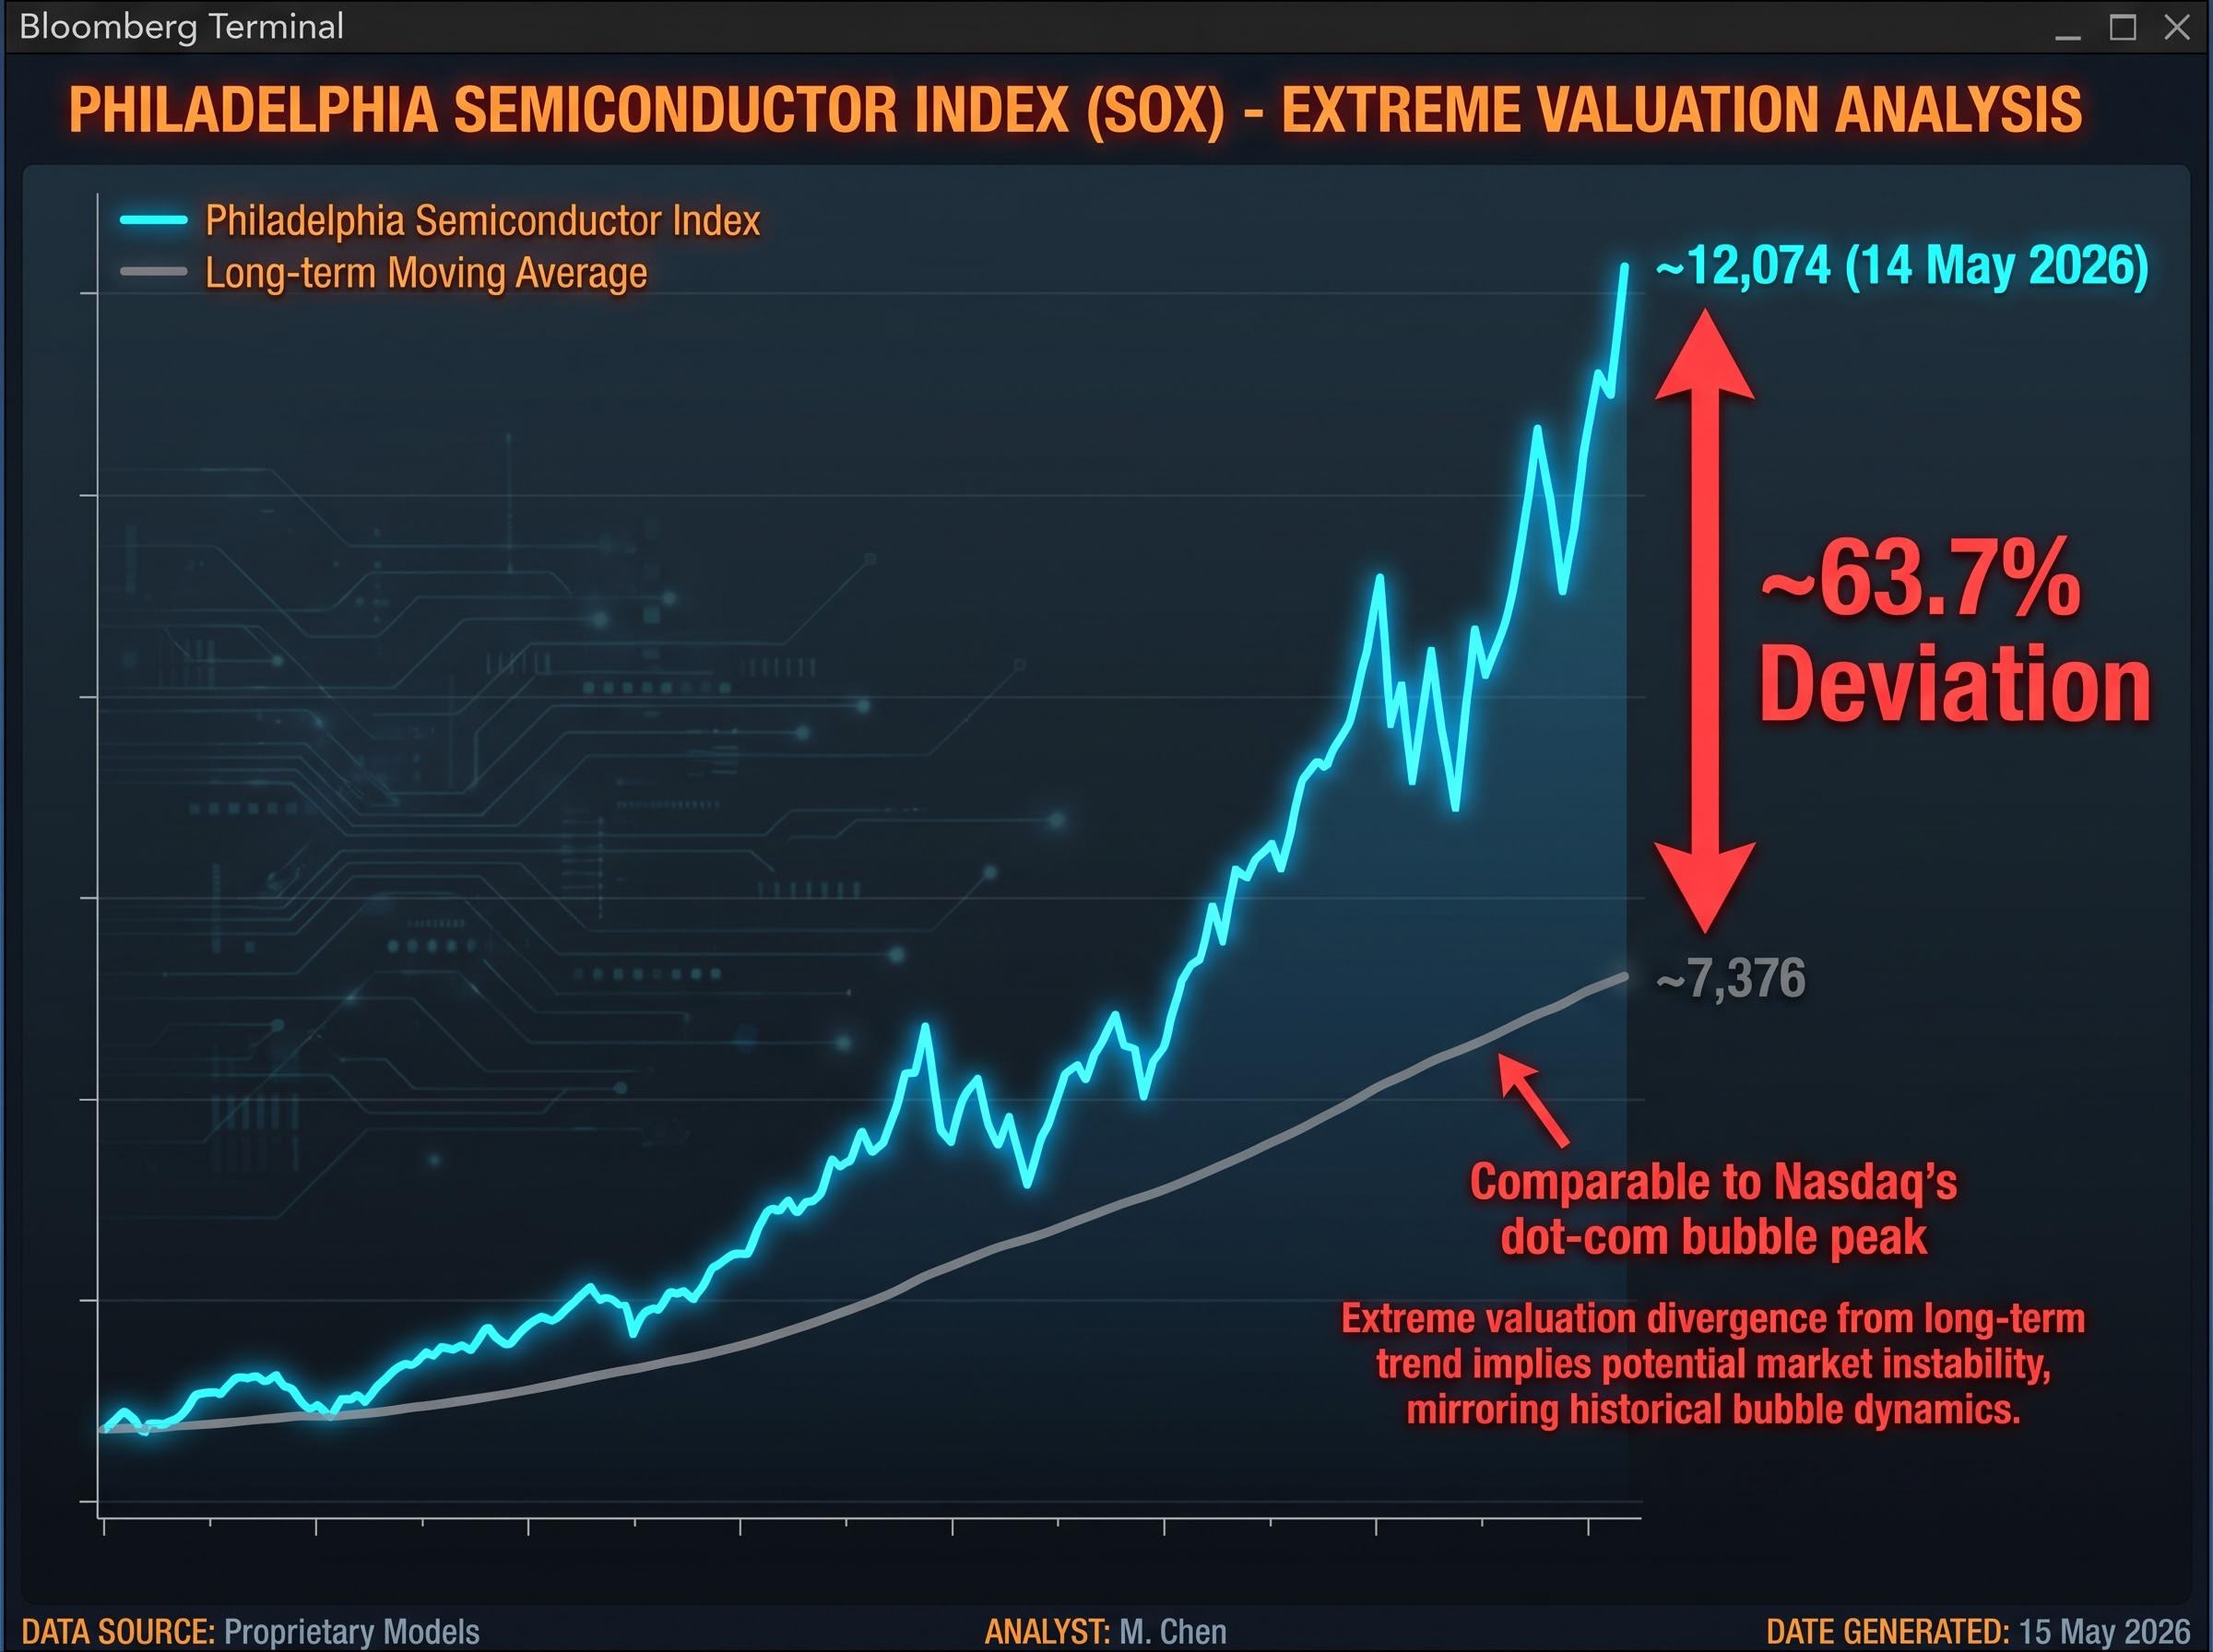
A deviation of that magnitude from a long-term moving average signals something specific in technical analysis. The 200-day moving average represents the average price over roughly ten months of trading, smoothing out short-term noise to reveal the underlying trend. When a price sits 63.7% above that average, it indicates that recent buying has dramatically outpaced the longer-term trend, concentrating speculative positioning in a narrow window.
The SOX’s approximately 63.7% deviation from its 200-day moving average is, in BofA’s framing, comparable to the Nasdaq’s technical overextension at the dot-com bubble peak.
Hartnett has drawn the explicit parallel to dot-com-era Nasdaq valuations. It is worth noting that this specific characterisation originates with BofA rather than being independently corroborated by a separate named source. The 63.7% figure itself, however, is independently calculable from publicly available price and moving average data.
| Metric | Value | Date | Context |
|---|---|---|---|
| SOX closing level | ~12,074 | 14 May 2026 | Record high |
| 200-day moving average | ~7,376 | 14 May 2026 | Long-term trend anchor |
| Percentage deviation | ~63.7% | 14 May 2026 | Dot-com era Nasdaq comparison (per BofA/Hartnett) |
Broader qualitative warnings about AI and technology overcrowding exist across multiple strategists. Albert Edwards at Societe Generale has compared AI-driven excesses to conditions worse than 2008. General financial media coverage uses phrases like “priced for perfection.” None of these sources have independently quantified the SOX deviation at this level, which makes Hartnett’s framing comparatively rare in its specificity.
At dot-com era concentration levels, with the top ten S&P 500 stocks holding approximately 40-43% of total index weight versus roughly 27% at the dot-com peak, passive index investors carry significantly more AI-thematic risk than headline index valuations alone suggest.
The BofA Bull & Bear Indicator is a composite sentiment gauge that runs on a scale from 0 to 8. Understanding how it operates is necessary before evaluating whether its current reading justifies the language surrounding it.
The indicator aggregates positioning data, fund flow patterns, and survey-based sentiment readings into a single number. Its value as a contrarian timing tool comes from its behaviour at extremes:
The most recent independently verifiable reading is 6.1, recorded as of 14 April 2026 per Investing.com. At 6.1, the indicator sits firmly in neutral territory, not at a sell-signal extreme.
On the same date, BofA’s investor survey showed participants at their most bearish in 11 months, a reading that CNBC framed as a contrarian buy signal at the time. The paradox is instructive: survey-based sentiment was deeply pessimistic even as the composite indicator sat in neutral, underscoring how quickly the inputs can shift.
BofA’s reported mid-May commentary places the Bull & Bear reading at 7.6, approaching the 8.0 sell threshold. This figure, attributed directly to Hartnett’s 15 May 2026 commentary, has not yet been independently confirmed in open-source data.
If accurate, the move from 6.1 in mid-April to 7.6 by mid-May would represent a significant repricing in approximately four weeks. That velocity is consistent with the capitulation dynamic Hartnett describes: the investors who registered as most bearish in 11 months in April are plausibly the same cohort now rotating aggressively into equities and technology, driving the composite sentiment gauge upward at speed.
The BofA Bull and Bear Indicator stood at 7.2 in the week ending 8 May 2026, just 0.8 points below the formal sell-signal threshold, with U.S. equity funds logging a sixth consecutive week of inflows even as $136 billion simultaneously rushed into cash funds at the fastest pace since January 2026.
Capital flow data provides a second, independent lens on the same dynamic. Where the Bull & Bear indicator measures sentiment, flows measure where money is actually moving.
BofA’s proprietary research, attributed directly to Hartnett, reports $20.5 billion in weekly equity inflows and $5.4 billion into technology funds (the largest tech allocation since February 2026), alongside $24.4 billion into U.S. large-cap funds and a record $1.5 billion into infrastructure.
Independently verifiable open-source data shows directionally consistent but more variable figures. The Kobeissi Letter reported approximately $8.7 billion in weekly equity inflows in early May 2026. ETF.com recorded approximately $11.4 billion in technology ETF inflows on 30 April 2026. The pattern is the same: capital is flowing into U.S. equities and tech at elevated rates, even if week-to-week magnitudes vary across data sources.
Bond funds have recorded inflows for 55 consecutive weeks, with $28.1 billion in the most recent week, a signal of sustained defensive positioning running beneath the surface of an aggressive equity rally.
The counter-directional flows sharpen the picture. Chinese equity outflows of $22.2 billion (the largest since January 2026) and crypto outflows of $1.3 billion in the same period indicate that capital is rotating specifically toward U.S. equities and technology, not into risk assets broadly.
| Asset class | Weekly flow | Direction | Source |
|---|---|---|---|
| U.S. equities | $20.5B (BofA) / ~$8.7B (Kobeissi) | Inflow | BofA / Kobeissi Letter |
| U.S. large-cap | $24.4B | Inflow | BofA |
| Technology funds | $5.4B (BofA) / ~$11.4B (ETF.com) | Inflow | BofA / ETF.com |
| Bonds | $28.1B (55th consecutive week) | Inflow | BofA |
| Chinese equities | $22.2B | Outflow | BofA |
The combination of record technology inflows, simultaneous exits from Chinese equities and crypto, and sustained bond accumulation describes a concentrated rotation. Historically, that degree of concentration precedes positioning exhaustion.
Record equity prices do not exist in a vacuum. The macro backdrop against which they are being set tells a less comfortable story.
Consumer price inflation sits at approximately 4% annualised as of May 2026, with producer price inflation running hotter at approximately 6% as of April 2026. PPI at that level implies potential pass-through risk to consumer prices in coming quarters. Hartnett’s projection, attributed to BofA, warns that sustained monthly price pressure could push CPI above 5% by the November midterms.
U.S. PPI data for April 2026 recorded a 1.4% monthly surge and a 6% annual jump, the largest gain since early 2022, providing independent corroboration of the pass-through risk that underpins Hartnett’s CPI acceleration projection.
Historical data compiled by BofA shows the S&P 500 has averaged a negative 4% return in the three months following CPI crossing 4%, and negative 7% over the subsequent six months.
The Federal Reserve has held the funds rate at 5.25-5.50% with no cuts expected in 2026. Elevated forward price-to-earnings multiples on U.S. large-cap equities carry an implicit compression risk if rates remain at this level and earnings growth decelerates. Q1 2026 GDP growth, revised to 1.6% annualised, already sits below trend. Unemployment, at 3.9%, remains near full employment but offers limited room for further labour market tightening to support consumer spending.
The April 2026 FOMC statement confirmed the Committee’s decision to hold rates steady, citing persistent inflation and the need to maintain restrictive policy until price stability is durably restored, a stance that carries direct implications for the multiple compression risk facing elevated U.S. large-cap valuations.
| Indicator | Current reading | Date | Equity implication |
|---|---|---|---|
| CPI (annualised) | ~4% | May 2026 | Above target; historical drag on equities |
| PPI | ~6% | April 2026 | Pass-through risk to CPI |
| Q1 GDP growth | 1.6% annualised | Q1 2026 | Below trend; growth deceleration |
| Unemployment | 3.9% | April 2026 | Near full employment; limited upside buffer |
| Fed funds rate | 5.25-5.50% | May 2026 | No cuts expected; multiple compression risk |
The configuration is unusual. Record equity prices coexisting with above-target inflation, a restrictive policy rate, and below-trend growth is precisely the environment where Hartnett’s technical and sentiment signals find their fundamental grounding.
The inflation impact on equity sectors is not uniform: higher-for-longer rates mechanistically compress valuations across the broad index while simultaneously insulating AI infrastructure spending by hyperscalers whose capital expenditure commitments are largely contracted and rate-insensitive in the near term.
A contrarian warning carries weight only if it reckons with what the other side is right about. The bullish case for U.S. equities in mid-2026 rests on genuine substance.
AI-driven revenue acceleration, particularly at companies like Nvidia, has provided fundamental support for elevated semiconductor and technology valuations. Morningstar’s fair value methodology places U.S. large-cap equities approximately 4.5% undervalued relative to analyst fair value estimates as of mid-2026, a finding that suggests earnings growth has partially kept pace with price appreciation even at record index levels.
The mainstream strategist consensus accepts elevated valuations as “high but justified,” anchored by four pillars:
There is a further paradox within BofA’s own data. The April 2026 investor survey showing maximum 11-month bearishness was framed by CNBC as a contrarian buy signal at the time. That is the same contrarian logic Hartnett now inverts: the bearishness has capitulated, so the signal flips. Whether that inversion is analytically sound or selectively applied is precisely what makes this a debate rather than a settled call.
The contrarian buy signal logic applies symmetrically in reverse: the same framework that made April’s record-low consumer confidence a potential bullish indicator becomes a near-term risk when sentiment reverses sharply, as the current capitulation into equities appears to be doing.
Warren Buffett’s elevated cash position at Berkshire Hathaway in 2026 serves as an implicit broad caution signal, though Buffett has not publicly endorsed the specific framework Hartnett employs.
No single indicator in Hartnett’s framework would, on its own, justify a positioning shift. The convergence is what sharpens the signal.
A SOX overextension not seen since the dot-com era. A Bull & Bear indicator reportedly climbing toward its sell threshold. Record capital flows concentrated in U.S. equities and technology. A macro backdrop of above-target inflation with below-trend growth. Each strand points in the same direction, even as the bullish counterarguments, earnings resilience, undervaluation relative to fair value, full employment, remain analytically legitimate.
Hartnett’s thesis is best understood as a risk management prompt rather than a prediction. Trimming exposure into strength during a catalyst-dense window is not the same as calling a market top. Investors can act on the signal without needing certainty about its outcome.
Three variables will determine whether the June window validates or undermines the thesis:
The April survey evidence, which actually showed bearishness rather than extreme bullishness, means the capitulation thesis remains a developing process rather than a confirmed extreme. That distinction should calibrate the proportionality of any response.
Record equity prices, technically overstretched semiconductors, and a sentiment gauge approaching extremes exist alongside genuine earnings growth, near-full employment, and a consensus that still leans bullish. The analytical tension is real, and it does not resolve neatly.
Hartnett has named early June 2026 as the window to act. His framing, a capitulation trade approaching exhaustion, is time-bounded and catalyst-specific rather than permanent. Whether or not his timing proves precise, the cluster of signals he cites rewards a deliberate positioning review.
Passive acceptance of the current risk level is itself a positioning decision. The evidence assembled here suggests it should be a conscious one.
This article is for informational purposes only and should not be considered financial advice. Investors should conduct their own research and consult with financial professionals before making investment decisions. Past performance does not guarantee future results. Financial projections are subject to market conditions and various risk factors.
The BofA Bull and Bear Indicator is a composite sentiment gauge running from 0 to 8 that aggregates positioning data, fund flows, and survey sentiment. Readings near 0 are contrarian buy signals, while a reading of 8.0 triggers a formal contrarian sell signal, indicating optimism has overshot fundamentals.
A deviation of 63% above the 200-day moving average signals that recent buying has dramatically outpaced the longer-term trend, concentrating speculative positioning in a narrow window. Bank of America has compared this level of technical overextension to the Nasdaq's condition at the dot-com bubble peak.
Early June 2026 contains a dense cluster of macro and political catalysts including an OPEC meeting, the G7 summit, the FIFA World Cup opening, Trump's 80th birthday, and the first FOMC meeting under incoming Fed Chair Kevin Warsh. BofA's Hartnett argues this convergence of volatility triggers creates an ideal window for tactical risk trimming.
U.S. equities face consumer price inflation of approximately 4% annualised, producer price inflation of approximately 6%, below-trend GDP growth of 1.6% in Q1 2026, and a Federal Reserve funds rate held at 5.25-5.50% with no cuts expected. BofA historical data shows the S&P 500 has averaged a negative 4% return in the three months following CPI crossing 4%.
BofA reported $20.5 billion in weekly equity inflows and $5.4 billion into technology funds, the largest tech allocation since February 2026, while Chinese equities saw $22.2 billion in outflows and crypto saw $1.3 billion in outflows. This concentrated rotation into U.S. equities and technology, rather than broad risk-on positioning, is historically associated with positioning exhaustion.