
How NAB’s ROE Beats Peers Despite a Below-Average Margin
11 mins ago

Brent crude crossed $108 per barrel on 15 May 2026, the highest level in over a decade, as the world’s most important energy chokepoint remained effectively sealed and peace talks collapsed for the second time in a month. The U.S.-Iran standoff has moved well beyond a regional security story. The Strait of Hormuz, through which roughly 20% of global oil supply transits daily, is now the fulcrum of a crisis that is repricing energy, reshaping equity portfolios, and drawing in the world’s two largest economies.
What follows is an analysis of what the closure means for energy supply, why equity markets from Seoul to Amsterdam are absorbing the shock, and how investors should think about positioning in a market where geopolitical risk has become a persistent structural factor rather than a transient spike.
The Strait of Hormuz is a narrow passage between Iran and Oman, roughly 33 kilometres wide at its narrowest navigable point, connecting the Persian Gulf to the Gulf of Oman and the Arabian Sea. Under normal conditions, it carries a volume of energy that no other route on earth comes close to matching.
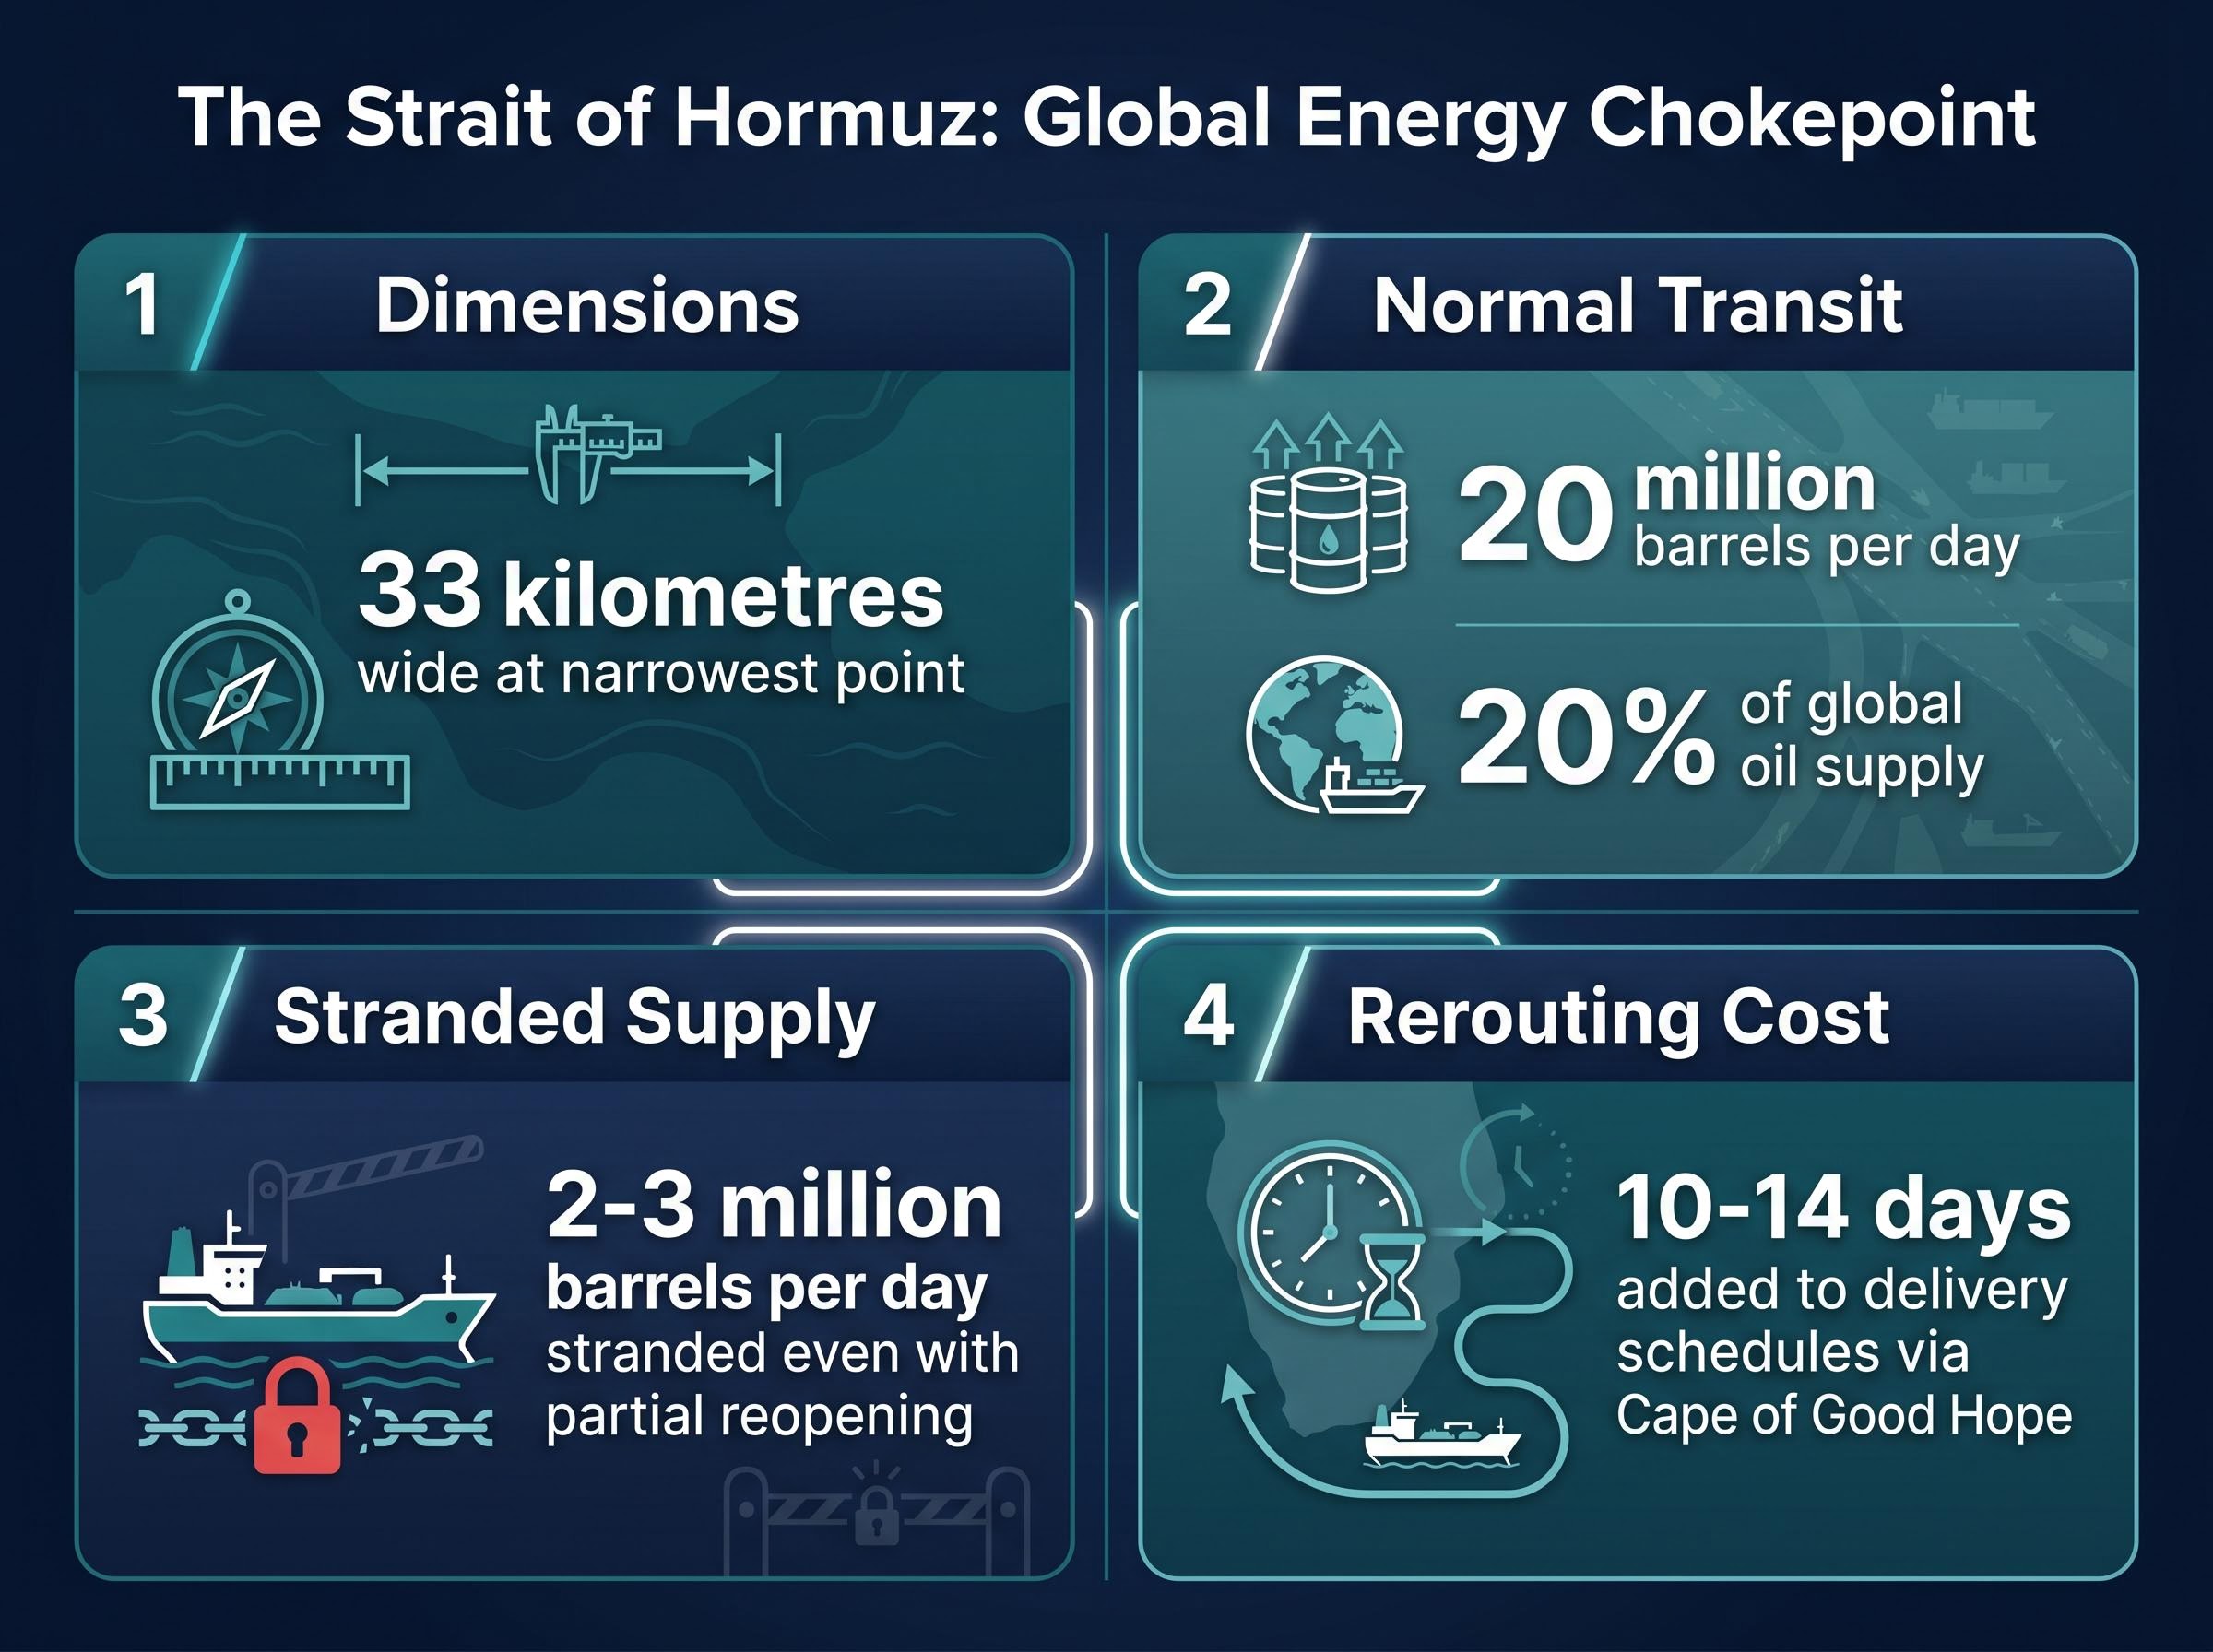
The IEA and S&P Global Commodity Insights have consistently characterised Hormuz as the world’s most important energy chokepoint. Even a partial reopening with military escort would leave an estimated 2-3 million barrels per day effectively stranded, according to S&P Global Commodity Insights.
War-risk insurance withdrawal has been a more decisive closure mechanism than any military blockade: the near-total exit of commercial underwriters from Gulf tanker coverage has effectively sealed the Strait to standard commercial traffic even during periods when physical passage was technically possible, a dynamic that explains why the IEA projects a two-year supply chain recovery timeline even under a best-case resolution scenario.
The EIA World Oil Transit Chokepoints report confirms that oil flows through the Strait averaged 20.9 million barrels per day in the first half of 2025, representing approximately one-quarter of all globally traded maritime oil and underscoring why even a partial, escorted reopening leaves an outsized share of world supply in limbo.
Overland alternatives exist, including Saudi Arabia’s East-West pipeline and the UAE’s ADPC line, but their combined capacity falls far short of the 20 million b/d that normally flows through the Strait. Extended sea rerouting via the Cape of Good Hope adds 10-14 days to delivery schedules and meaningfully higher freight and insurance costs, effectively shrinking the available global supply buffer in real time.
The result is a disruption that cannot be engineered around quickly. Investors who treat this as a routine supply shock are likely to misread both the duration and the magnitude of the price signal it carries.
Brent traded near $74 per barrel before the disruption escalated. As of 15 May 2026, it stood at approximately $108.13, with WTI at approximately $101.56, according to Trading Economics and FRED data. That represents an increase of roughly 46%, the product of compounding shocks rather than a single event.
The surge did not arrive in one move. Early escalation lifted prices through $90, a brief pullback toward $91 in mid-April offered temporary relief, and the collapse of a second round of mediated talks in May drove the latest leg higher. Each failed diplomatic attempt tightened the market’s conviction that this disruption would persist.
S&P Global Commodity Insights characterised the event as “the most severe disruption to Gulf energy flows since the 1980s.”
Three of the most widely cited energy research groups have published price scenarios, each with conditions attached that investors need to hold simultaneously rather than anchoring to a single target.
| Source | Base Case (Brent) | Bear Case (Brent) | Key Condition |
|---|---|---|---|
| Goldman Sachs (6 May 2026) | $110-$120/bbl | Above $130/bbl | One-quarter disruption vs 6+ months with minimal mitigation |
| S&P Global (10 May 2026) | $95-$115/bbl | Spikes into the $120s | Disruption stretches into summer; limited convoy resumption in late Q3 |
| Wood Mackenzie (9 May 2026) | $95-$105/bbl | Above $120/bbl | Partial disruption into Q3 vs prolonged closure with escalation |
OPEC+ has announced a targeted 2 million b/d production increase beginning June 2026, according to Reuters. The additional output matters at the margin but falls well short of closing the structural supply gap left by the Strait’s effective closure.
The transmission mechanism from a Gulf energy crisis to semiconductor equities runs through three distinct channels: higher energy input costs compressing manufacturing margins, broad risk-off rotation away from cyclicals, and supply chain anxiety amplifying sector-specific vulnerabilities. Each is visible in the data from 15 May 2026.
The U.S.-China summit produced a joint navigation statement, but analysts had already mapped an asymmetric risk profile for chip stocks heading into the meeting: partial de-escalation offered only 8-12% upside while a hardening scenario projected 10-20% downside for the SOXX and SMH, an imbalance that partly explains why the indiscriminate selling on 15 May was so difficult to defend against in real time.
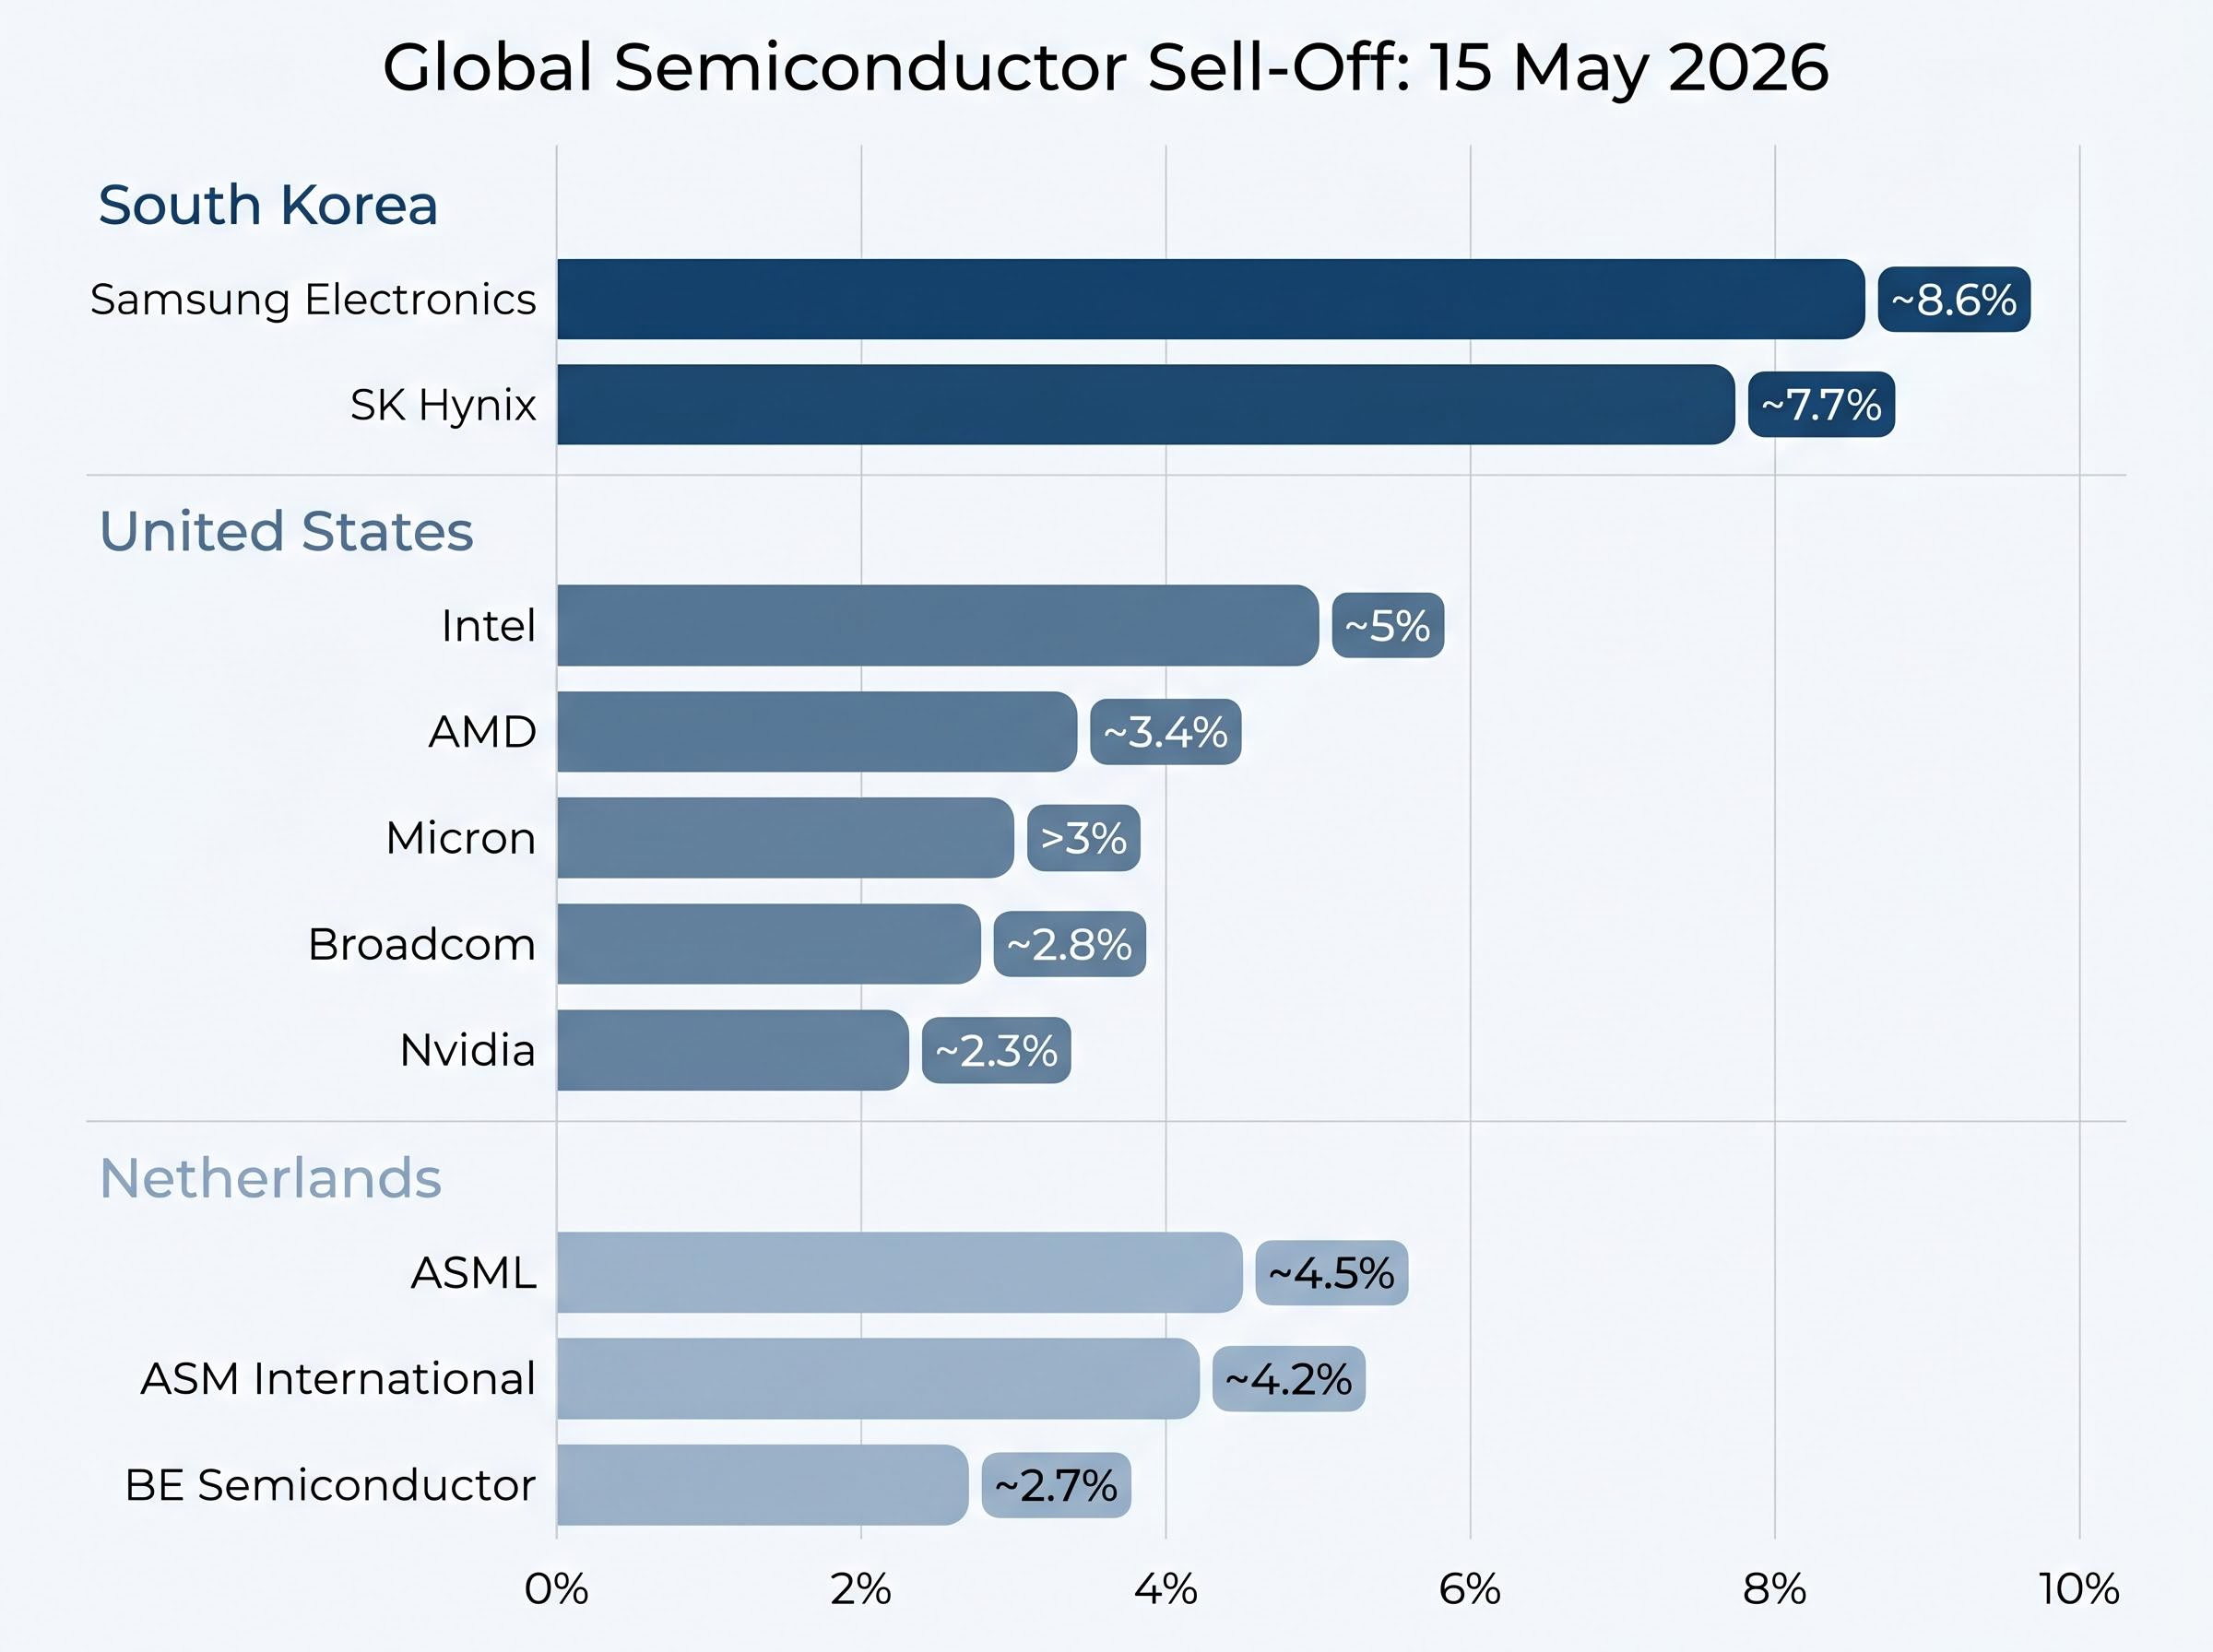
South Korea, a major energy importer, absorbed the sharpest blow. The KOSPI fell more than 6% on the day, dragged lower by its two largest constituents. Samsung Electronics dropped approximately 8.6%, compounded by a confirmed 18-day strike beginning 21 May. SK Hynix fell approximately 7.7%. According to Manulife Investment Management, Samsung and SK Hynix together now represent a record 42.2% of KOSPI weighting, meaning their declines exert outsized index-level force.
| Company / Index | Geography | Decline (%) | Compounding Factor |
|---|---|---|---|
| KOSPI | South Korea | More than 6% | Heavy energy import dependence |
| Samsung Electronics | South Korea | ~8.6% | 18-day strike from 21 May |
| SK Hynix | South Korea | ~7.7% | Record 42.2% combined KOSPI weight |
| Intel | United States | ~5% | Broad risk-off rotation |
| AMD | United States | ~3.4% | Broad risk-off rotation |
| Micron | United States | More than 3% | Memory sector sentiment |
| Nvidia | United States | ~2.3% | Broad risk-off rotation |
| Broadcom | United States | ~2.8% | Broad risk-off rotation |
| ASML | Netherlands | ~4.5% | European energy cost sensitivity |
| ASM International | Netherlands | ~4.2% | European energy cost sensitivity |
| BE Semiconductor | Netherlands | ~2.7% | European energy cost sensitivity |
The selling across U.S. and European names has been broad. In premarket trading, Micron fell more than 3%, Nvidia declined approximately 2.3%, and Broadcom dropped roughly 2.8%. In Amsterdam, ASML lost approximately 4.5% and ASM International fell approximately 4.2%.
The indiscriminate nature of the declines is notable. These are fundamentally different businesses: leading-edge AI chipmakers, mature-node manufacturers, and equipment suppliers. Their demand drivers remain primarily tied to AI and data-centre buildout, not energy prices directly. J.P. Morgan and Bloomberg strategists have recommended buying quality on weakness in leading U.S. and European names while maintaining caution on high-beta hardware exposure.
The most intractable obstacle to a resolution sits at the centre of the standoff: Iran’s nuclear programme. Mediated talks in Oman and subsequently Qatar collapsed over Iran’s refusal to halt or roll back enrichment activities. Iranian officials have publicly framed the Strait closure as a defensive response and attached three conditions to de-escalation:
The gap between these demands and Washington’s position remains wide. A vessel seizure near the UAE coast, attributed to the IRGC navy in early May, marked the sharpest escalation signal since the initial strikes. The U.S. condemned the incident as “piracy” and called for the crew’s immediate release.
The U.S.-China summit in Beijing produced a joint statement affirming support for freedom of navigation and calling for immediate de-escalation. Both outcomes were welcomed by markets. Neither addressed chip export controls, and the statement carries no enforcement mechanism for reopening the Strait. President Trump’s public remarks following the summit signalled diminishing patience with Tehran.
Eurasia Group warned in an early May client note: “Market participants should treat this as a structural risk premium story rather than a transitory spike.”
The Oxford Institute for Energy Studies echoed that assessment, noting that a “multi-month disruption is now a distinct possibility” and that even emergency releases cannot fully substitute Hormuz volumes.
The positioning guidance from three of the world’s largest allocators reflects a shared underlying conviction: this is not a two-week spike to wait out.
Bank of America’s equity strategy team, writing in the first half of May, argued that the Hormuz closure has shifted oil from a cyclical trade to a geopolitical risk premium trade. The firm recommended overweighting energy equities, particularly integrated oil majors and North American exploration and production companies with low lifting costs, alongside selective refiner exposure.
J.P. Morgan’s cross-asset strategy group recommended maintaining or modestly increasing exposure to quality energy producers outside the Gulf (U.S., Canada, Brazil) while avoiding concentrated exposure to Gulf-centric shipping and petrochemical names. The firm also suggested using options to hedge downside tail risk in broader equity indices.
BlackRock Investment Institute stated in May market commentary: “Geopolitics now plays a more persistent role in inflation and risk premia.”
BlackRock recommended overweighting energy and natural resource equities as structural hedges and considering infrastructure and midstream assets with stable cash flows.
The consensus positioning themes across these allocators:
For investors wanting to move from the positioning themes outlined here to a standing portfolio framework, our dedicated guide to geopolitical investing strategy covers the specific gold allocation ranges recommended by BlackRock and Vanguard, the defence sector procurement pipeline created by NATO’s 5% GDP spending target, and a five-component resilience checklist designed to function before, during, and after geopolitical shocks.
Gold stood at approximately $2,450 per ounce as of 15 May 2026, up roughly 15% since early 2026, according to Trading Economics. The U.S. 10-year Treasury yield sat at approximately 4.25%, down from roughly 4.50% before the disruption, reflecting safe-haven inflows.
The tension in fixed income is genuine. Safe-haven demand is pulling Treasury yields lower, but sustained oil above $100 creates inflation pressure that would normally push yields higher. This creates uncertainty about duration positioning that has not yet resolved. Gold addresses the tension more cleanly, benefiting simultaneously from the geopolitical risk bid and inflation hedging demand.
The forward signals point to duration, not quick resolution. The nuclear programme deadlock remains the binding constraint. The IRGC vessel seizure demonstrated that military posturing has not receded with the suspension of U.S. strikes. And the analysts cited throughout this analysis are not describing worst-case scenarios; they are describing base cases.
Three signals warrant close monitoring in the weeks ahead:
Wood Mackenzie’s base case extends the effective disruption into Q3 2026, with Brent averaging $95-$105 per barrel during the period. S&P Global projects only limited convoy-based passages resuming in late Q3. Eurasia Group assigns a material probability that reduced traffic persists through the U.S. election cycle, with full normalisation unlikely without a nuclear framework agreement.
The supply normalisation timeline now extends well beyond the current crisis window, with Saudi Aramco CEO Amin Nasser warning that full recovery could stretch into 2027 and Goldman Sachs and Bank of America both pushing their first Fed rate cut projections out to December 2026 and July 2027 respectively, a chain of consequences that the current oil price alone does not fully capture.
IEEFA noted in May commentary that sustained disruption through year-end would “cement structurally higher risk premia in oil benchmarks.”
Geopolitical risk has moved from event risk, something to hedge during a spike, to a persistent component of the risk premium that needs to be reflected in baseline portfolio construction. Investors who have not yet adjusted their energy, equity, and safe-haven allocations are operating with a framework built for a pre-Hormuz market environment.
This article is for informational purposes only and should not be considered financial advice. Investors should conduct their own research and consult with financial professionals before making investment decisions. Forward-looking statements, analyst forecasts, and price projections cited in this analysis are subject to change based on market developments and geopolitical conditions. Past performance does not guarantee future results.
Geopolitical risk premium is the additional price investors pay for oil above its fundamental supply-and-demand value, reflecting uncertainty caused by conflicts or disruptions to key supply routes. In the current Hormuz crisis, analysts at Bank of America and Eurasia Group describe this premium as structural rather than temporary, meaning it is unlikely to disappear quickly even if tensions ease.
The Strait of Hormuz is a narrow 33-kilometre passage between Iran and Oman that carries approximately 20 million barrels of crude oil per day, representing roughly 20% of global oil supply. No overland or sea alternative can quickly substitute for that volume, and war-risk insurance withdrawals have effectively sealed the route to standard commercial traffic even when physical passage was technically possible.
Chip stocks from South Korea to the Netherlands have sold off sharply because higher energy costs compress manufacturing margins, broad risk-off sentiment drives rotation away from cyclicals, and supply chain anxiety amplifies sector vulnerabilities. Samsung Electronics fell approximately 8.6%, SK Hynix dropped around 7.7%, and ASML declined roughly 4.5% on 15 May 2026 alone.
Bank of America, J.P. Morgan, and BlackRock all recommend overweighting integrated energy majors, North American exploration and production companies, and gold as structural hedges, while reducing exposure to airlines, energy-intensive cyclicals, and Gulf-centric shipping names. J.P. Morgan also suggests using index options to hedge downside tail risk in broader equity portfolios.
Wood Mackenzie's base case extends the effective disruption into Q3 2026, S&P Global projects only limited convoy-based passages resuming in late Q3, and Saudi Aramco CEO Amin Nasser has warned that full supply chain recovery could stretch into 2027. The IEA has projected a two-year supply chain recovery timeline even under a best-case resolution scenario.


