VAS vs VHY: Why the Lower-Yield ETF Wins in Retirement
2 hrs ago

Washington H. Soul Pattinson has paid dividends every year since 1903, a streak that spans two world wars, a global pandemic, and more than a dozen recessions. Yet the headline trailing yield of approximately 2.43% as of 13 May 2026 does not, on its own, answer the question most investors are actually asking: is the stock cheap, fairly priced, or expensive relative to its own history?
For Australian investors assessing blue-chip diversified investment companies, dividend yield is a readily available and intuitively appealing valuation signal. Applying it correctly to a company like WHSP (ASX: SOL) requires understanding how yield-versus-history comparisons work, why the franking credit gross-up changes the maths, and why yield is only one lens among several. This article walks through the dividend yield valuation method using WHSP as a live, worked case study, explains the specific adjustments Australian investors must make for franking credits, and maps out what other approaches belong alongside yield in any serious assessment of a diversified holding company.
WHSP is not a bank, a retailer, or even a standard listed investment company. Founded in 1903 and listed on the ASX under the code SOL, it operates as a diversified investment holding company. Its value derives not from a single revenue stream but from a portfolio of underlying stakes spread across sectors, each with its own earnings profile and cycle.
That distinction matters before any valuation calculation begins. The tools that work for an operating business, where revenue and margin drive share price, do not map cleanly onto a company whose worth is the sum of what it owns.
The portfolio spans four broad categories:
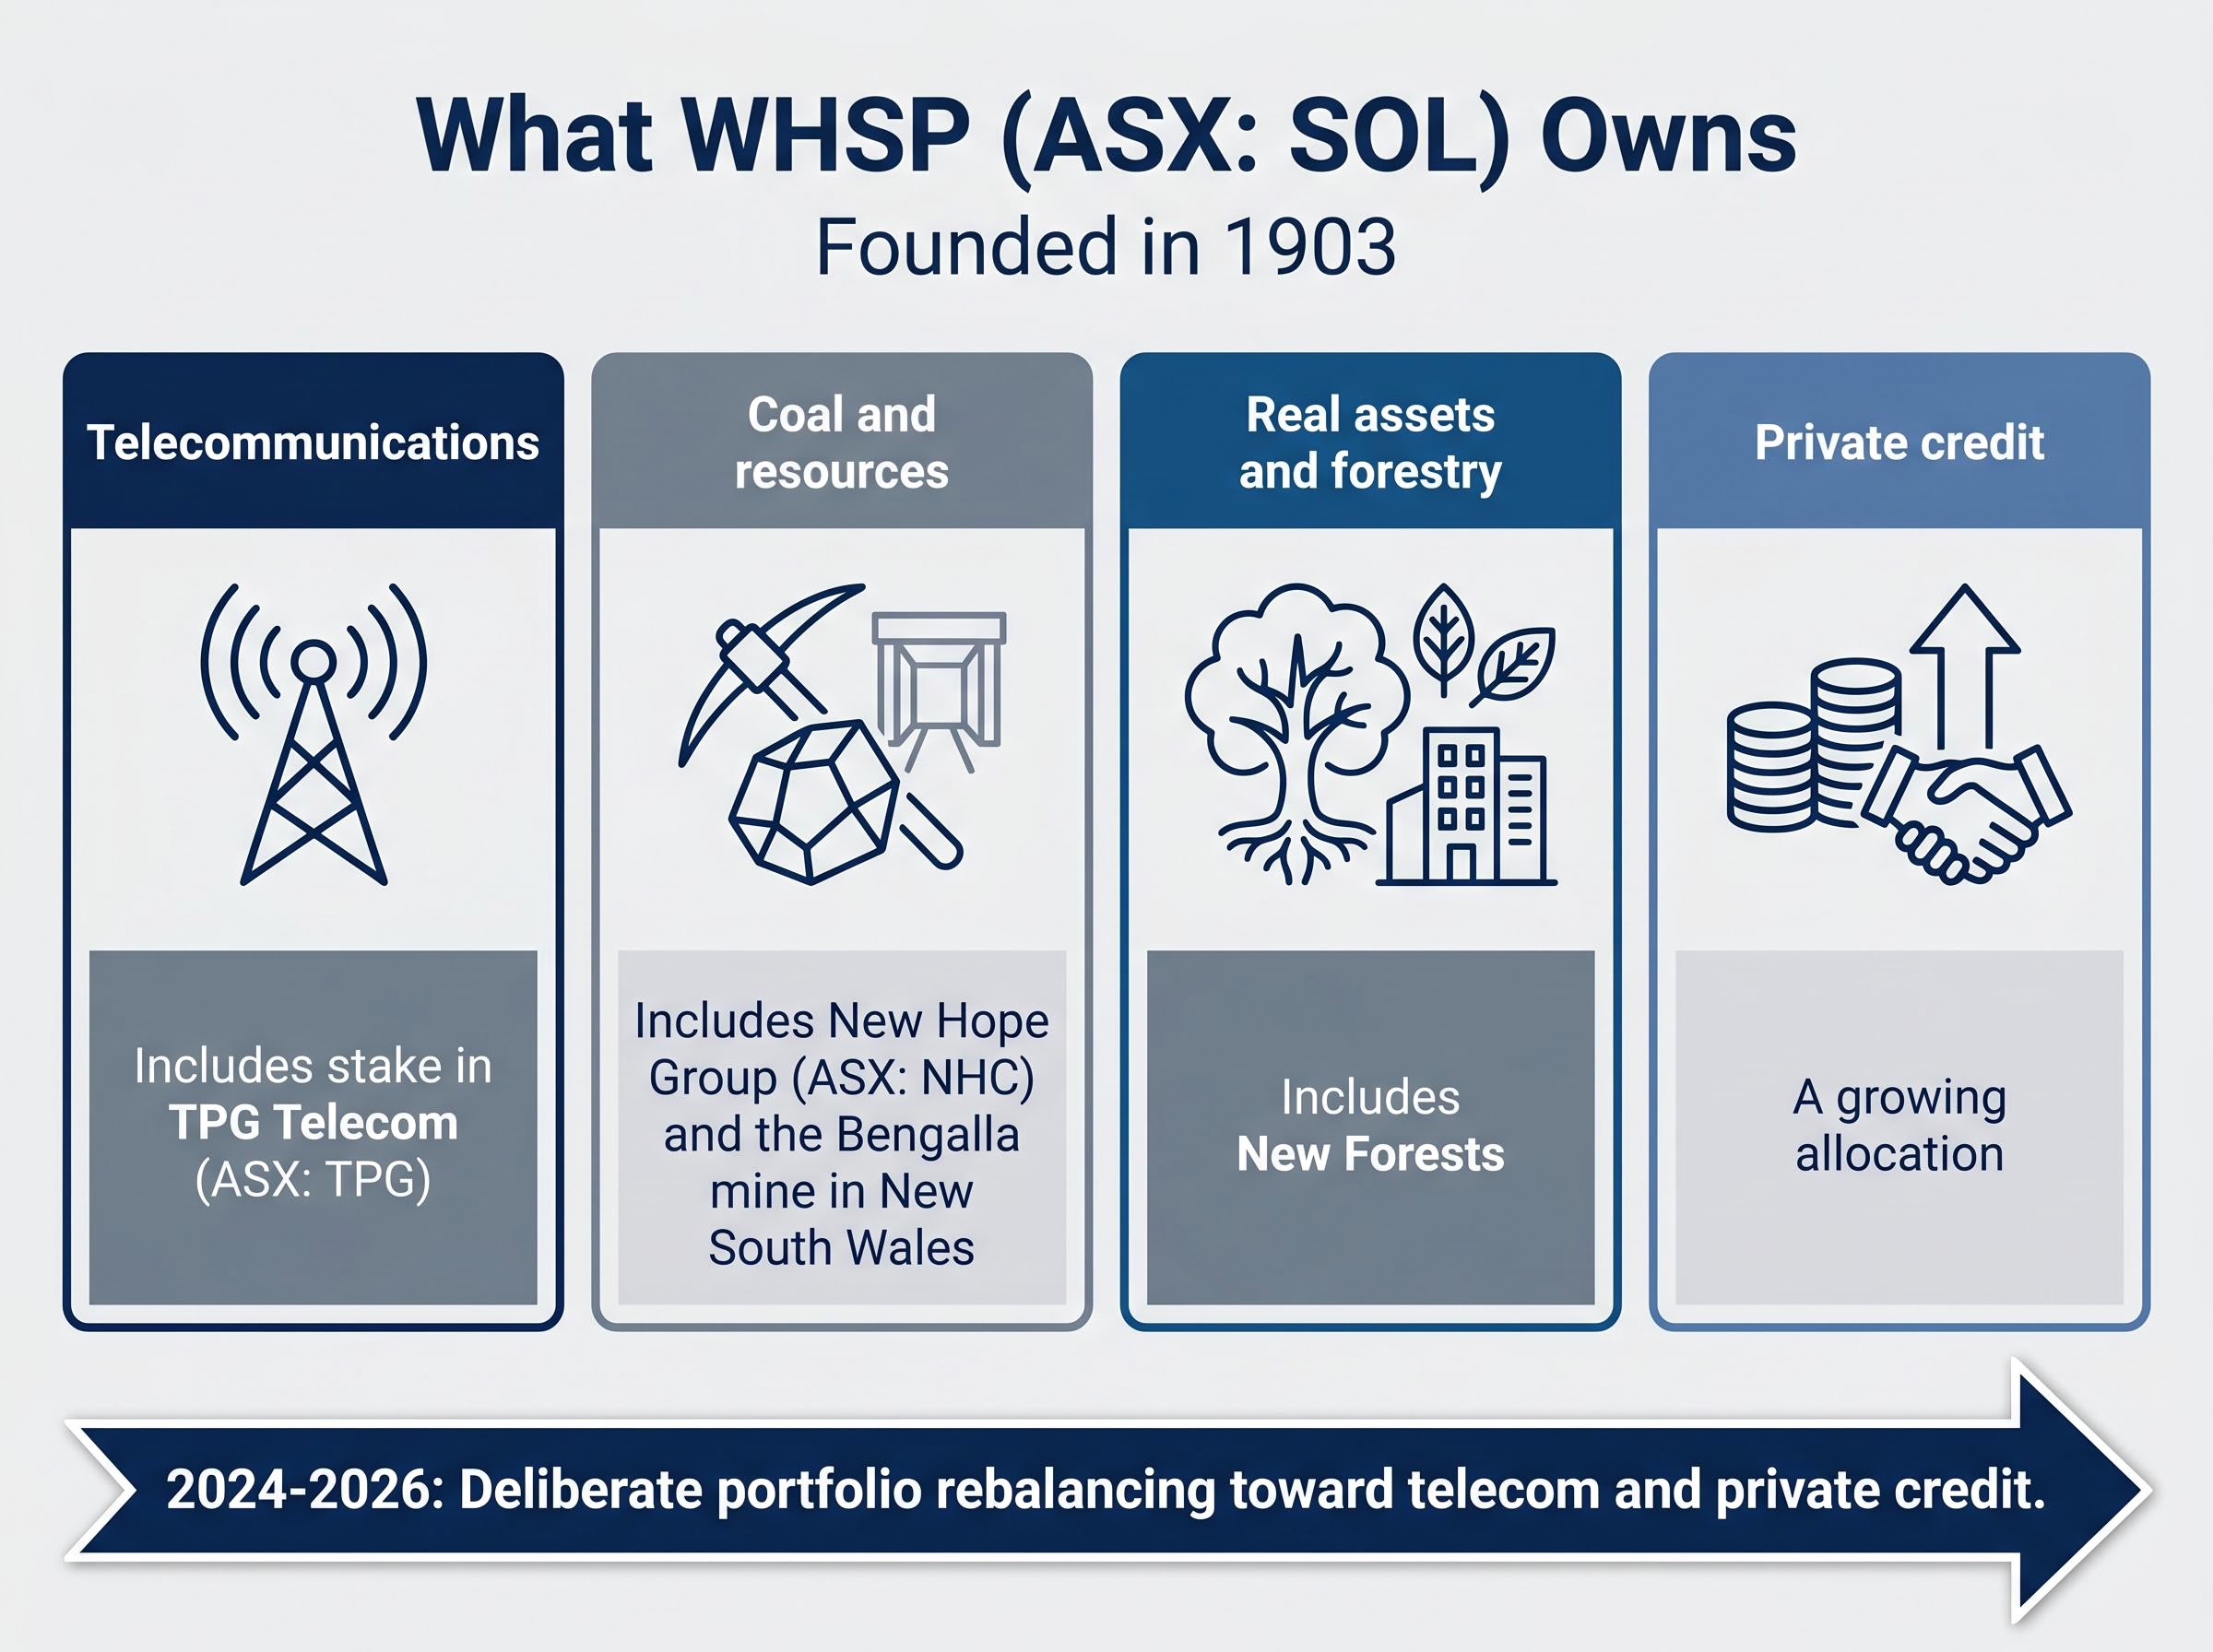
Commentary from 2024-2026 notes a deliberate rebalancing of the portfolio toward telecom and private credit, reducing the weighting of coal-driven earnings. Specific allocation percentages are disclosed in WHSP’s annual report and portfolio updates, and readers should consult those primary sources for the most current breakdown.
As of 12 May 2026, the share price sat at approximately $44.00, trading 22.8% above its 52-week low.
Dividend yield is one of the most accessible entry points for evaluating income stocks. The formula is straightforward:
Trailing Dividend Yield = (Trailing 12-Month Dividends Per Share ÷ Current Share Price) × 100
The yield is not a fixed characteristic of a company. It moves every day as the share price moves. When price falls and dividends hold steady, yield rises. When price rises and dividends stay flat, yield compresses. That mechanical relationship is what makes yield useful as a relative valuation signal.
The yield-versus-history framework follows from this logic. If a stock’s current yield is above its historical average, it implies price has fallen relative to the dividend stream, a potential undervaluation signal. If yield sits below average, price has risen faster than dividends, which may suggest the stock has become expensive relative to its own norms. The comparison is always to the stock’s own history, not to an absolute threshold.
Applying this to WHSP using verified dividend data:
| Metric | Value |
|---|---|
| Trailing 12-month dividends per share | $1.07 (0.480 ex Apr 2026 + 0.590 ex Aug 2025) |
| Current share price | ~$44.00 |
| Calculated trailing yield | ~2.43% |
| Five-year average yield | 2.44% |
The current yield and the five-year average are nearly identical. That proximity is itself a finding, one explored in detail below.
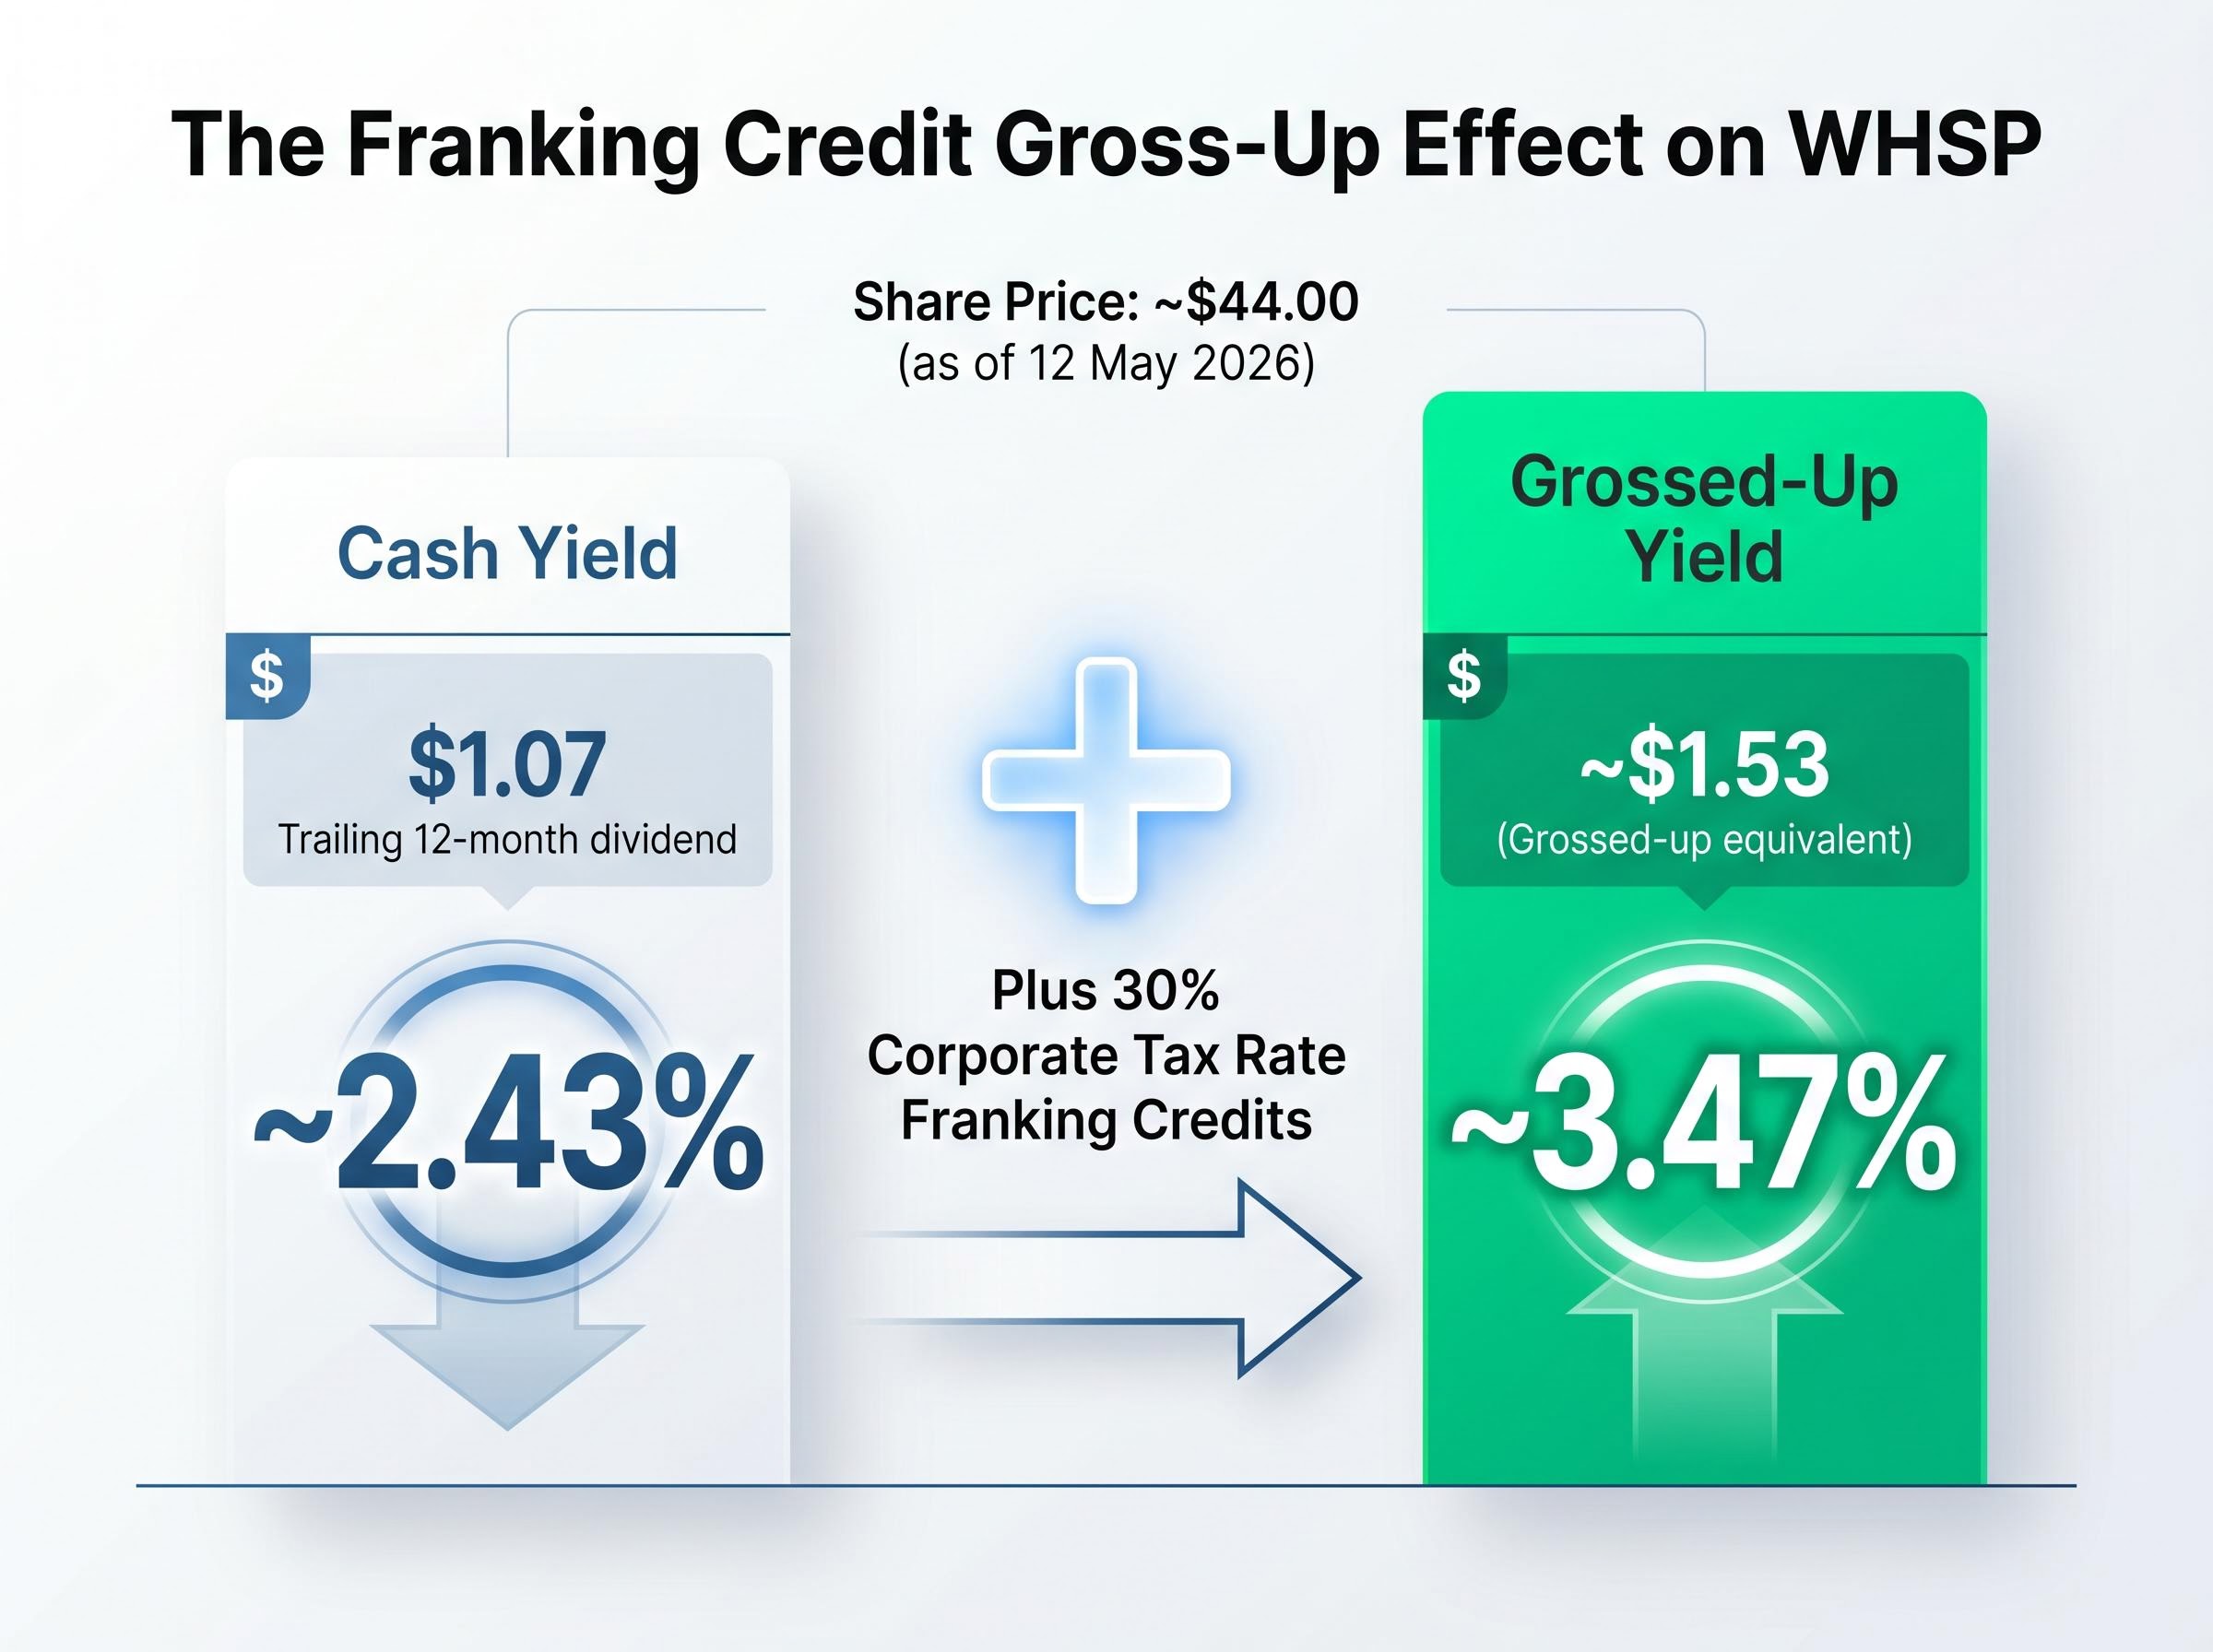
The 2.43% trailing yield calculated above is the cash yield. For Australian resident investors, it understates the economic value of WHSP’s dividends because all WHSP dividends are fully franked.
Franking (imputation) credits represent company tax already paid on the profits from which dividends are drawn. When an investor receives a fully franked dividend, the Australian Tax Office treats them as having already paid company tax on that income. The effect is that the dividend’s pre-tax value is higher than the cash received.
The franking credit calculation uses the corporate tax rate as the basis, with the standard approach multiplying the cash dividend by 30 and dividing by 70, producing the credit that represents tax the company has already remitted to the ATO on the investor’s behalf.
The mechanics work in three steps:
Source: Australian Taxation Office guidelines on franking credits: https://www.ato.gov.au/individuals-and-families/investments-and-assets/dividend-and-share-income/franking-credits-on-dividends
The value of franking credits varies by investor type. For individuals on the top marginal tax rate, franking credits partially offset the personal tax owed on dividend income. For self-managed superannuation funds (SMSFs) in the accumulation phase, taxed at 15%, the benefit is more pronounced because the credits offset most of the tax liability. For SMSFs in the pension phase, taxed at 0%, the full franking credit is refunded in cash, making the grossed-up yield the effective return.
The ATO refund of franking credits for individuals guidance confirms that when a shareholder’s basic income tax liability is less than their franking credits, the excess is returned in cash, which is precisely why SMSFs in pension phase treat the grossed-up yield as their effective economic return rather than the cash dividend alone.
The May 2026 Federal Budget scrapped the 50% capital gains tax discount (effective 1 July 2027), potentially reinforcing the relative appeal of franked dividend income for investors who previously focused on capital gain realisation.
Australian investors who compare WHSP’s headline yield to bank deposit rates or unfranked distributions are comparing different things. The grossed-up yield is the economically correct comparison point.
This section discusses tax concepts in general terms. Individual circumstances vary, and readers should consult a registered tax adviser for advice specific to their situation.
The gap between WHSP’s current trailing yield and its five-year average is approximately 0.01 percentage points. For practical purposes, the two figures are at parity.
What does a neutral signal actually mean? The yield-versus-history framework produces three possible readings:
| Yield Scenario | What It Implies | WHSP Status |
|---|---|---|
| Yield well above 5-year average | Potential undervaluation signal | Not current |
| Yield near 5-year average | Broadly fair value on yield basis | Current position |
| Yield well below 5-year average | Potential overvaluation signal | Not current |
WHSP sits squarely in the middle row. The stock is trading near its historically normal yield level, neither flagging obvious undervaluation nor clear overvaluation on this metric alone.
Context adds texture. The share price has recovered 22.8% from its 52-week low. At that low, the yield would have been materially higher, meaning investors who bought at the trough captured a more attractive yield entry than today’s buyers. The current price has compressed yield back toward its long-run norm.
Grossed-up yield comparisons across Australian income stocks often produce rankings that look very different from raw cash yield screens, with fully franked bank shares and diversified holding companies shifting position materially once the imputation credit component is included alongside the cash dividend.
A neutral yield signal is itself informative. It sets a reasonable baseline and directs investor attention to other valuation tools that may offer a clearer reading.
The honest conclusion from this data is ambiguity. The yield method does not always produce a clean buy or sell flag, and recognising that is part of disciplined valuation thinking.
Yield captures the relationship between price and the cash returned to shareholders. For a diversified holding company, that relationship can be misleading. WHSP’s dividends are funded by distributions from underlying holdings, meaning yield can be maintained even if portfolio value is eroding. A stable dividend does not necessarily mean stable intrinsic value.
Franking-adjusted valuation models often produce fair value estimates that diverge substantially from unfranked calculations; a fully franked dividend stock assessed on a cash yield basis alone can appear overvalued to an investor who cannot utilise the credits while appearing genuinely undervalued to an SMSF trustee in pension phase drawing a full cash refund from the ATO.
Australian analysts who cover listed investment companies use a broader toolkit:
WHSP also retains a structural advantage that passive alternatives cannot replicate. Australian ETF inflows grew substantially through 2025, eroding LIC market share for vanilla equity exposure. WHSP’s access to illiquid assets, including private credit and forestry through New Forests, represents a portfolio characteristic that cannot be packaged into an ETF structure.
Net tangible assets (NTA) per share represents total portfolio assets minus liabilities, divided by shares on issue. When the share price trades below NTA, the stock is at a discount, a potential buying signal. When it trades above NTA, it is at a premium.
WHSP has historically traded at varying discounts and premiums depending on market conditions. Readers should source the latest NTA per share from WHSP’s ASX announcements or annual report for the most current comparison. SOTP analysis complements this by valuing individual holdings using sector-appropriate multiples (for instance, EV/EBITDA for TPG Telecom or P/E for New Hope Group) and aggregating.
Over 120 years of continuous dividends earns attention. It does not, by itself, answer the valuation question.
The dividend yield comparison is a useful first filter: WHSP’s current yield of approximately 2.43% sits at parity with its five-year average of 2.44%, suggesting broadly neutral pricing on a yield basis. The franking credit gross-up is non-negotiable for Australian investors; the grossed-up yield of roughly 3.47% is the economically correct figure against which to compare alternative income sources. The May 2026 CGT discount change may reinforce the relative appeal of franked income for some investor cohorts from 1 July 2027 onward.
The complete picture requires additional lenses. A practical investor checklist for WHSP:
WHSP’s structural strengths are real: a long track record, fully franked dividends, and portfolio diversification into private credit and real assets. The uncertainties are equally real: portfolio composition is shifting, coal exposure carries environmental and regulatory risk, and TPG Telecom faces competitive headwinds. Specific figures including FY25 NPAT, NAV per share, and detailed portfolio weightings should be sourced from WHSP’s primary ASX filings before making investment decisions.
Portfolio rebalancing considerations become particularly relevant for investors who built WHSP positions during the 2022-2025 equity run, since a 22.8% recovery from the 52-week low implies the position may now carry a meaningfully different weighting within a diversified income portfolio than when it was originally sized.
This article is for informational purposes only and should not be considered financial advice. Investors should conduct their own research and consult with financial professionals before making investment decisions. Past performance does not guarantee future results.
Dividend yield valuation compares a stock's current yield (annual dividends divided by share price) to its own historical average yield to signal whether a stock is cheap or expensive relative to its norms. When the current yield is above the historical average, it may indicate undervaluation; when below, it may suggest overvaluation.
Because WHSP dividends are fully franked, the cash yield of approximately 2.43% understates the true economic return for Australian resident investors. After applying the 30% corporate tax gross-up, the franking-adjusted yield rises to roughly 3.47%, which is the correct figure to use when comparing WHSP's income against unfranked alternatives.
When a stock's current yield sits at parity with its five-year average, the yield-versus-history framework signals broadly neutral pricing, meaning the stock is neither obviously undervalued nor clearly overvalued on a yield basis alone. For WHSP, the current yield of approximately 2.43% is nearly identical to its five-year average of 2.44%, placing it in this neutral zone.
A holding company's dividends are funded by distributions from its underlying portfolio, so a stable dividend can persist even if the portfolio's intrinsic value is eroding. Analysts therefore supplement yield analysis with NTA discount or premium comparisons, sum-of-the-parts valuations of individual holdings, and total shareholder return track records.
The May 2026 Federal Budget scrapped the 50% capital gains tax discount effective 1 July 2027, which may reinforce the relative attractiveness of franked dividend income for investors who previously emphasised capital gain realisation as a tax-efficient return strategy.