
How Wesfarmers Buys, Builds, and Exits to Create Value
3 hrs ago

National Australia Bank has shed more than 7% year-to-date in 2026, falling from a YTD high of $49.45 to $38.22 as of 12 May 2026. That kind of decline prompts a pointed question: is this a discount worth buying, or fair value correcting toward reality?
With NAB’s HY26 results now on the table (cash earnings of $3,588 million, announced 4 May 2026) and a fully franked interim dividend of $0.85 per share just declared, the conditions are ripe for a valuation stress-test using one of the most debated tools in equity analysis: the Dividend Discount Model. This piece walks through a DDM-based valuation of NAB step by step, explains how growth and risk rate assumptions move the output, and shows why franking credits can swing the fair value estimate by more than $15 per share for eligible Australian investors. The result is a clearer picture of where NAB sits relative to modelled fair value at current market prices.
The scale of NAB’s retreat demands context before it invites conclusions. At $38.22, the stock sits roughly 22% below its $49.45 YTD high, a correction steep enough to trigger value-hunting instincts.
$49.45 to $38.22: NAB has shed approximately 22% from its 2026 peak, making it one of the sharper pullbacks among Australia’s major banks this year.
Yet the headline -7.33% YTD figure does not tell a straightforward “oversold” story. NAB remains up 4.63% year-on-year, which means the 2025 rally simply handed back a portion of its gains. Three headwinds have driven the 2026 decline:
Before applying any valuation model, investors benefit from an honest read of what the price already reflects. A falling price is not automatically a signal of value; it may simply be the market repricing risk that was previously underweighted.
A rising yield can itself be a warning sign rather than an invitation: dividend traps occur when a falling share price inflates the headline yield while the market simultaneously prices in a payout cut, a dynamic directly relevant to any bank stock showing a steep YTD decline alongside sustained dividend commitments.
The Dividend Discount Model reduces a stock’s value to a single idea: a share is worth the present value of all future dividends it will pay. In its simplest form, the formula captures this in one line.
DDM Formula: P = D / (r – g), where P is the estimated fair value, D is the annual dividend, r is the required rate of return, and g is the expected long-term dividend growth rate.
Three characteristics make banks among the most DDM-amenable stocks on the ASX:
NAB has paid consistent fully franked dividends over multiple years, making it a natural candidate for this approach.
The DDM’s sensitivity lives in its denominator: r minus g. Small changes produce large swings in the output, which is why a range of assumptions is more honest than any single estimate.
Consider a $1.71 annual dividend. At a required return of 7% and a growth rate of 3%, the denominator is 4%, producing a fair value of $42.75. Shift the required return to 9% (holding growth at 3%), and the denominator widens to 6%, compressing the output to $28.50. A two-percentage-point change in one assumption moves the valuation by more than $14.
That sensitivity is why assumption choice, not the formula itself, is the analyst’s most consequential decision.
The same NAB model produces a range from $19.00 to $85.50 per share depending entirely on macro assumptions about growth and discount rates, a spread that makes the article’s sensitivity matrix conservative by comparison and underlines why the choice of r and g is not a technical detail but the core analytical judgment.
The CFA Institute discounted dividend valuation framework documents precisely this sensitivity, noting that the Gordon Growth Model’s output is highly elastic to small movements in the spread between the required return and the growth rate, which is why practitioners treat a range of assumptions as more defensible than a single point estimate.
NAB’s most recent full-year dividend totalled $1.69 per share, and the forward estimate (reflecting the $0.85 fully franked HY26 interim dividend declared with an ex-date of 7 May 2026) sits at approximately $1.71 per share. The forward figure serves as the preferred input.
Applying the DDM across a matrix of risk rates (6% to 11%) and growth rates (2% to 4%) produces the following range of fair value estimates:
| Growth Rate (g) | r = 7% | r = 8% | r = 9% | r = 10% |
|---|---|---|---|---|
| 2% | $34.20 | $28.50 | $24.43 | $21.38 |
| 3% | $42.75 | $34.20 | $28.50 | $24.43 |
| 4% | $57.00 | $42.75 | $34.20 | $28.50 |
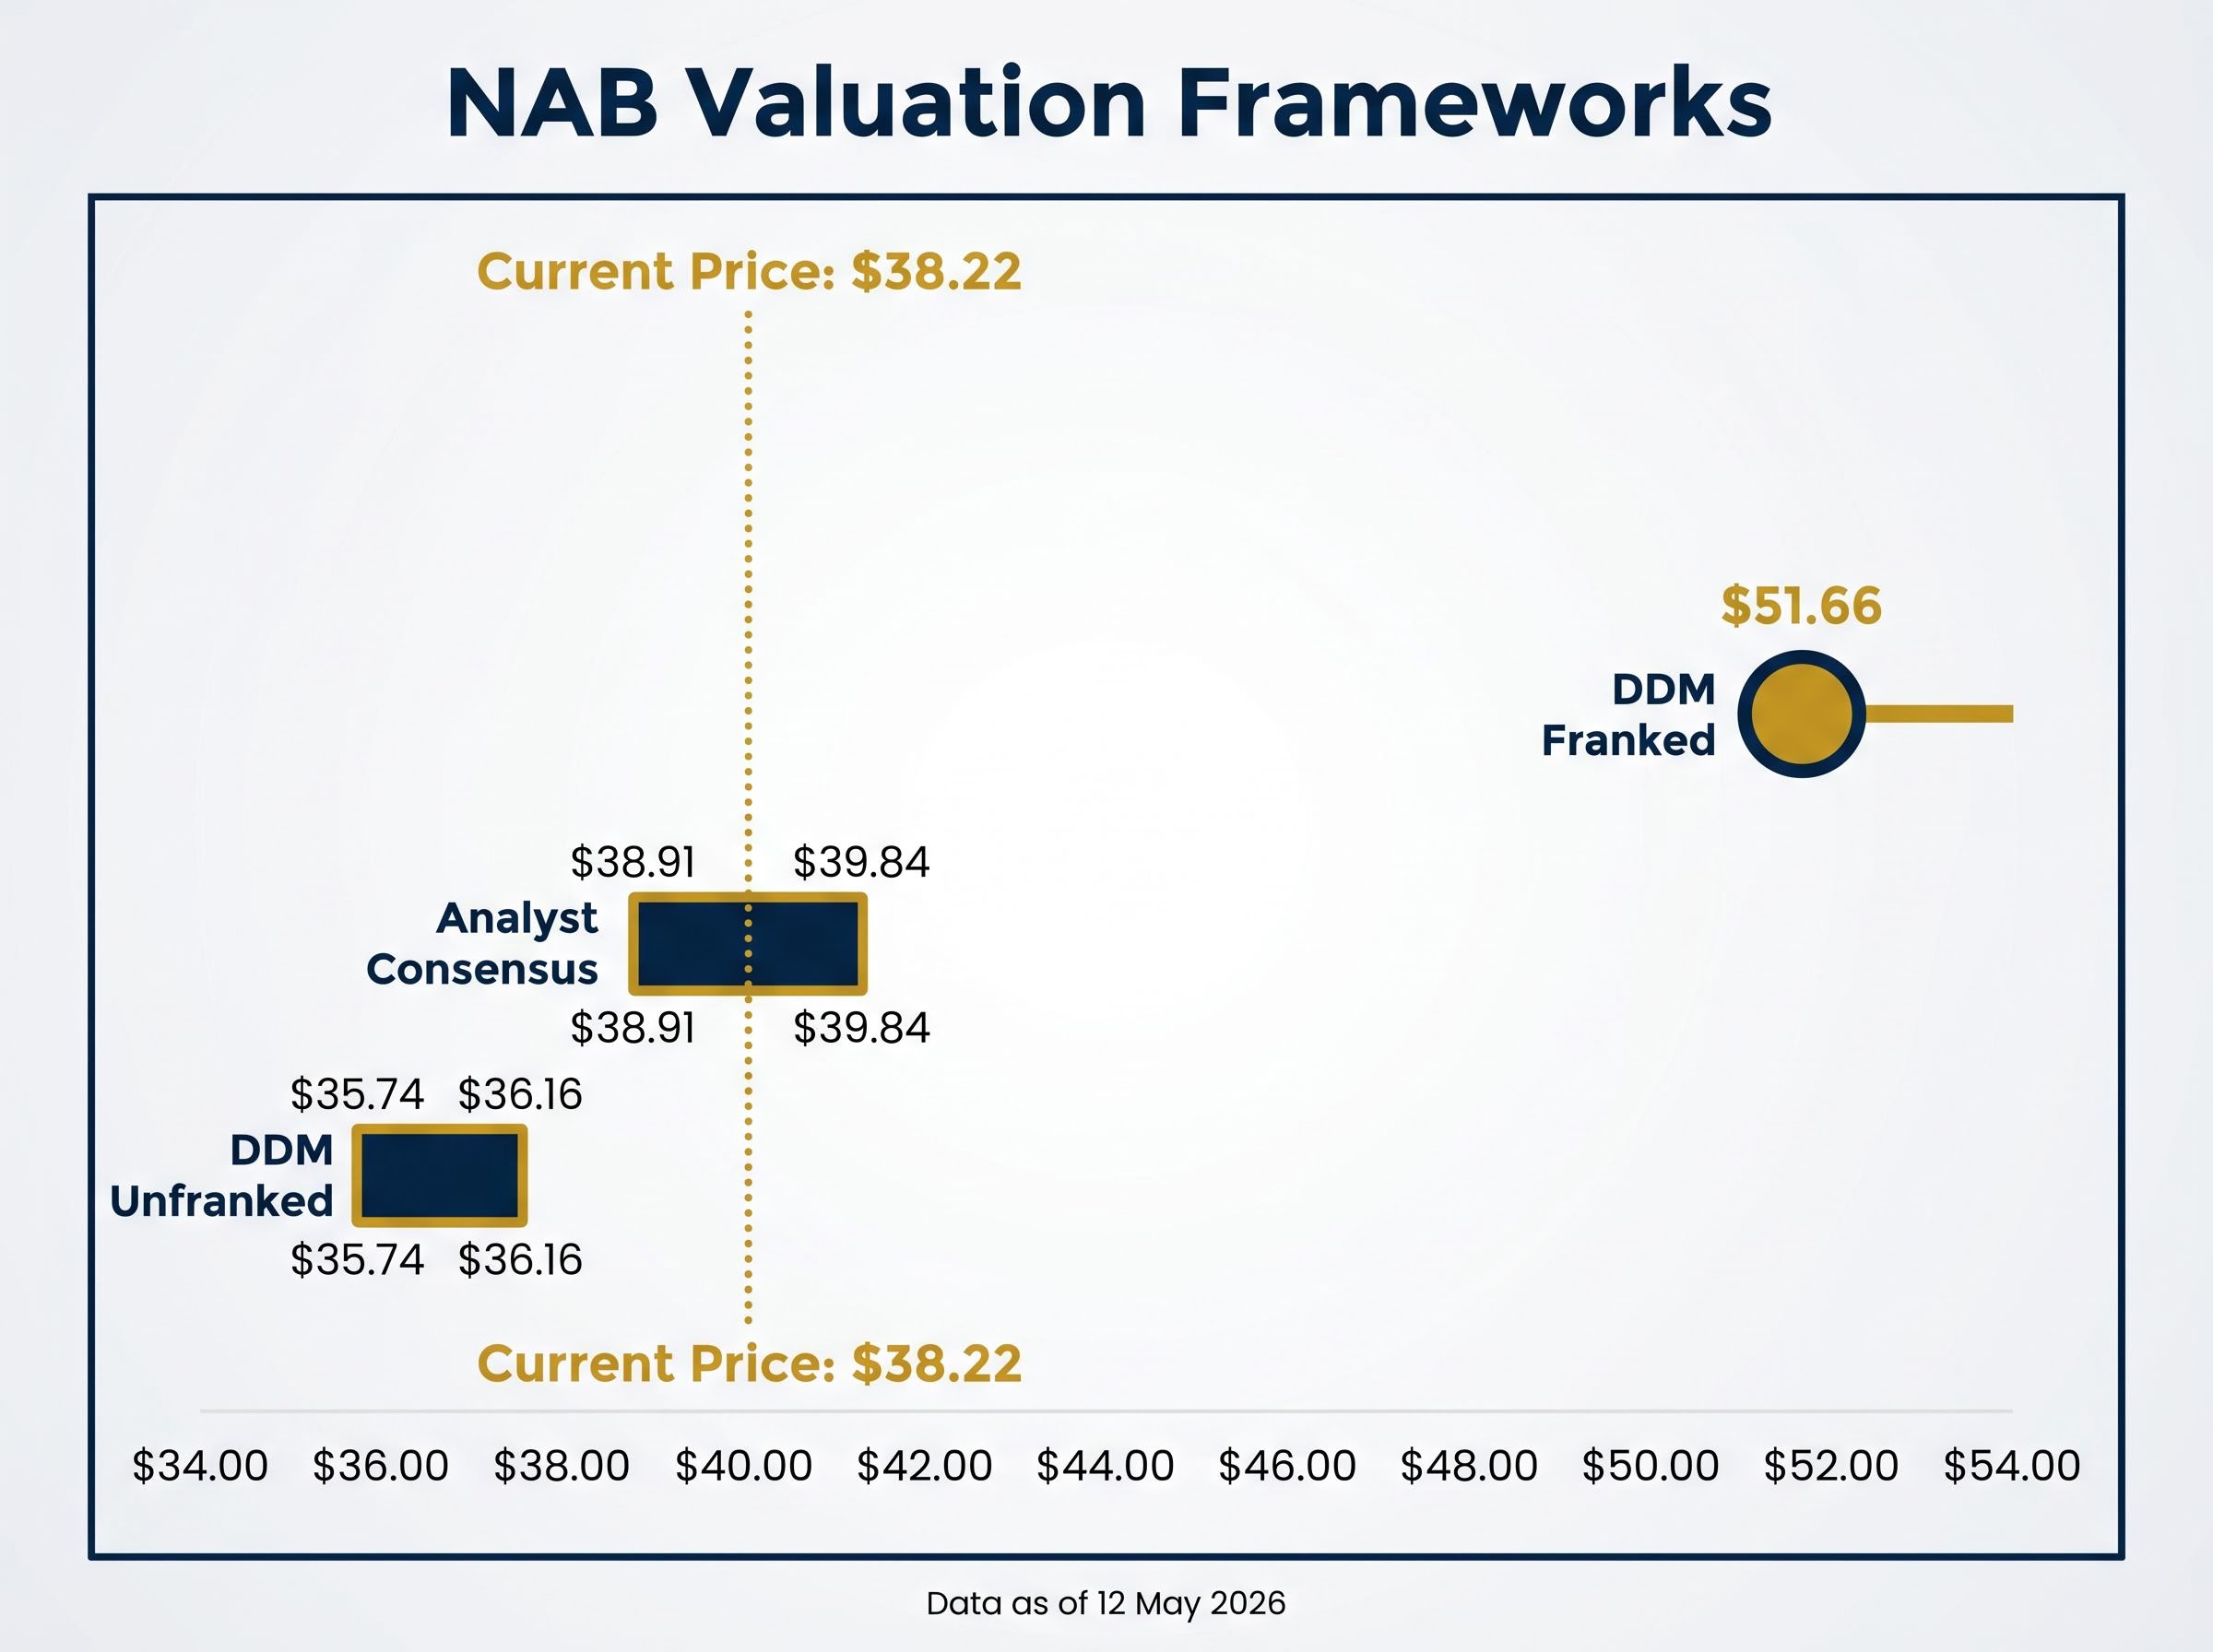
The average DDM estimate across this matrix is approximately $36.16 on the forward dividend, and $35.74 on the historical dividend of $1.69. Both sit below NAB’s current price of $38.22.
At face value, the model suggests NAB is modestly overvalued on an unfranked basis. The current price exceeds the average modelled fair value by roughly $2, implying investors are paying a small premium to what the dividend stream alone supports at mid-range assumptions. That conclusion, however, changes materially once franking credits enter the equation.
Franking credits represent tax already paid at the corporate level. When NAB earns a profit and pays 30% company tax before distributing dividends, eligible Australian shareholders receive a credit for that tax. In practice, this means a fully franked dividend is worth more in the hands of a domestic taxpayer than the cash figure alone suggests.
NAB’s forward dividend of $1.71 per share, grossed up for franking credits at the 30% corporate tax rate, equates to approximately $2.44 per share. Applying that gross dividend to the same DDM formula produces a dramatically different result.
Franking-adjusted DDM fair value: approximately $51.66, compared to the current share price of $38.22 and the unfranked estimate of $36.16. The gap exceeds $15 per share.

The catch is that not every investor can capture this value equally. Three categories of shareholder face different outcomes:
For Australian retail investors and self-managed super funds that can fully utilise franking credits, the gross yield-based case for NAB is materially stronger than the headline dividend number suggests. Ignoring franking credits understates the real return.
A DDM estimate alone is insufficient for a complete valuation judgment. NAB’s underlying fundamentals offer a cross-check that neither fully reinforces nor cleanly contradicts the model’s output.
| Metric | NAB | Sector Average |
|---|---|---|
| Return on Equity (ROE) | 11.4% | 9.35% |
| Net Interest Margin (NIM) | 1.71% | 1.78% |
| CET1 Ratio | 12.35% | Below 12.35% |
| PE Multiple | 16.9x | 20.2x |
NAB’s ROE of 11.4% sits comfortably above the sector average of 9.35%, indicating the bank generates above-average profit per unit of equity. That metric supports the dividend’s sustainability: a bank earning strong returns on its capital base is better positioned to maintain payouts than one stretching to fund them.
The net interest margin of 1.71% tells a less favourable story. It falls below the peer average of 1.78%, and given that lending income constitutes approximately 81% of NAB’s revenue, this margin gap has a material effect on earnings capacity. A seven-basis-point shortfall may appear modest, but applied across a loan book of NAB’s scale, it compounds.
NAB’s Common Equity Tier 1 (CET1) ratio, a measure of a bank’s core capital relative to its risk-weighted assets, stands at 12.35%, above the sector average. This signals balance sheet resilience and provides a buffer that underpins dividend confidence. Meanwhile, a PE-based valuation using NAB’s earnings per share of $2.26 and the sector PE of 20.2x produces a fair value estimate of approximately $44.55, a third data point suggesting the current price of $38.22 may sit below earnings-based fair value.
The APRA APS 110 capital adequacy standard sets the minimum Common Equity Tier 1 requirements that Australian authorised deposit-taking institutions must satisfy, providing the regulatory floor against which NAB’s reported CET1 ratio of 12.35% demonstrates a meaningful surplus buffer.
The picture that emerges is mixed. Strengths in capital adequacy and return on equity coexist with a margin gap that warrants monitoring.
A hybrid valuation approach combining the DDM, a price-to-book cross-check, and an ROE-to-cost-of-equity comparison consistently produces more reliable bank valuations than any single framework, because each method isolates a different dimension of bank economics: income sustainability, balance sheet pricing, and capital efficiency respectively.
If the franking-adjusted DDM points to meaningful upside, the professional analyst community offers a more cautious perspective.
TradingView consensus (approximately 28 April 2026): Of 16 analysts covering NAB, 2 rate it a Buy, 7 a Hold, and 7 a Sell or Strong Sell. The average 12-month price target is $39.84.
The Investing.com average of $38.91 sits only 1.8% above the current price of $38.22, implying the market has largely priced in analyst expectations. The TradingView average of $39.84 implies roughly 4.2% upside, modest by any measure.
The contrast with the DDM is stark. The franking-adjusted model suggests fair value of $51.66; the analyst consensus clusters around $39. That divergence is itself worth interrogating rather than automatically accepting either figure. It reflects, in part, the difference between a yield-based model that rewards predictable income streams and a forward-earnings approach that weights margin pressure, impairment risk, and sector sentiment more heavily. Investors should weigh which inputs they find more credible given their own tax position and time horizon.
The tension between strong fundamentals and stretched pricing is not unique to NAB: the ASX bank valuation premium debate is most acute at CBA, where all 14 covering analysts carry a sell rating despite metrics that sit above sector averages on ROE, NIM, and CET1, offering a useful comparative lens for any investor assessing whether a Big Four discount is a genuine opportunity.
Three valuation frameworks produce three different readings of NAB at its current price:
For Australian retail investors and SMSFs in pension phase, the gross yield-based case is materially stronger than the headline numbers suggest. For non-resident shareholders or those who cannot utilise franking credits, the valuation case is thinner.
The DDM is one tool among several. ROE, NIM trends, capital adequacy, and macroeconomic factors, including the trajectory of loan impairment charges and the interest rate environment, all belong in a complete assessment. NAB’s next major catalyst is its Full Year Results, scheduled for 5 November 2026.
This article is for informational purposes only and should not be considered financial advice. Investors should conduct their own research and consult with a licensed financial adviser before making investment decisions. Past performance does not guarantee future results. Financial projections are subject to market conditions and various risk factors.
The Dividend Discount Model values a stock as the present value of all future dividends, using the formula P = D / (r - g). Applied to NAB's forward dividend of $1.71 per share, the model produces a range of fair value estimates depending on the required return and growth rate assumptions used.
NAB's fully franked dividends can be grossed up for the 30% corporate tax rate, lifting the effective dividend input from $1.71 to approximately $2.44 per share. This adjustment pushes the DDM fair value estimate to around $51.66, compared to $36.16 on an unfranked basis, a difference of more than $15 per share.
As of approximately 28 April 2026, 16 analysts on TradingView produce an average 12-month price target of $39.84, while 14 analysts on Investing.com place the average target at $38.91, both suggesting limited near-term upside from the current price of $38.22.
The DDM is highly sensitive to small changes in the spread between the required return and the growth rate. For NAB, shifting the required return from 7% to 9% while holding growth at 3% compresses the fair value estimate from $42.75 to $28.50, a swing of more than $14 per share.
NAB's return on equity of 11.4% and CET1 ratio of 12.35% both exceed sector averages, while its net interest margin of 1.71% sits slightly below the peer average of 1.78%. Its PE multiple of 16.9x is also meaningfully lower than the sector average of 20.2x.