Why a BoJ Rate Hike Hasn’t Stopped the Yen Carry Trade
12 hrs ago
Most Australian investors can name the yield on their bank shares. Far fewer can explain why that yield is worth considerably more to them than the same percentage figure on a US dividend stock or a UK bank holding.
The answer sits at the intersection of two structural features that are, taken together, genuinely rare in global equity markets. The first is a tax imputation system that converts company tax into a direct cash benefit for eligible investors. The second is a banking oligopoly so entrenched that competitive disruption remains structurally constrained in ways most industries are not. Both features are misunderstood, underappreciated, or treated as background noise in most investor commentary about Australian bank shares.
What follows unpacks both mechanisms from first principles, explains how they interact to create a wealth-building dynamic unavailable through international income alternatives, and gives readers the conceptual tools to evaluate bank shares beyond the headline yield figure.
Dividend yield, as typically quoted on a broker screen or financial website, is a pre-imputation figure. It tells an investor how much cash they will receive as a percentage of the share price. It does not reflect the full economic return available to Australian tax residents who hold fully-franked shares.
The gap between the cash yield and the grossed-up yield (the figure that includes the value of attached franking credits) is not a technicality. It is a meaningful dollar difference, and it widens as portfolio values grow.
Commonwealth Bank illustrates this clearly. Its cash yield sits under 3%, a figure that looks unimpressive beside a term deposit or a high-yield international stock. Its grossed-up yield, including franking credits, is approximately 4%. Neither figure captures the full benefit for investors in low or zero tax brackets, where the franking credit becomes a cash refund rather than merely an offset.
CBA’s grossed-up yield of approximately 4% represents the minimum starting point for any honest income comparison. The cash yield figure alone understates the economic return by roughly a third for investors who can use the full franking credit.
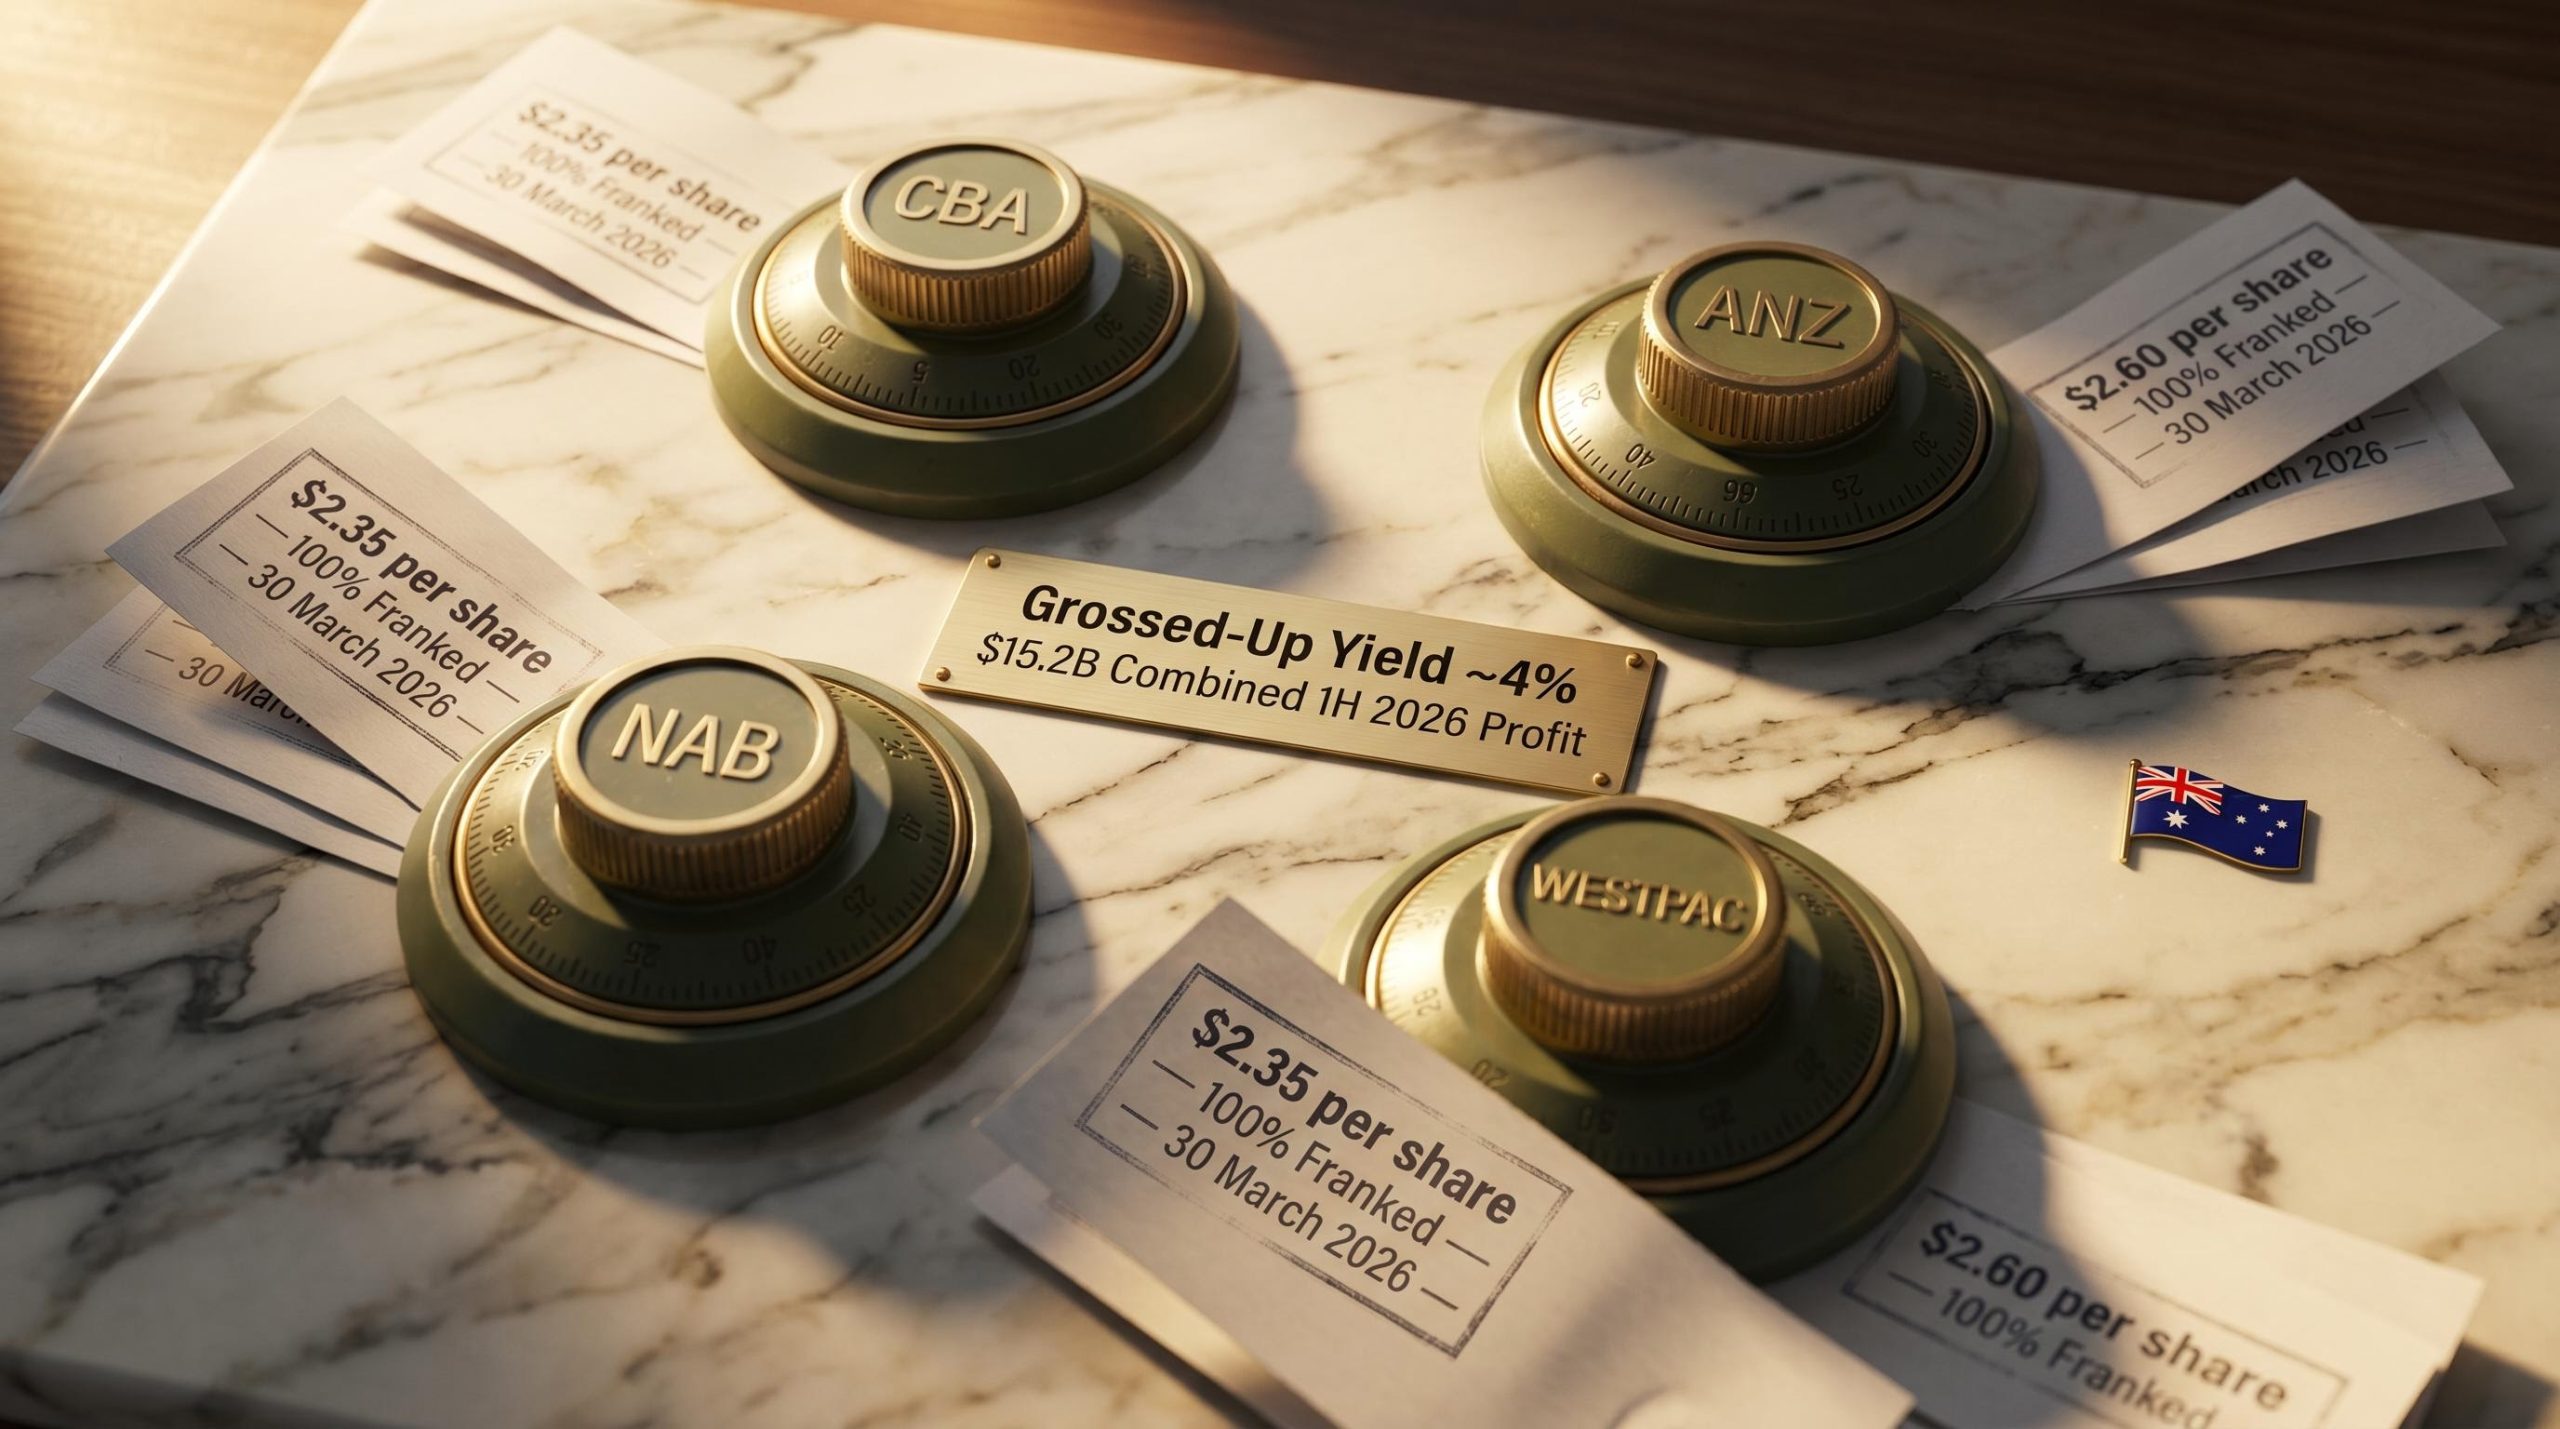
CBA’s interim dividend for the half-year was $2.35 per share, 100% franked, with a payment date of 30 March 2026. Its final dividend in September 2025 was $2.60 per share, also 100% franked.
Across the Big Four, cash yields vary, but the franking credit effect applies consistently to those dividends that carry full franking.
| Bank | Cash Yield (approx.) | Grossed-Up Yield (approx.) | Franking Status |
|---|---|---|---|
| CBA | Under 3% | ~4% | 100% franked |
| ANZ | ~5.7% | Higher (varies with franking level) | Partial franking in some periods |
| NAB | ~4.5% | Higher when fully franked | Fully franked (latest confirmation pending) |
| Westpac | ~4.2% | Higher when fully franked | Fully franked (latest confirmation pending) |
Investors who evaluate bank shares on cash yield alone are comparing an incomplete number against a complete one when they look at alternatives like term deposits.
Australia’s dividend imputation system exists to prevent the same dollar of profit from being taxed twice: once at the company level and once in the hands of the shareholder. The mechanism is straightforward in principle, but its consequences vary dramatically depending on the investor’s tax position.
Franking credit refunds operate on a simple but powerful principle: corporate tax paid at the company level flows through to eligible shareholders as a direct offset against personal tax liability, and for zero-tax investors the excess is returned as a cash payment by the ATO, not merely carried forward.
The chain works in four steps:
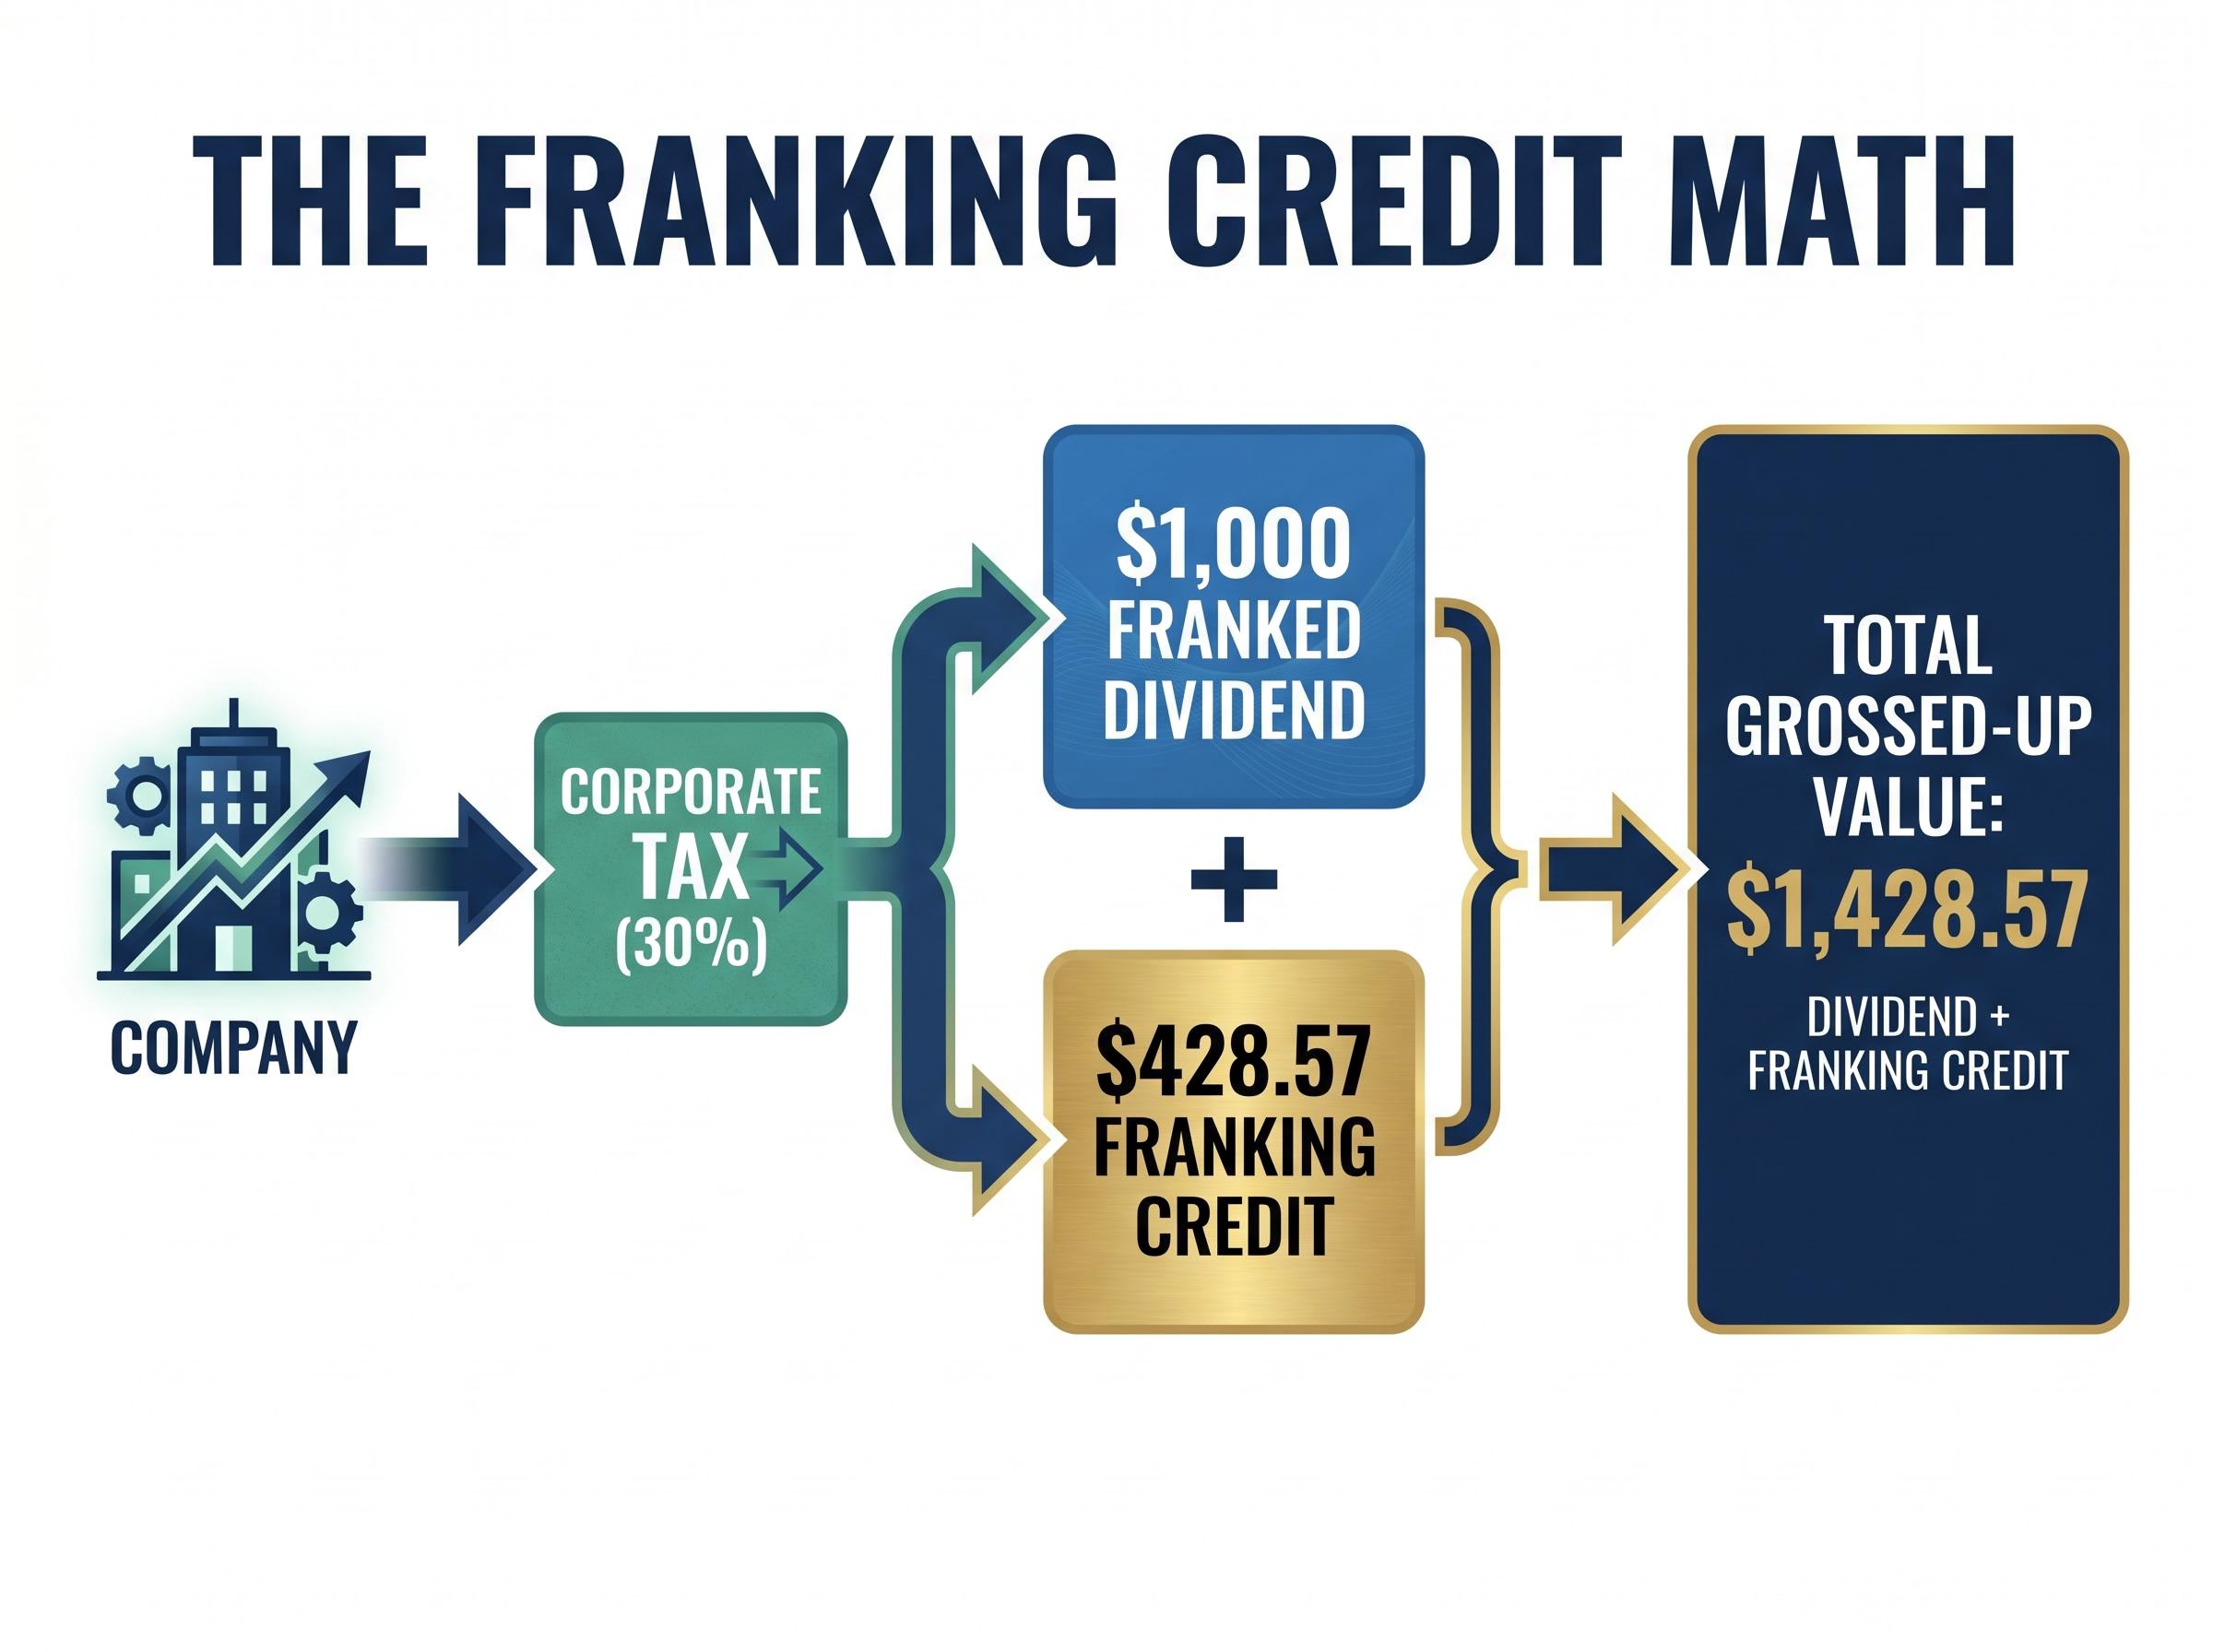
A concrete example makes the dollar value visible. A $1,000 franked dividend from a company taxed at 30% carries $428.57 in franking credits, giving a grossed-up value of $1,428.57. An investor on a 30% marginal tax rate uses the credit to exactly offset their personal tax on that income, paying no additional tax. An investor on a 45% rate pays the difference. An investor on zero pays nothing and receives the $428.57 as a direct cash refund from the Australian Taxation Office.
This is why CBA’s dividends, confirmed at 100% franked for both its interim and final payments, deliver a structurally different return for Australian tax residents than any dividend from a company that has not paid Australian corporate tax. No imputation credit attaches to dividends from international holdings, regardless of their headline yield.
It is worth noting that ANZ’s most recent dividends have carried only partial franking in some periods, which reduces the credit value relative to fully-franked peers.
The most powerful expression of the imputation benefit occurs when the investor’s tax liability is zero. This is the standard position for self-funded retirees drawing from a superannuation fund in pension phase, including self-managed super funds (SMSFs) in retirement mode.
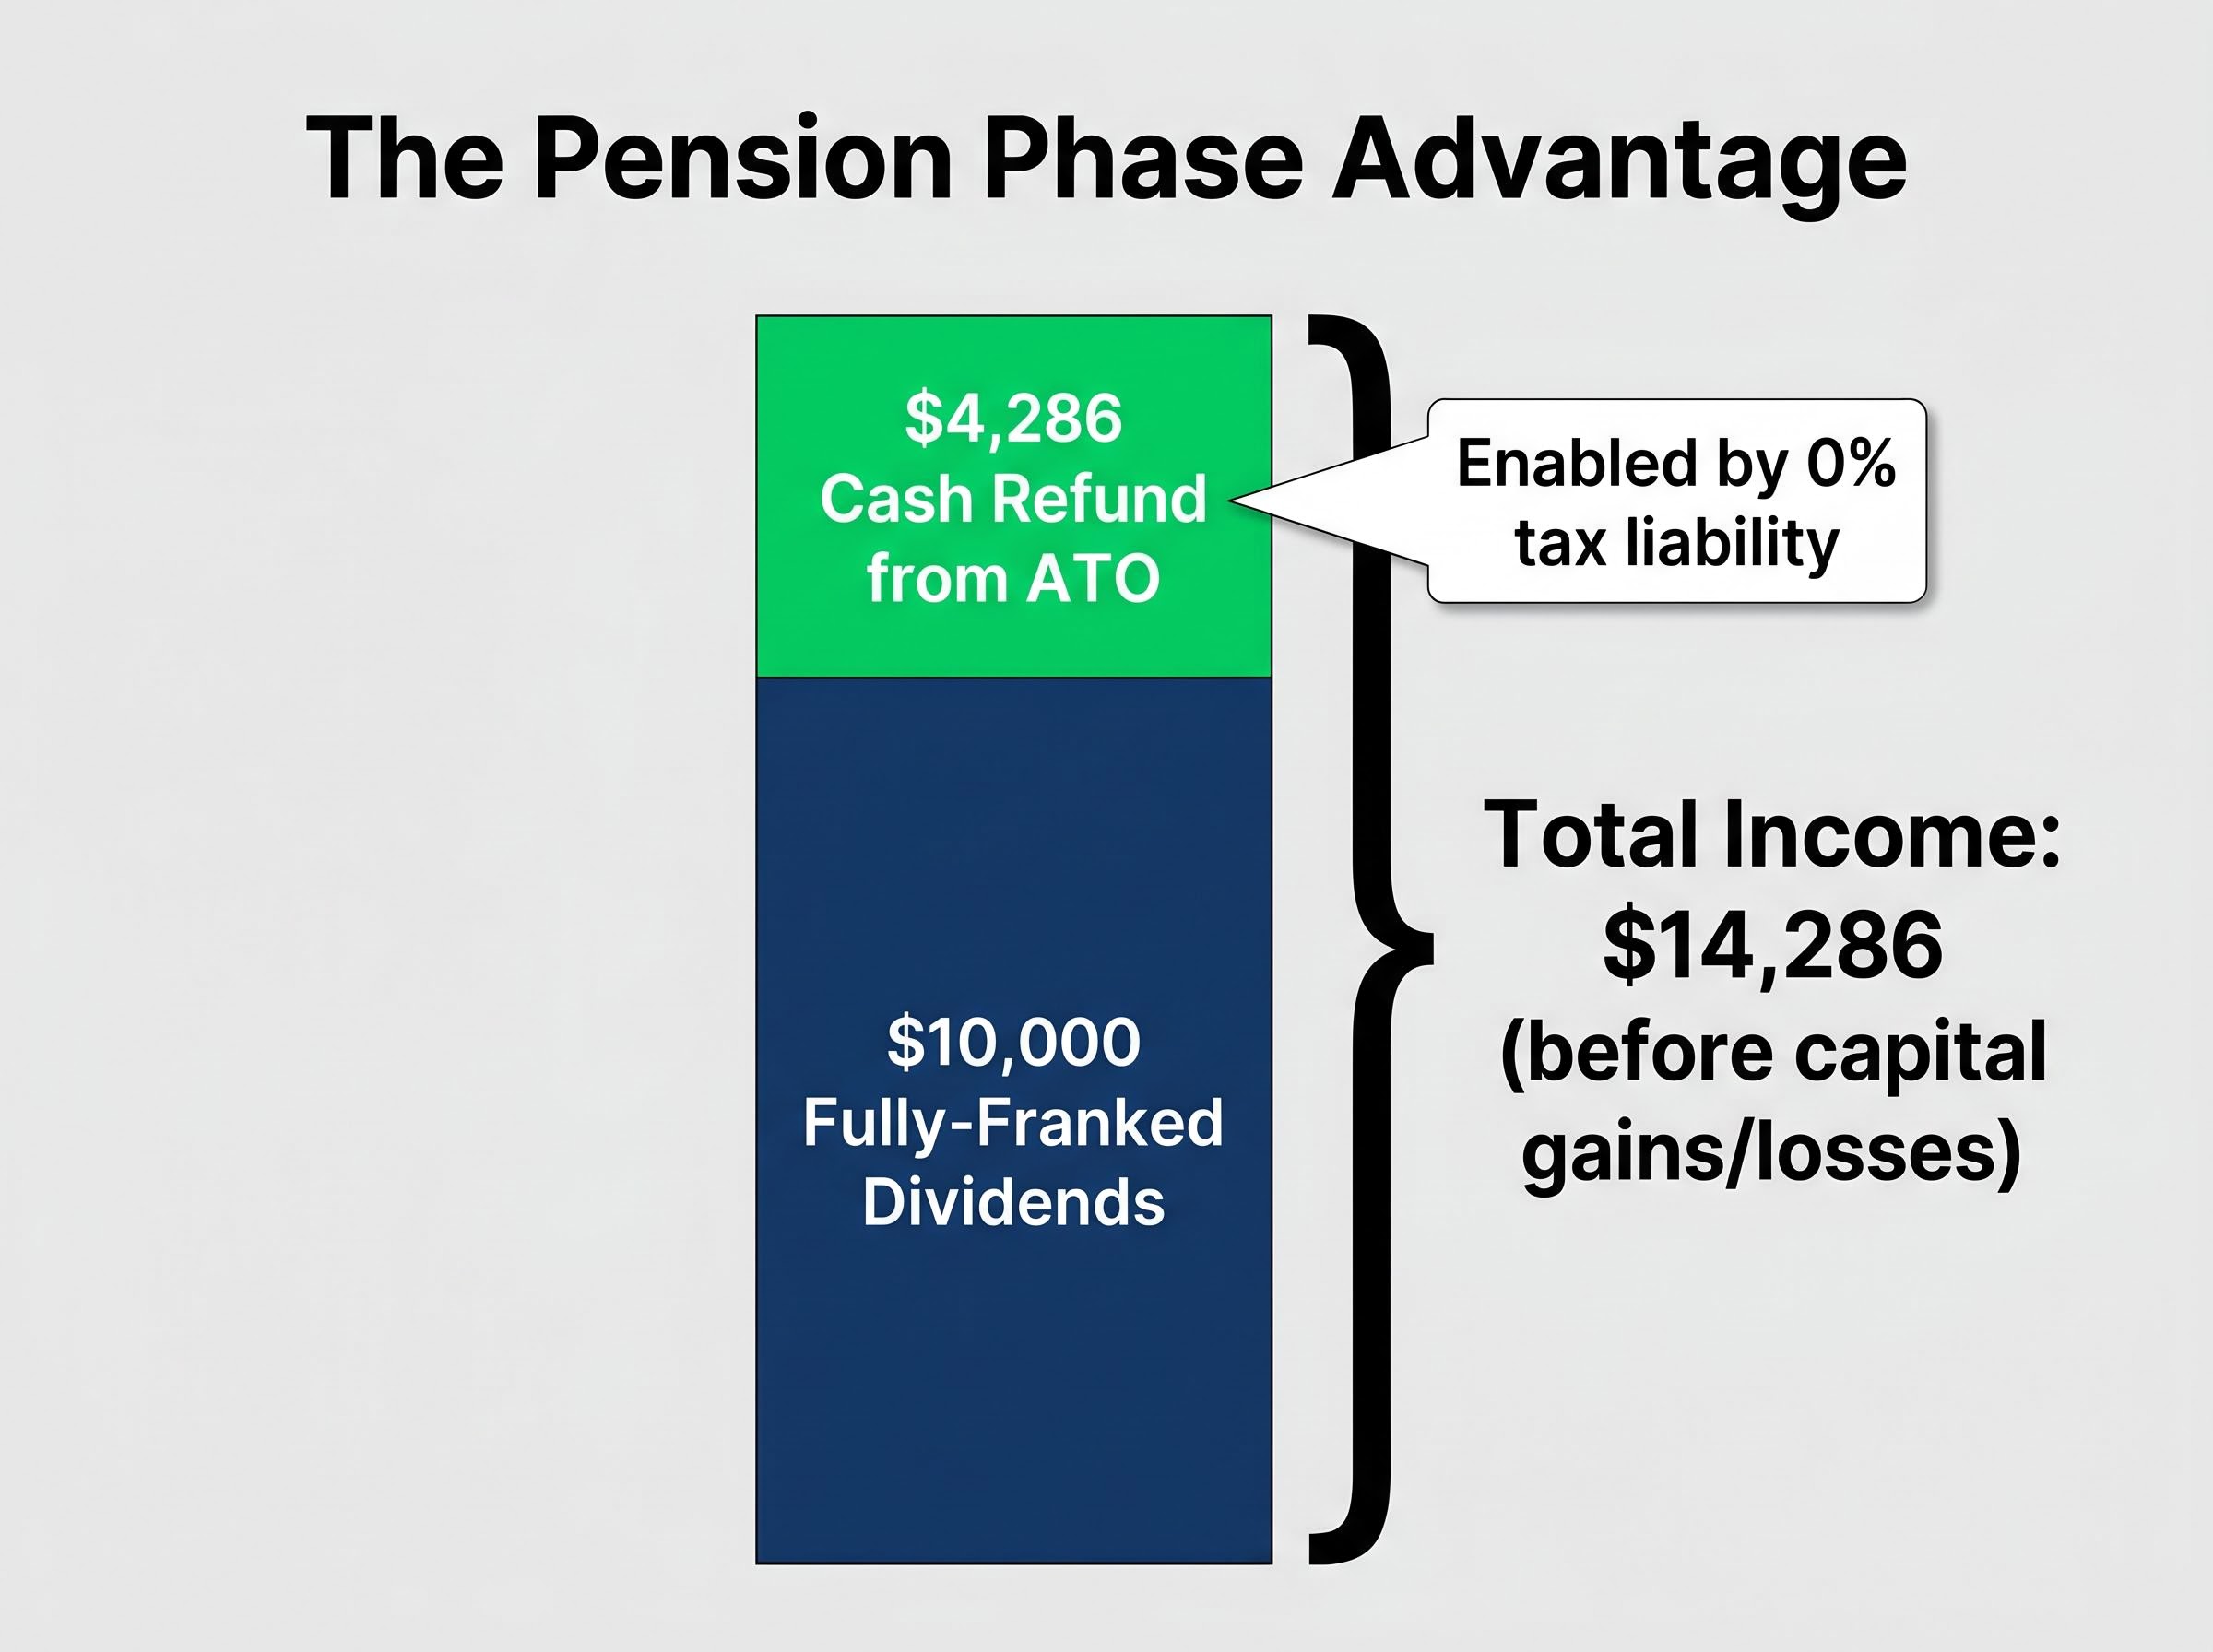
For these investors, franking credits are not an offset. They are a direct cash payment from the ATO. A retiree in pension phase who receives $10,000 in fully-franked dividends also receives approximately $4,286 in franking credit refunds, bringing the total income from those shares to $14,286 before any capital gain or loss.
The ATO franking credit refund rules confirm that when an individual’s franking credits exceed their basic tax liability, the excess is returned as a direct cash payment, making the refund mechanism a formally legislated entitlement rather than a discretionary concession.
The distinction between accumulation phase (where the credit offsets tax at the 15% fund rate) and pension phase (where it triggers a full refund) is the single largest variable in determining how much value the franking system delivers. For pension-phase investors, the gap between Australian bank shares and international alternatives is at its widest.
The franking credit system determines how efficiently dividends are received. The oligopoly structure determines how reliably they are generated in the first place.
Australia’s Big Four banks control the dominant share of residential mortgages, retail deposits, and small business lending. KPMG’s Big Four Major Banks Half-Year Results 2026 reinforces the concentration thesis qualitatively, though precise market share figures require sourcing from RBA Financial Stability Reviews and APRA banking statistics.
Three reinforcing sources underpin this competitive moat:
What distinguishes the Australian banking oligopoly from concentrated industries elsewhere is the additional layer of explicit prudential regulation. APRA simultaneously constrains competition (making entry harder) and reduces the probability of catastrophic failure for incumbents (making the earnings base more durable). The regulator is, in effect, both the moat builder and the moat’s maintenance crew.
The Big Four’s combined profit after tax in FY 2025 was $29.8 billion, down approximately 0.5%, essentially flat. In 1H 2026, combined profit came in at $15.2 billion, down 2.1% compared to 1H 2025.
How do banks sustain strong dividends while earnings soften? Two factors matter. First, broad payout ratios and the absolute scale of earnings still being generated. Even a 2.1% decline from $15.5 billion to $15.2 billion leaves a profit base large enough to fund dividends comfortably within existing payout frameworks.
Second, the oligopoly earnings floor constrains the downside. Net interest margin (NIM) compression is a real headwind in the current rate environment, but it is a cyclical feature of banking economics rather than a structural erosion of the competitive position. Competition for mortgage and deposit customers may squeeze margins in any given half-year. The barriers to entry that protect the revenue base itself remain intact.
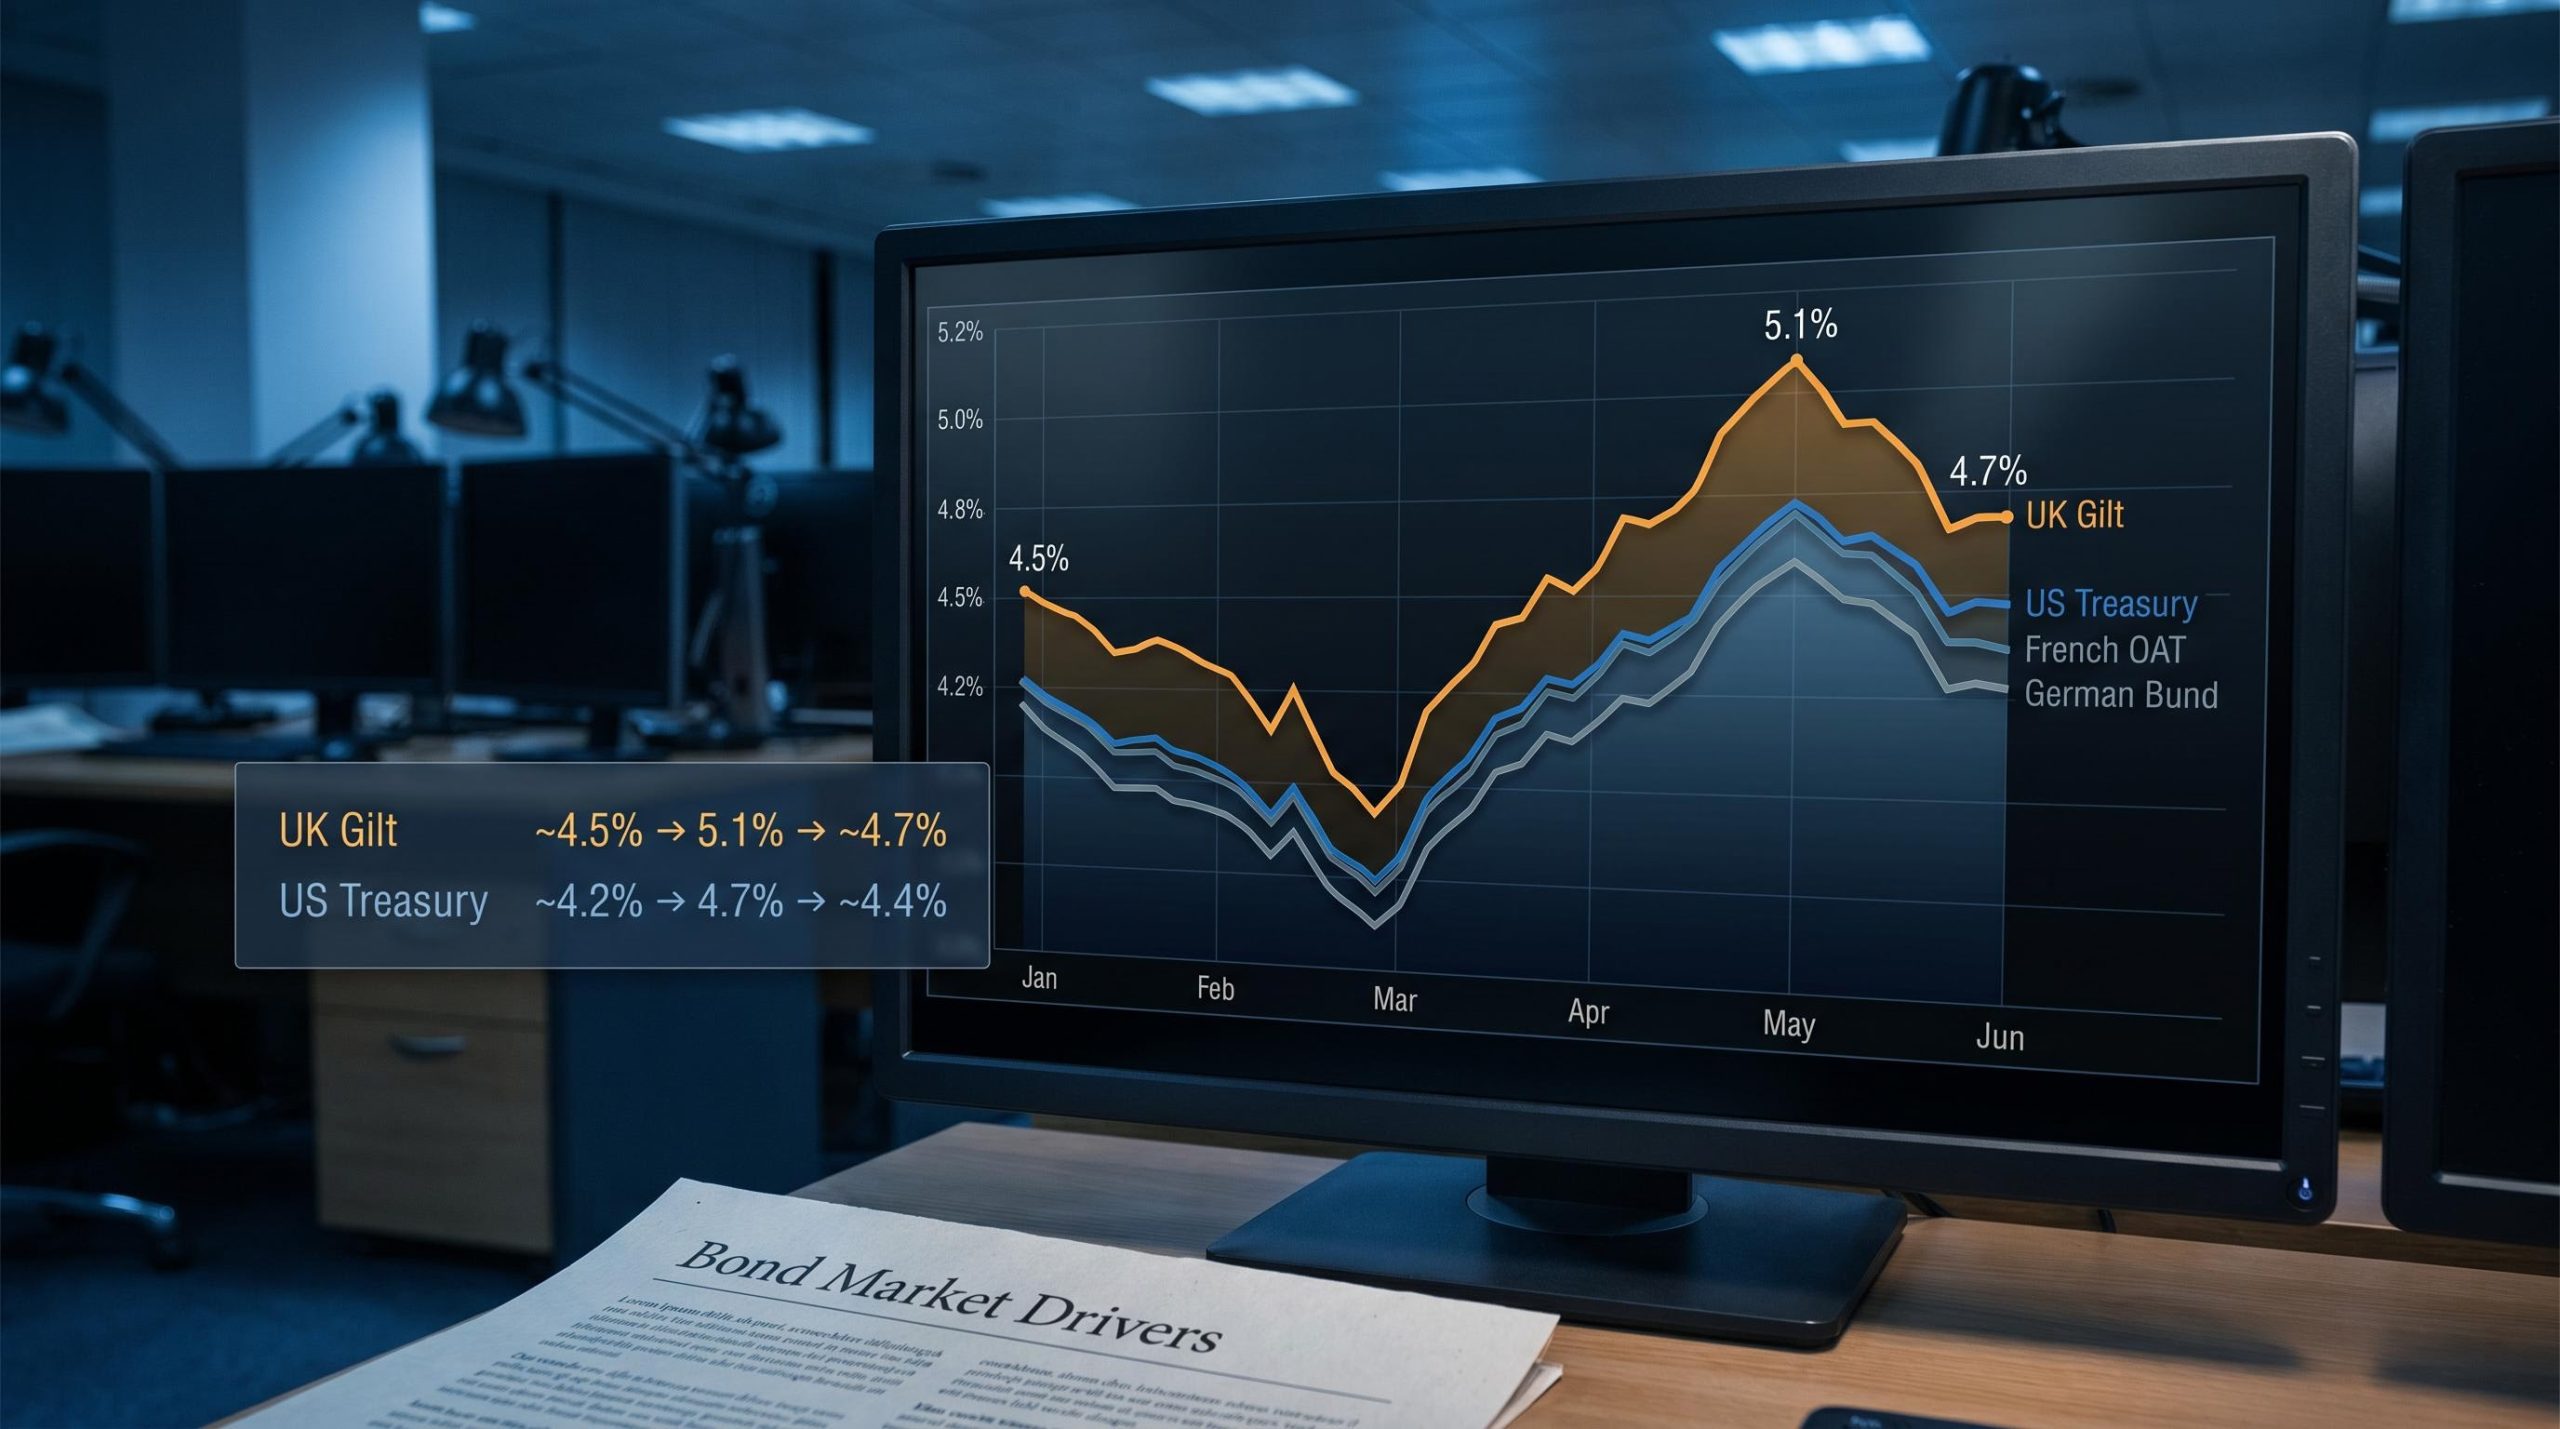
Net interest margin compression accelerated after the RBA’s May 2026 decision to raise the cash rate to 4.35% while peer central banks held, creating a rate differential that affects wholesale funding costs for the Big Four even as it mechanically widens the spread between mortgage rates and deposit costs in the short term.
Separately, the franking credit system and the oligopoly moat are each meaningful structural features. Together, they create an income scenario that no international alternative can replicate for an Australian retiree.
A pension-phase SMSF member holding fully-franked Big Four shares receives: the cash dividend, the franking credit refund (at the full 30% corporate tax rate), and the implicit protection of an earnings base sustained by oligopoly economics. The grossed-up yield becomes the effective floor return, not the ceiling, because the refund is a direct cash payment rather than an accounting offset.
The international comparison is explicit. An Australian retiree holding a high-yielding UK or US dividend stock receives the cash dividend but no imputation credit, pays withholding tax in many cases, bears currency risk on every payment, and holds shares in companies whose earnings bases face more open competitive exposure.
The honest counterpoint: CBA’s grossed-up yield of approximately 4% still falls below current 12-month term deposit rates of 5.00%-5.20% (including a CBA special offer at 5.20% per annum). For investors in accumulation phase or on higher marginal tax rates, bank shares are not automatically superior to risk-free alternatives at current prices.
Share price performance adds another dimension. Over the past 12 months, NAB returned approximately +34.88%, ANZ approximately +32.39%, and Westpac approximately +31.45%. ANZ trades at a price-to-earnings ratio of approximately 18.7x (trailing twelve months), evidence that the market prices the structural advantages at a premium.
The investor profiles for whom the combined advantage is strongest versus least compelling:
The instinct to compare yields across geographies is natural. The error is treating the comparison as a simple numbers race.
International high-yield dividend stocks (UK banks, US REITs, Singaporean banks, global dividend ETFs) frequently offer headline yields that exceed Australian bank cash yields. None carry imputation credits for Australian tax residents. That single structural absence changes the entire comparison.
Three specific risks make international dividend yields less comparable than they appear. Currency risk erodes AUD-denominated returns in ways that are unpredictable and unhedgeable at reasonable cost for most retail investors. Withholding tax, imposed by the source country, reduces the net yield before the investor even sees the payment. And the absence of oligopoly protection means the earnings base funding those dividends is more competitively exposed, with no equivalent of APRA’s regulatory barrier structure insulating incumbents.
| Feature | Aus Bank Shares (fully franked) | International Dividend Stock | Why It Matters | Who It Favours |
|---|---|---|---|---|
| Franking credits | Yes (up to 30% refund) | No | Adds 1-2% to effective yield for eligible investors | Australian tax residents, especially pension phase |
| Withholding tax | None (domestic) | Typically 15-30% | Reduces net cash received | Domestic holders |
| Currency risk | None (AUD income) | Full exposure | Unpredictable impact on AUD returns | Domestic holders |
| Competitive moat | Oligopoly with regulatory barriers | Varies; often more competitive | Affects earnings durability and dividend sustainability | Income-focused long-term holders |
| Earnings base visibility | High (APRA oversight, domestic focus) | Variable | Predictability of income stream | Retirees dependent on dividend income |
Analyst sentiment on Big Four valuations remains broadly bearish, with prices described as “appearing full.” Yet the banks delivered 30%+ share price returns over the past 12 months, a significant divergence between broker consensus and market outcomes. The market, in effect, has priced the structural story more aggressively than the analysts expected.
The franking credit refund system has been politically contested. In the lead-up to the 2019 federal election, the then-opposition Labor Party proposed limiting franking credit cash refunds for individuals and funds that did not pay tax. The proposal was defeated at the election, but it demonstrated that the system is not immutable.
As of May 2026, no confirmed policy proposals threaten the current system. No Treasury consultation papers or ATO guidance updates affecting franking credit refunds have been identified in available research. The system appears intact.
Investors with heavy concentration in franked dividend income should monitor Treasury consultation papers and ATO rulings as part of ongoing portfolio governance. Policy risk here is a tail risk to acknowledge, not a central scenario to act on currently.
Australian bank shares are not primarily a growth investment, nor are they simply a yield instrument. They are a structurally protected, tax-efficient income stream whose real value depends heavily on the investor’s tax position and time horizon.
The two structural advantages, imputation and oligopoly, are reinforcing. The tax system makes the income more valuable per dollar received. The competitive structure makes the earnings base generating that income more durable per cycle endured. Neither advantage exists in isolation for most international alternatives available to Australian investors.
The investor profiles where the thesis is strongest versus weakest:
ASX income portfolio construction that relies heavily on the Big Four carries inherent concentration risk, since four companies representing roughly 25% of the ASX 200 index means a sector-specific shock would affect both the income stream and the capital base simultaneously.
Expectations should be calibrated. ANZ at approximately 18.7x trailing earnings and broad analyst caution about full valuations suggest the structural advantages are largely priced in at current levels. The combined 1H 2026 profit of $15.2 billion, while softening, confirms the absolute scale of earnings still being generated. CBA’s grossed-up yield of approximately 4% represents the return floor for pension-phase investors, not a growth target.
The structural story is genuine. It should inform portfolio construction, not replace rigorous valuation discipline.
For investors wanting to build a more rigorous valuation framework before acting on the structural story, our dedicated guide to ASX bank stock valuation uses NAB as a live case study and shows how different macroeconomic assumptions about RBA rates, employment, and property prices produce a $19.00 to $85.50 per share range from the same model inputs.
The franking credit and oligopoly advantages are genuine structural features of Australian bank shares, not marketing narratives. Their value, however, is investor-specific and context-dependent. A pension-phase retiree and an accumulation-phase saver on a 45% marginal rate hold the same shares but receive materially different economic returns from them.
The practical next step is assessment before comparison. Investors should evaluate their own tax position and superannuation phase before making yield comparisons against term deposits or international alternatives. Grossed-up yield, not cash yield, is the baseline metric for any honest assessment.
The earnings softening trend (1H 2026 down 2.1%) and full valuations mean investors buying today are largely paying for the structural story in advance. Capital return expectations should be calibrated accordingly.
This article is for informational purposes only and should not be considered financial advice. Investors should conduct their own research and consult with financial professionals before making investment decisions.
Investors seeking to apply this framework to their specific circumstances should consult a financial adviser to assess how their marginal tax rate, super phase, and portfolio concentration interact with the franking credit benefit. The conceptual tools provided here are a starting point, not a recommendation.
A grossed-up yield includes the value of franking credits attached to a dividend, whereas a cash yield only reflects the actual cash payment received. For a fully franked stock like CBA, the grossed-up yield is approximately 4%, compared to a cash yield of under 3%, meaning the cash figure alone understates the true economic return by roughly a third for eligible investors.
When an Australian company pays corporate tax at 30% and then distributes a dividend, it attaches franking credits representing the tax already paid. Shareholders use those credits to offset their personal tax liability, and investors whose tax liability is zero (such as pension-phase SMSF members) receive the excess credits as a direct cash refund from the ATO.
Because a pension-phase superannuation fund pays zero tax, franking credits attached to fully franked dividends are not merely an offset but a direct cash payment from the ATO. A pension-phase investor receiving $10,000 in fully franked dividends also receives approximately $4,286 in franking credit refunds, bringing total income to around $14,286 before any capital movement.
International dividend stocks carry no imputation credits for Australian tax residents, often attract withholding tax from the source country, expose investors to currency risk, and operate in more competitively open markets without an equivalent of APRA's regulatory barrier structure. Australian bank shares avoid all four of these disadvantages for eligible domestic holders.
The franking credit refund system was politically contested ahead of the 2019 federal election, when the then-opposition proposed limiting cash refunds for zero-tax investors, though the proposal was defeated. As of May 2026, no confirmed policy proposals threaten the current system, making this a tail risk to monitor rather than a central scenario to act on.