Why the AI Rally Looks Like Every Bubble Before It
41 mins ago
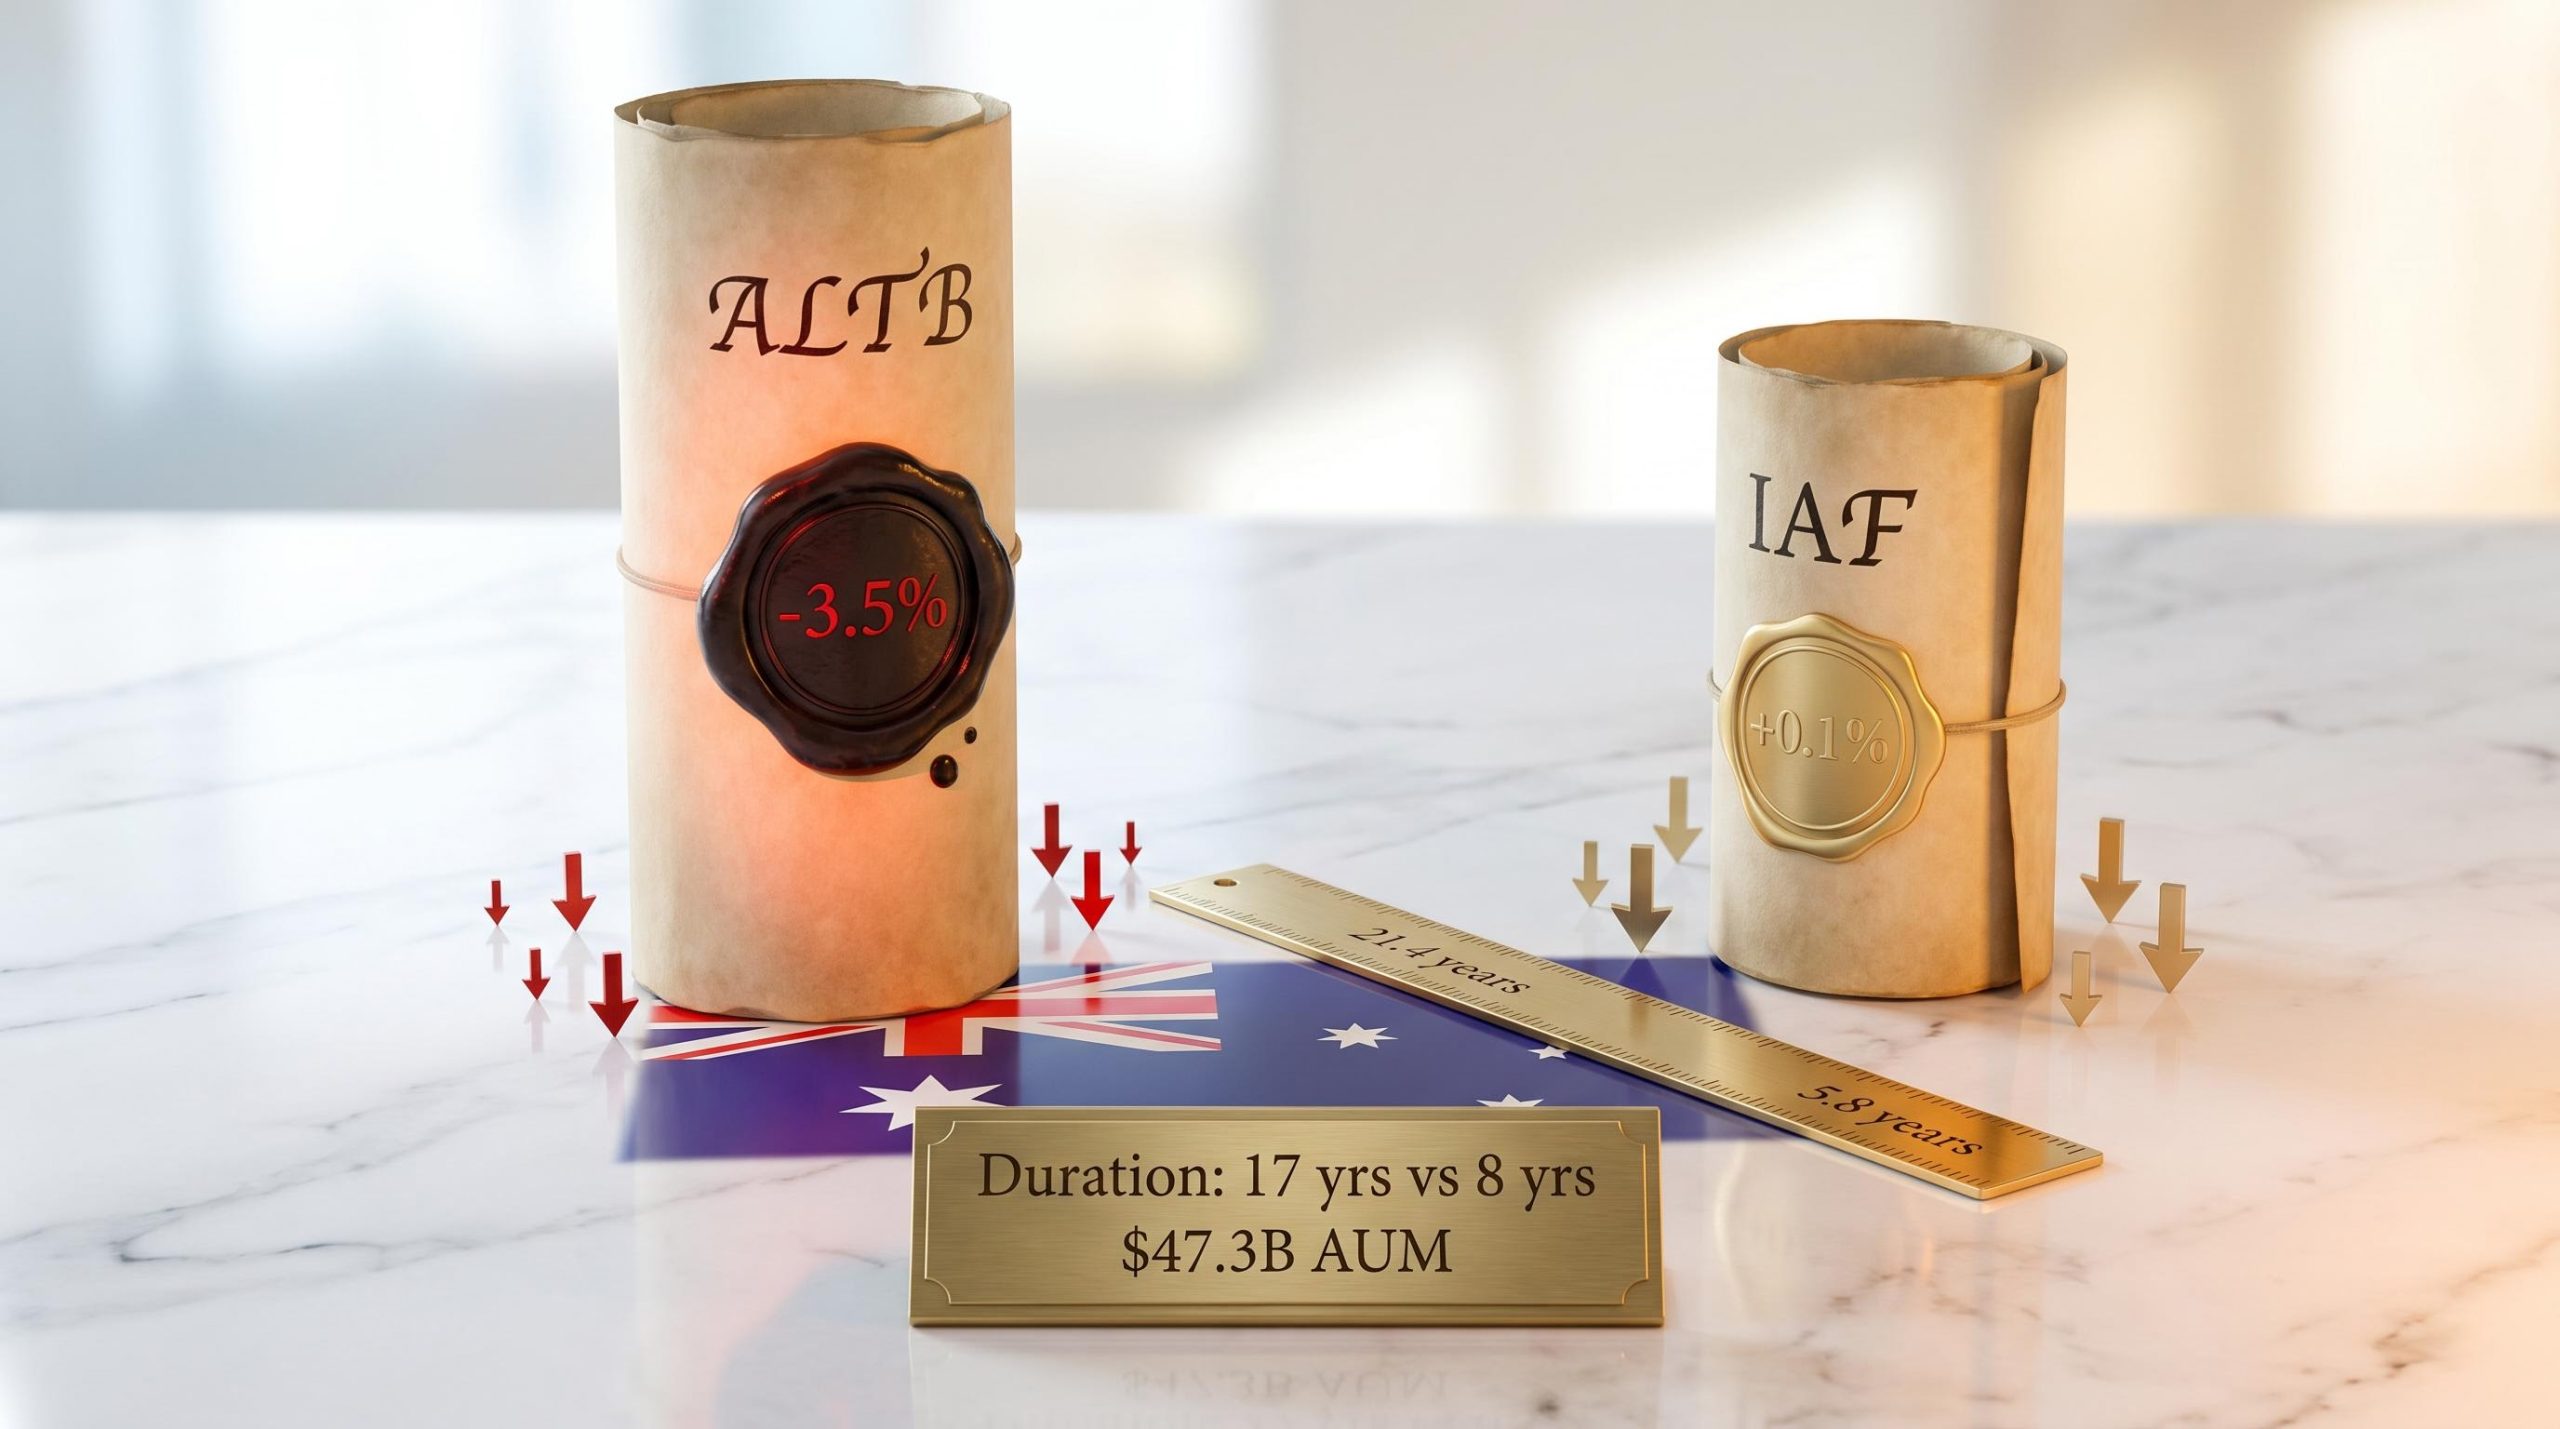
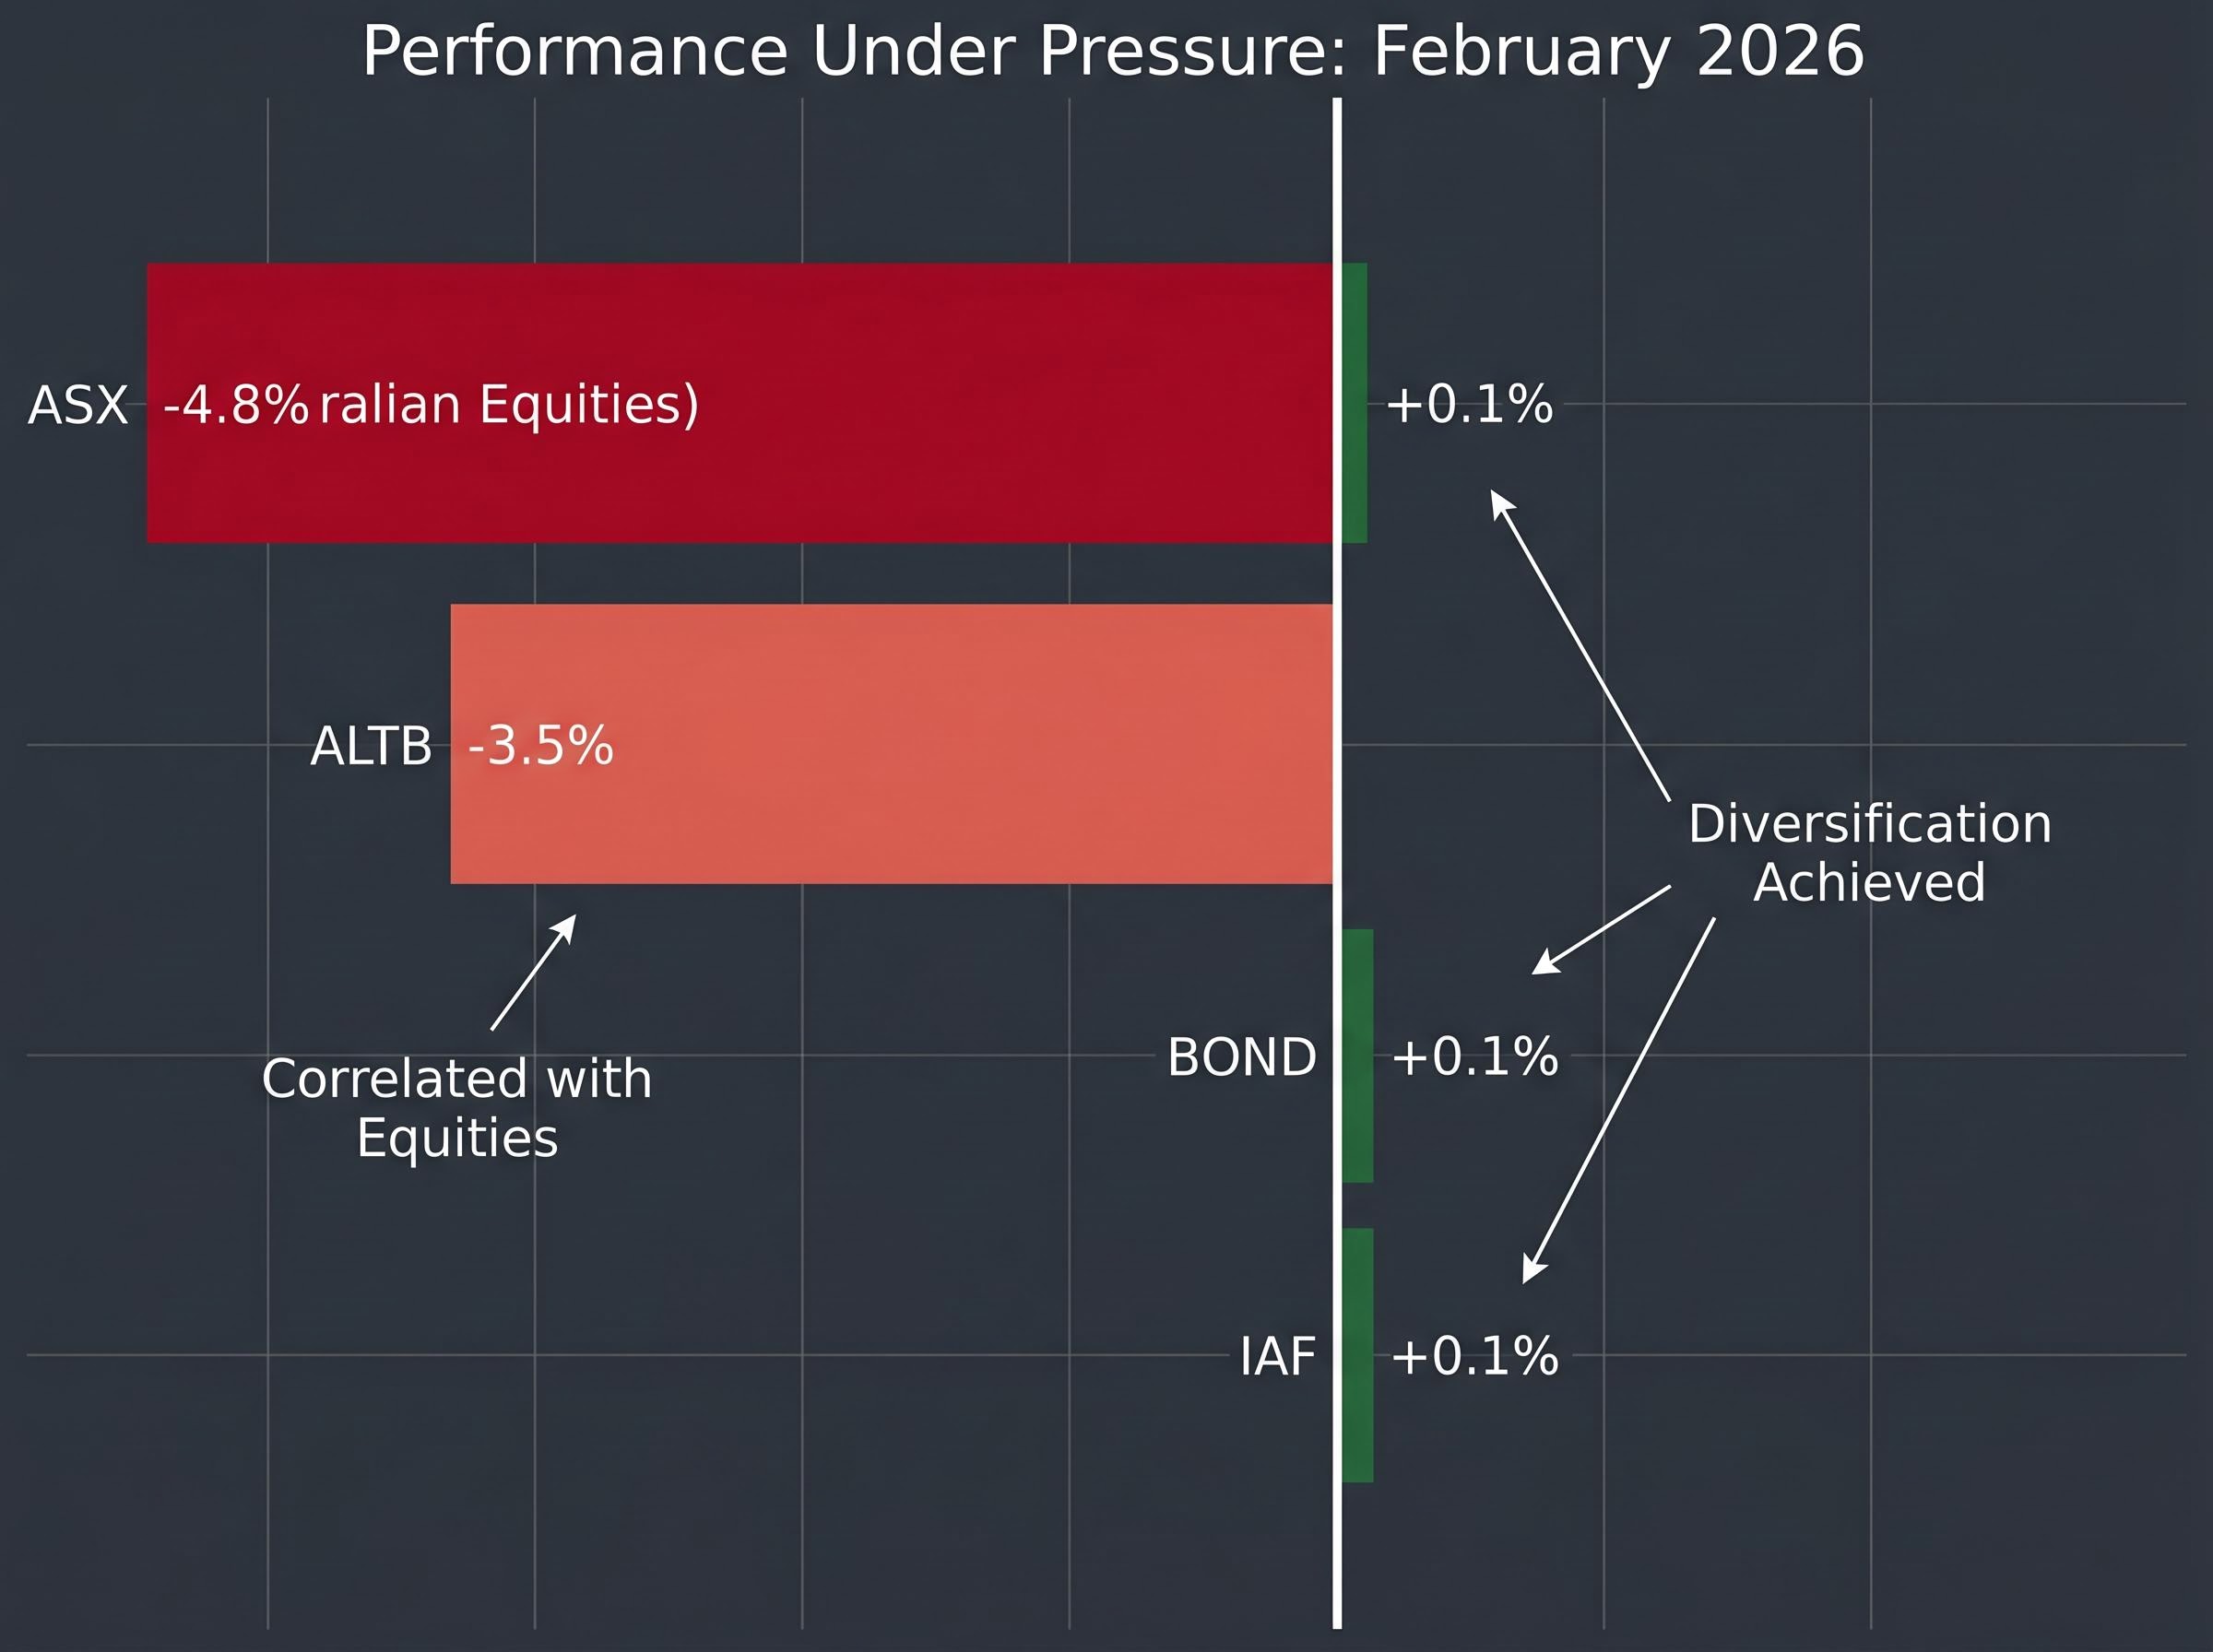
In February 2026, ALTB fell 3.5% on the same day Australian equities dropped 4.8% on US recession fears. Meanwhile, IAF and BOND each returned +0.1%. All three are classified as Australian bond ETFs. The divergence was not an anomaly; it was duration at work.
Australian bond ETF assets under management reached approximately $47.3 billion by March 2026, with AUM growing nearly 35% in the preceding 12 months. Retail investors are flowing into the sector at pace, and most are comparing fees and recent returns. Fewer are comparing duration and credit quality, the two characteristics that actually determine how a bond ETF behaves when it matters most.
This analysis explains what duration and credit quality mean in practice, uses the current Australian bond ETF landscape as a live case study, and clarifies how investors should evaluate these structural characteristics before selecting a fund.
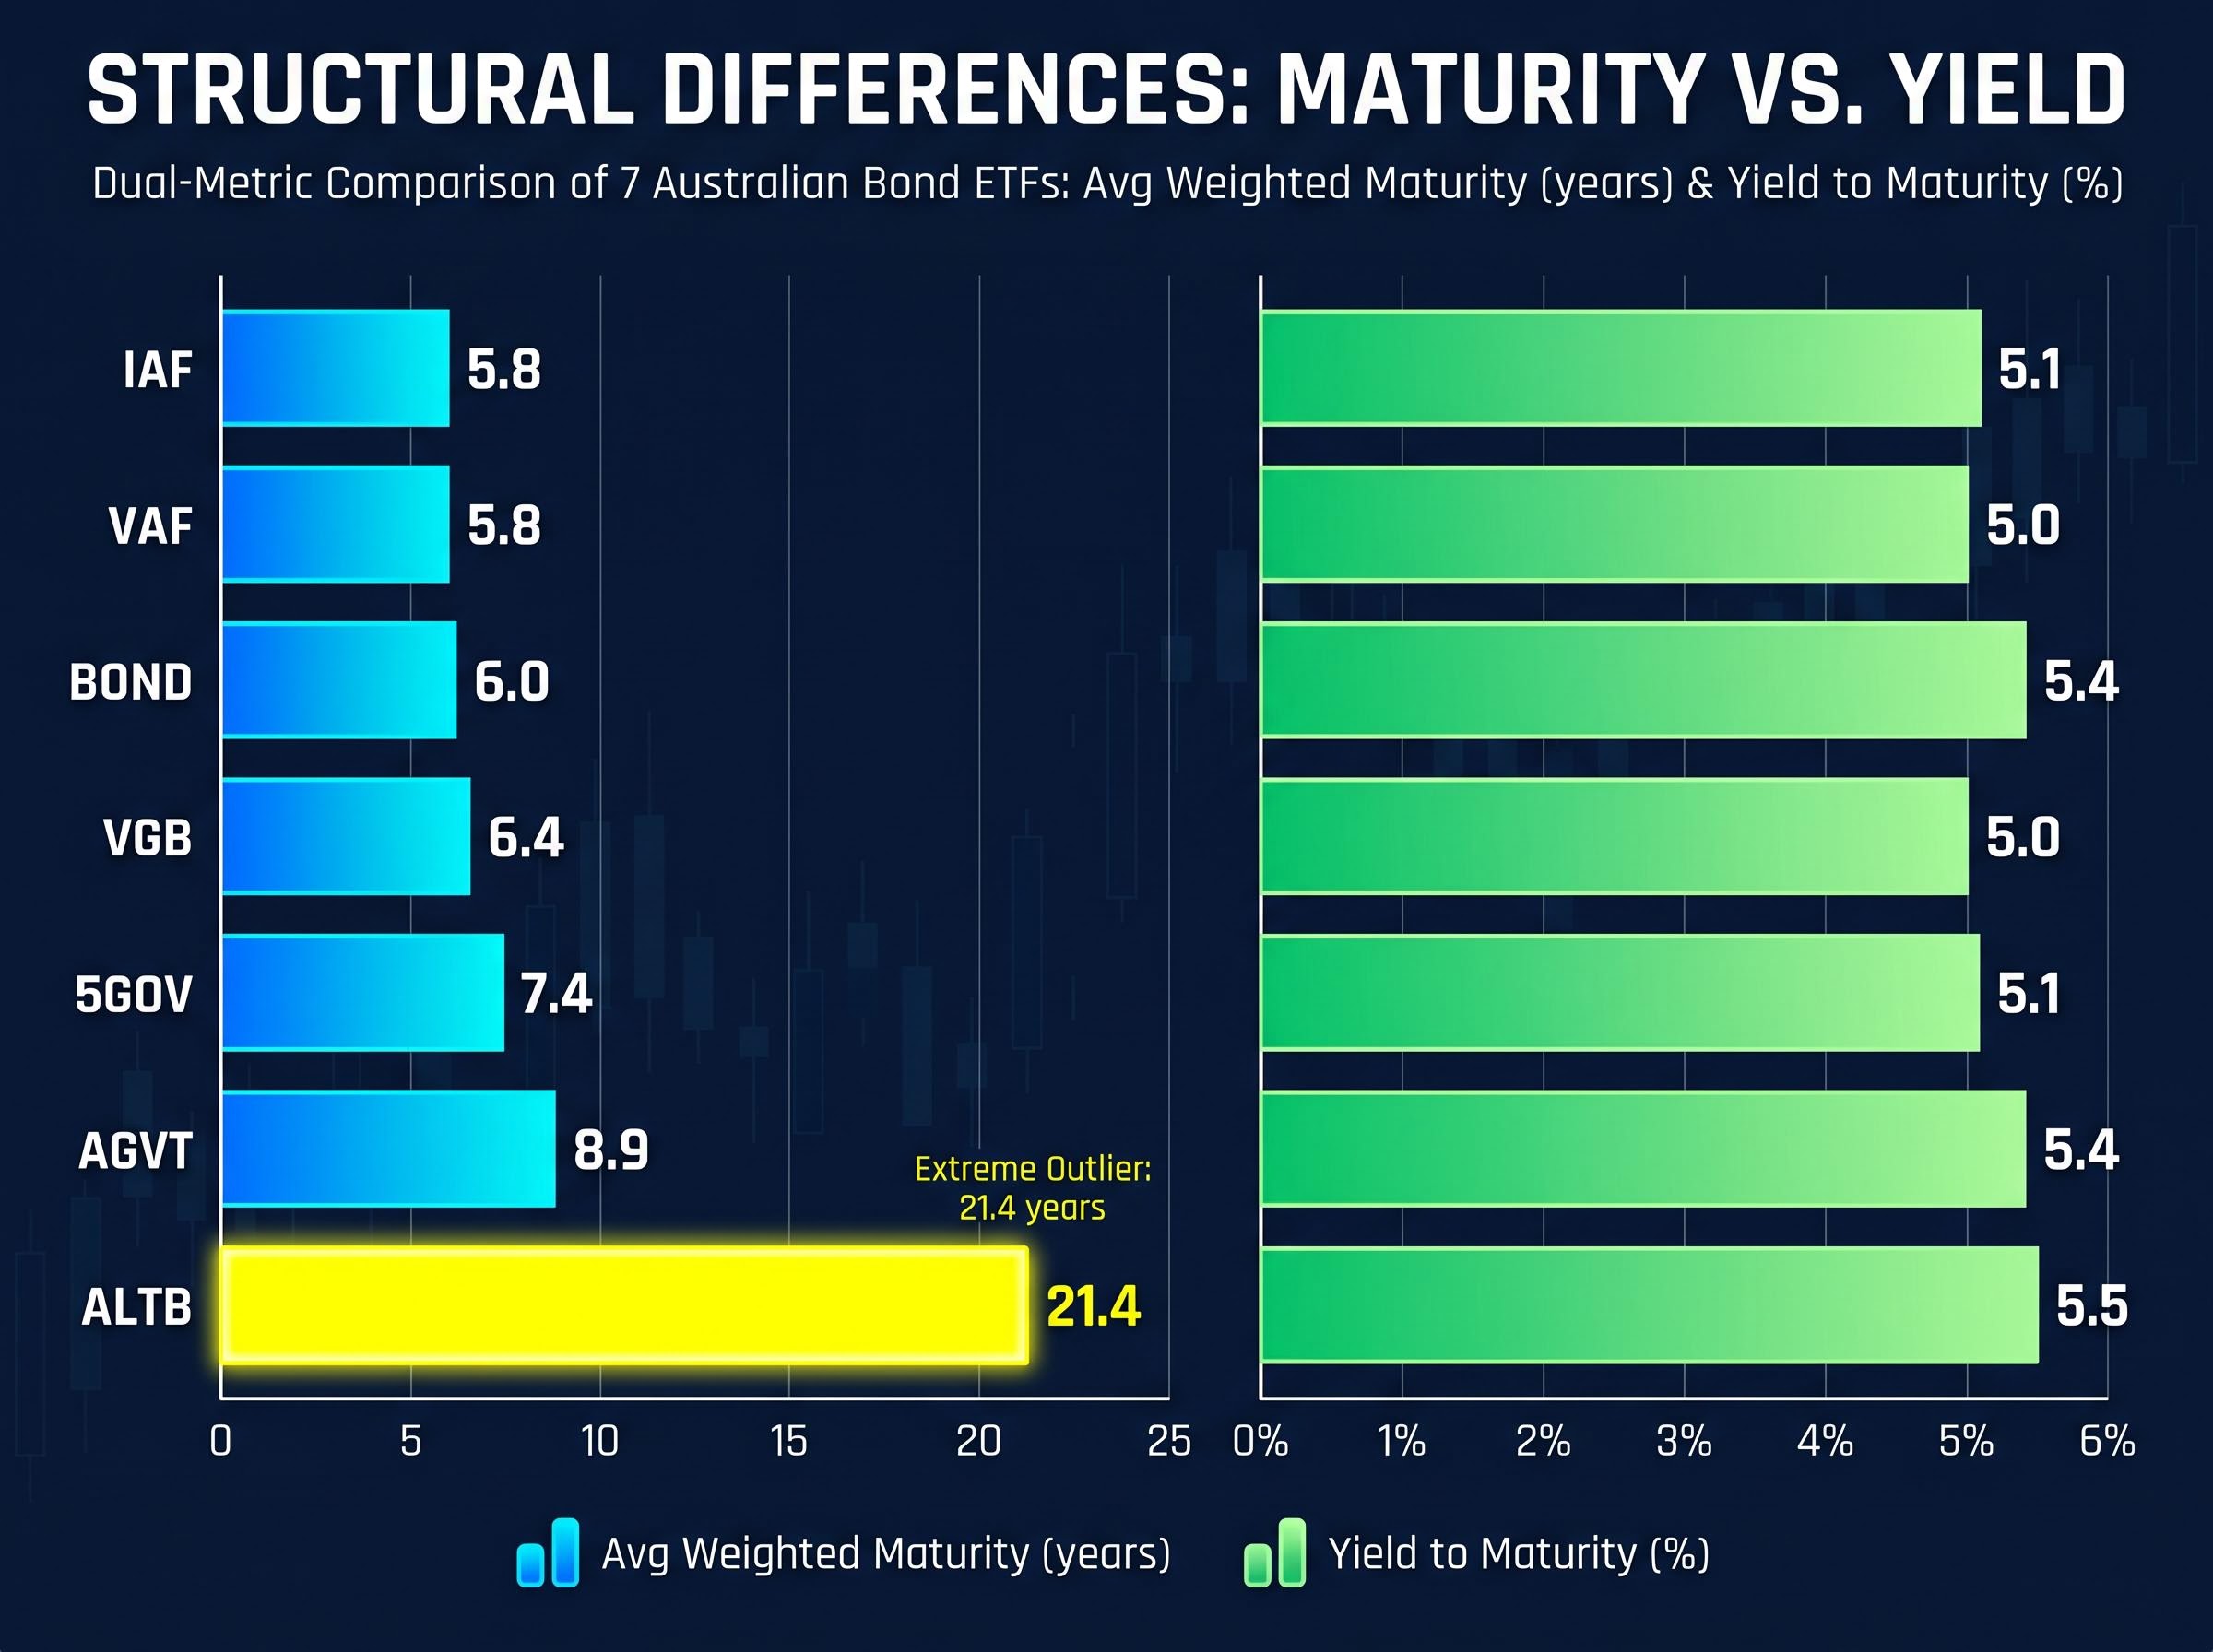
Line up the major Australian bond ETFs by two numbers, weighted average maturity and yield to maturity, and the structural differences become visible immediately.
| ETF | Avg Weighted Maturity (years) | Yield to Maturity (%) |
|---|---|---|
| IAF | 5.8 | 5.1 |
| VAF | 5.8 | 5.0 |
| BOND | 6.0 | 5.4 |
| VGB | 6.4 | 5.0 |
| 5GOV | 7.4 | 5.1 |
| AGVT | 8.9 | 5.4 |
| ALTB | 21.4 | 5.5 |
The yield column shows a narrow range; 50 basis points separate the highest from the lowest. The maturity column tells a different story.
ALTB carries a weighted average maturity of 21.4 years, nearly four times IAF’s 5.8 years. Both appear in the same product comparison tables. They are not the same type of instrument.
That maturity gap has consequences most retail investors do not intuitively grasp. Yield is easy to compare. What maturity does to capital is not.
Duration measures how sensitive a bond ETF’s price is to changes in interest rates. It is not simply the average time until bonds in the fund mature. It is a direct approximation of capital risk.
The practical rule is straightforward: a fund’s effective duration approximates the percentage capital loss for every 1% rise in yields.
That is the difference between a temporary portfolio drag and a drawdown that takes years to recover.
The February 2026 yield spike provided a live demonstration. ALTB fell 8.2% while short-duration peers declined approximately 2%. Portfolio manager Chris Cuffe warned that if yields rebound to 4.5%, ALTB holders could face 15-20% drawdowns. Morningstar Australia rated ALTB “neutral” for retail investors given the Q1 2026 volatility.
RBA Governor Michele Bullock indicated in April 2026 that retail portfolios with duration above 12 years face 10-15% capital loss exposure per 1% yield rise.
The Australian inflation trajectory heading into mid-2026 complicates duration positioning further: headline CPI reached 4.6% in March 2026 with the RBA’s preferred trimmed mean holding at 3.3%, a combination that places the yield outlook squarely at odds with the income thesis retail investors apply to long-duration bond ETFs.
Duration’s approximation is not perfectly linear. Convexity means that for large rate movements, the price effects are asymmetric: capital losses tend to be slightly smaller, and capital gains slightly larger, than the linear estimate suggests. This works in an investor’s favour on the upside, but it makes drawdown estimation harder in practice. According to Vanguard’s February 2026 investor education data, approximately 20% of retail investors misjudge this relationship.
Duration captures interest rate risk. Credit quality captures a separate axis entirely: default risk, and the degree to which a bond ETF moves in tandem with equities during periods of financial stress.
The investment-grade boundary sits at BBB- and above. Within Australian bond ETFs, the credit profiles split into three distinct categories:
Lower credit quality increases a bond ETF’s correlation with equities, which directly undermines the diversification purpose most investors assign to fixed income holdings. A bond ETF that falls alongside equities during a credit event is not performing its portfolio function.
ASIC’s Moneysmart guidance, updated in March 2026, flagged that 35% of investors overlook credit downgrade risks in semi-government-heavy funds such as IAF.
The distinction between yield-chasing behaviour and credit-aware portfolio construction matters here. SPIVA’s Mid-Year 2024 data showed 70% of active Australian bond fund managers failed to match their index benchmark over 10 years, reinforcing the discipline of index-based credit selection over manager-driven yield optimisation.
The SPIVA Australia Mid-Year 2025 Scorecard recorded an active manager underperformance rate of 67% over 10 years and 76% over 15 years in the Australian bond category, reinforcing the case for index-based credit selection as a structurally more reliable approach than manager-driven yield optimisation.
Theory is useful. Observed outcomes settle the argument.
In February 2026, the ASX fell 4.8% on US recession fears. ALTB dropped 3.5%. BOND and IAF each returned +0.1%. The fund with the highest yield failed as a diversifier on the day diversification mattered most.
The October 2025 equity drawdown told the same story from a different angle. When the ASX200 fell 5.2% on China trade fears, VGB declined just 0.4% and 5GOV fell 0.3%. ALTB dropped 2.1%, briefly correlating with equities rather than offsetting them.
In Q4 2025, VAF fell 1.2% against a 6% decline in Australian equities, confirming that intermediate-duration funds absorb equity stress meaningfully without the capital exposure of the long end.
The February 2026 drawdown is not an isolated event: the broader pattern of safe haven assets under supply shock shows that inflationary crises invert the usual relationship between fixed income and portfolio protection, with floating rate instruments like QPON substantially outperforming fixed rate alternatives such as VAF precisely because duration amplifies losses when the rate shock is driven by supply rather than demand.
| ETF | Oct 2025 Return | Feb 2026 Return | 1-Year Return (to Mar 2026) |
|---|---|---|---|
| BOND | — | +0.1% | +1.9% |
| VAF | — | — | +1.4% |
| IAF | — | +0.1% | +1.3% |
| VGB | -0.4% | — | +1.1% |
| AGVT | — | — | +0.8% |
| 5GOV | -0.3% | — | +0.7% |
| ALTB | -2.1% | -3.5% | -1.2% |
Over three years to March 2026, IAF, BOND, and VAF each returned approximately 2.0% annualised. AGVT returned 1.2% annualised. Over five years, VAF delivered +0.1% annualised while AGVT returned -1.1% annualised, illustrating how duration drag compounds across a rate-rise cycle.
The same structural characteristics that explain performance differences during volatility events also determine which fund is appropriate for which investor. Selection begins with portfolio purpose, not yield.
Implementation quality also matters. IAF carries the tightest bid/ask spread at 0.03%, the highest daily traded value at over $14 million, and the largest AUM at $3.62 billion. For retail investors executing smaller trades, these liquidity characteristics reduce transaction costs meaningfully.
| ETF | MER (%) | Bid/Ask Spread (%) | AUM ($B) | Avg Daily Traded Value |
|---|---|---|---|---|
| IAF | 0.10 | 0.03 | 3.62 | >$14M |
| VAF | 0.10 | 0.05 | 3.45 | — |
| BOND | 0.10 | — | — | — |
| AGVT | 0.22 | — | — | — |
| 5GOV | 0.22 | — | — | — |
| ALTB | 0.15 | 0.13 | 0.18 | $0.8M |
The RBA held the cash rate at 4.1% as of its February 2026 Monetary Policy Statement, with CPI running at 3.2% and upside inflation risks noted. UBS analysts predicted “duration discounting” for 2026, according to the Australian Financial Review in January 2026, favouring IAF and VAF over ALTB. Advisers are actively shifting clients from AGVT and ALTB toward shorter-duration funds. BetaShares SUBD, launched in September 2025 with $250 million in AUM by March 2026, represents an ultra-short alternative gaining retail traction as a “cash-plus” option.
Investors wanting to apply the duration and credit quality framework described here to a concrete shortlist of current candidates will find our dedicated guide to ASX bond ETFs for inflation, which assesses VBND, CRED, and four additional funds across income, diversification, and liquidity categories against the current 4.6% CPI and 4.35% RBA cash rate environment.
The RBA tightening cycle accelerated sharply into 2026, with three consecutive 25 basis point hikes lifting the cash rate to 4.35% by May and all four inflation measures remaining above the 2-3% target band, reinforcing why the intermediate-duration case described here is not merely a 2025 observation but an active portfolio concern for the months ahead.
The RBA February 2026 Statement on Monetary Policy details the central bank’s assessment of upside inflation risks and the rationale behind its cash rate settings, providing the macroeconomic backdrop against which duration risk in Australian bond ETFs must be evaluated.
ALTB yields 5.5% to maturity. IAF yields 5.1%. The 40-basis-point gap is real and visible in every product comparison table.
It is also misleading without duration context.
Yield to maturity measures only the income component of a bond ETF’s return. It excludes capital gains or losses, which over a three-to-five year holding period may dominate total return for a long-duration fund in a volatile rate environment. ALTB carried the highest yield in the group as of March 2026, yet its one-year total return was -1.2%. IAF returned +1.3%. VAF returned +1.4%.
Over five years, the compounding effect is starker: AGVT (longer duration) returned -1.1% annualised while VAF returned +0.1% annualised.
Yield to maturity measures income. Duration determines what happens to capital. Bond ETF selection that begins with yield and ignores duration is reading one column of a two-column ledger.
The inversion is specific and repeatable:
Historical context supports the broader point. Australian bonds delivered positive returns in 2018 and during the COVID-19 downturn, affirming that high-grade, shorter-duration exposure has historically acted as a portfolio stabiliser across cycles. Past performance does not guarantee future results, but the structural relationship between duration and capital risk persists regardless of the cycle.
The most consequential differences between Australian bond ETFs are structural, not superficial. Fees sit within a narrow band. Short-term return rankings shift quarter to quarter. Duration and credit quality determine how a fund behaves during the moments investors actually need fixed income to perform its portfolio role.
The decision hierarchy follows a clear sequence: start with portfolio purpose, then select an appropriate duration range, then filter by credit quality, then compare fees and liquidity as implementation variables.
ALTB is a legitimate instrument for investors with a specific rate-cut conviction and appropriate risk tolerance. It is not, however, a defensive bond holding. The February 2026 drawdown made that distinction with precision.
With the RBA maintaining a cash rate of 4.1% and inflation at 3.2%, the intermediate-duration case for funds like IAF and VAF remains intact for most retail investors seeking genuine equity portfolio diversification. Duration and credit quality are not secondary details in bond ETF selection. They are where the analysis begins.
This article is for informational purposes only and should not be considered financial advice. Investors should conduct their own research and consult with financial professionals before making investment decisions.
Duration measures how sensitive a bond ETF's price is to changes in interest rates. As a practical rule, a fund's effective duration approximates the percentage capital loss for every 1% rise in yields, meaning a fund with 17 years of duration like ALTB could lose roughly 17% of capital for each 1% yield increase.
Yield to maturity measures only the income component of a bond ETF's return and excludes capital gains or losses. As demonstrated in the 12 months to March 2026, ALTB carried the highest yield at 5.5% yet delivered a negative total return of -1.2%, while lower-yielding IAF and VAF returned +1.3% and +1.4% respectively because their shorter duration protected capital.
Lower credit quality increases a bond ETF's correlation with equities during periods of financial stress, undermining its diversification purpose. Government-only funds such as VGB and 5GOV, backed by AAA-rated sovereign bonds, have historically provided the most reliable offset during equity drawdowns compared to funds with broader credit exposure.
Short-to-intermediate government bond funds such as VGB, 5GOV, IAF, and VAF are most reliably suited to offsetting equity drawdowns, as demonstrated in February 2026 when BOND and IAF each returned +0.1% while the ASX fell 4.8%. The specific choice depends on whether an investor prioritises sovereign-only credit quality or accepts semi-government exposure for marginally higher yield.
Retail investors should start with portfolio purpose before comparing yields or fees: for equity diversification, intermediate-duration funds like IAF and VAF are appropriate; for a specific rate-cut directional trade with higher risk tolerance, a long-duration fund like ALTB may be considered, though advisers recommend capping long-duration exposure at no more than 20% of a fixed income allocation.