Vanguard VIHY Declares First Distribution at 49.49 Cents per Unit
3 mins ago
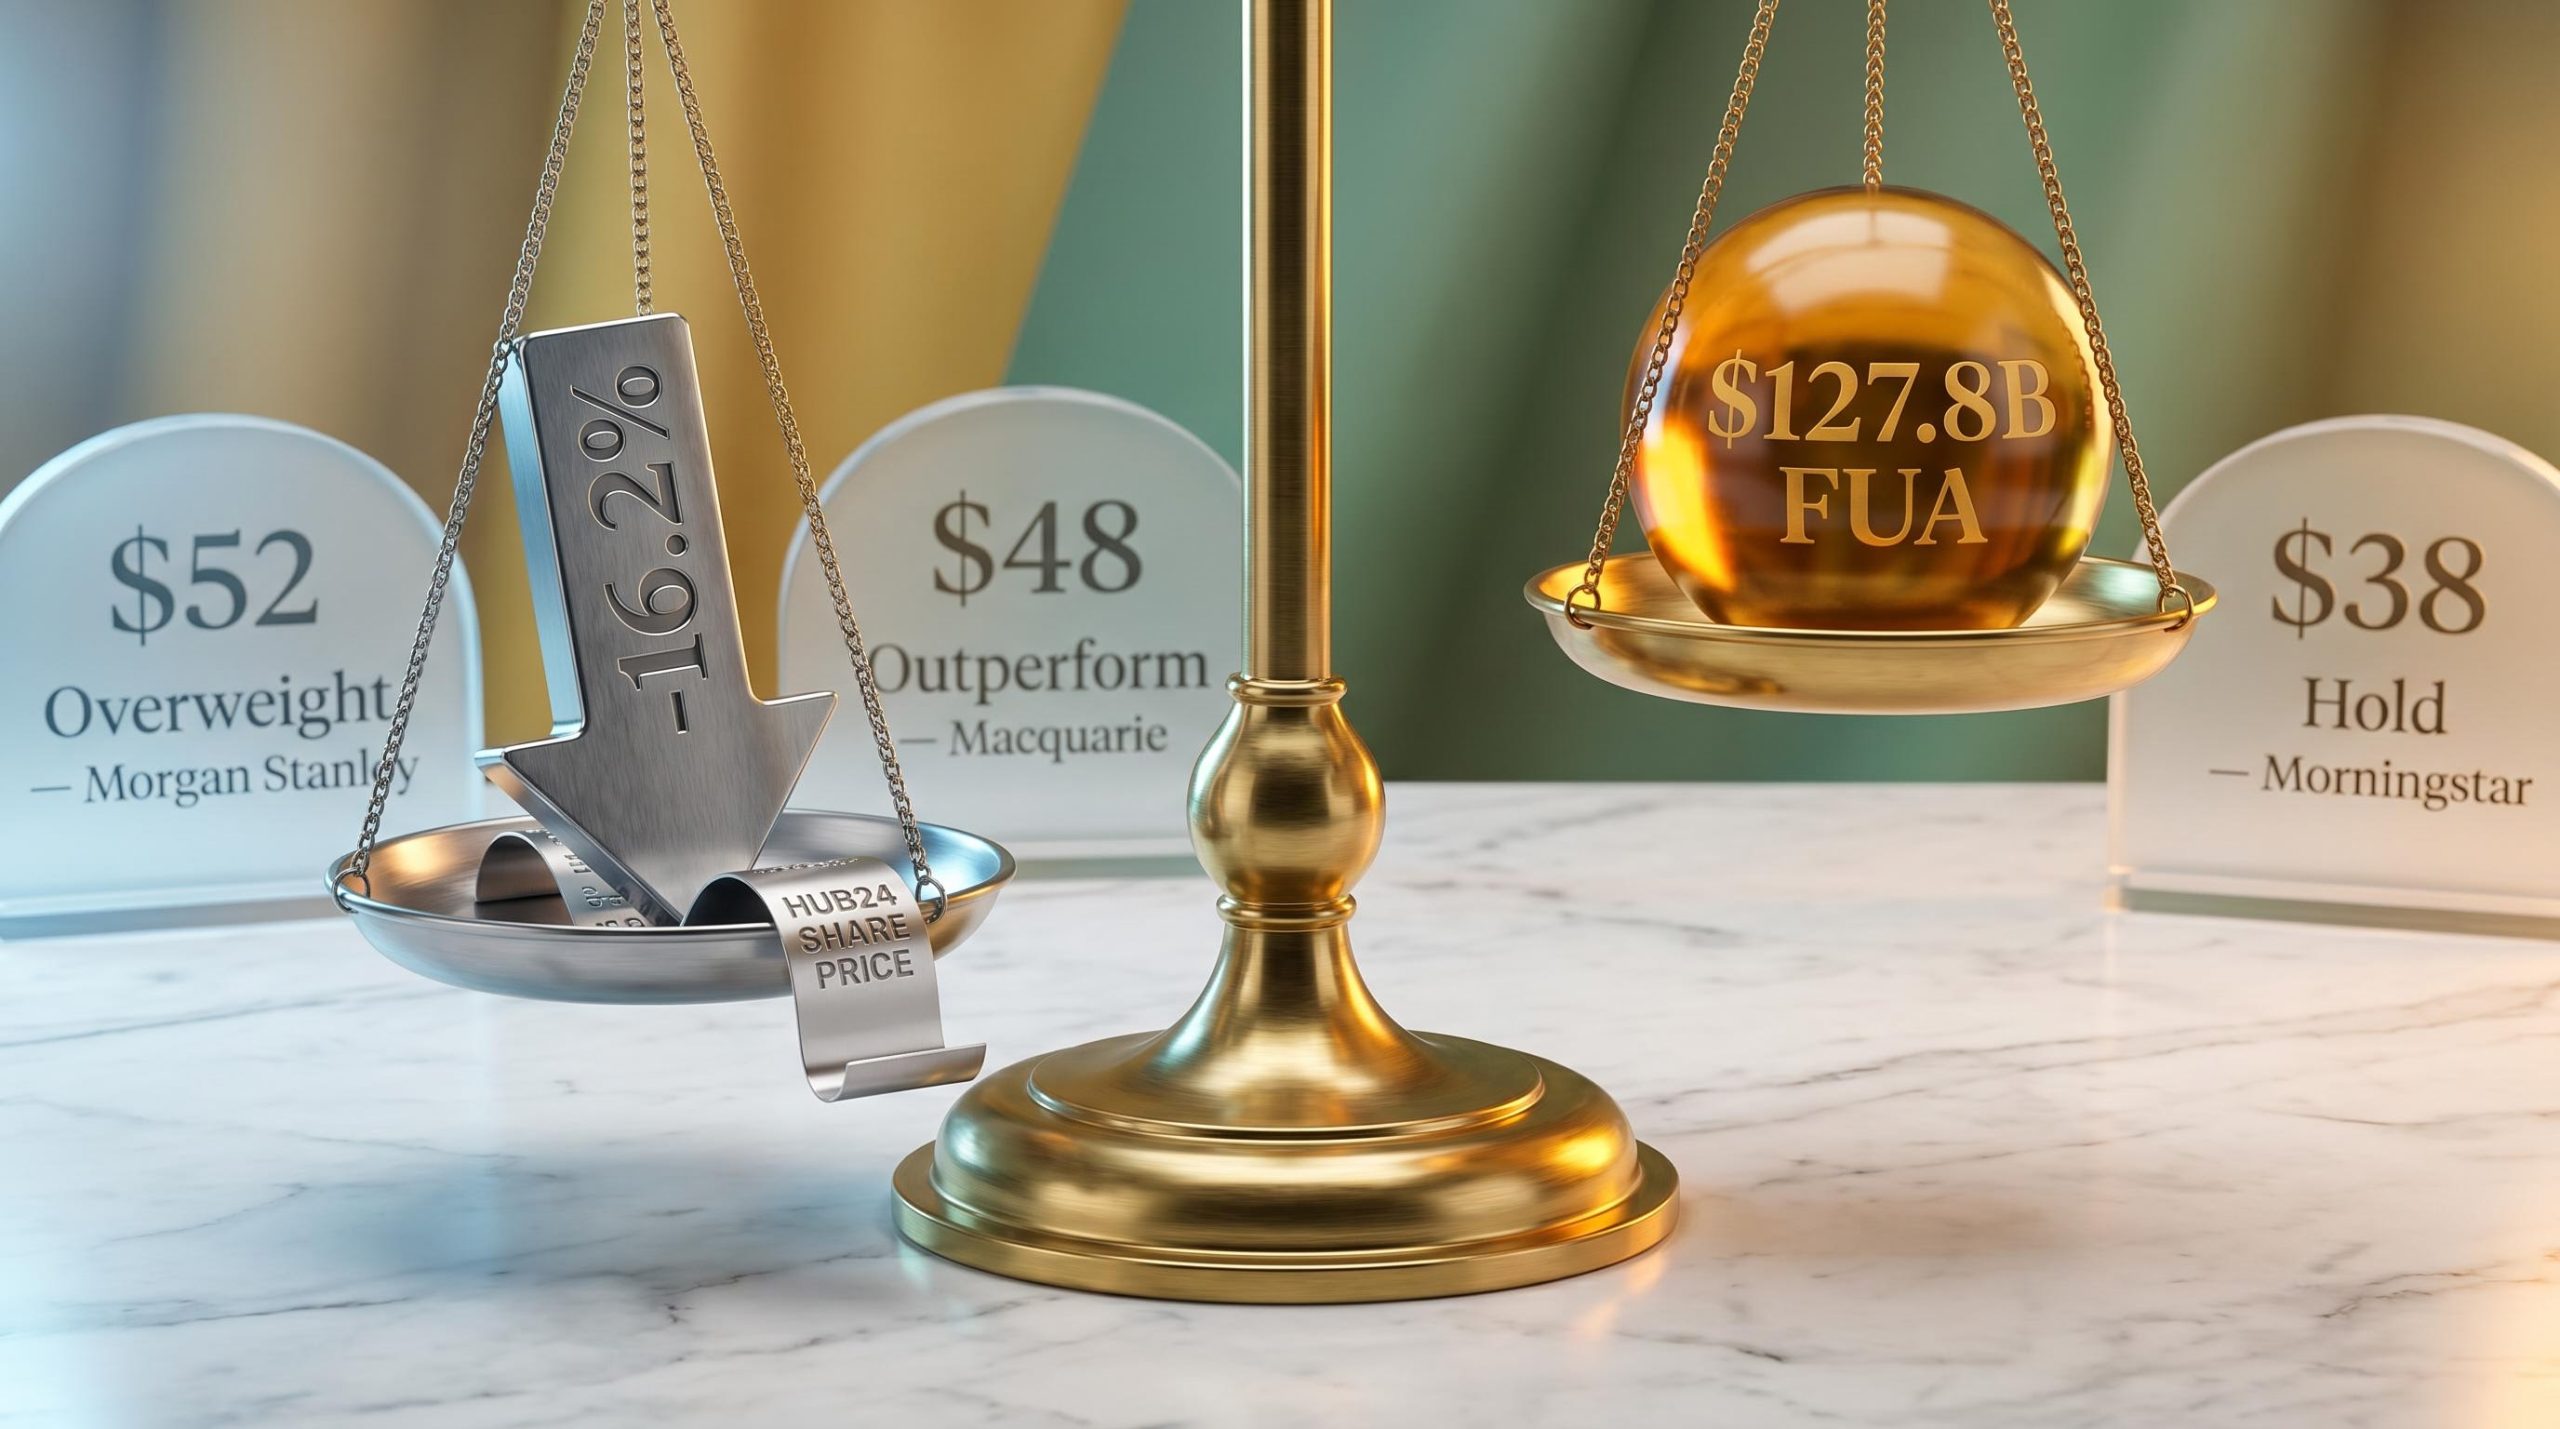
Hub24’s share price has fallen 16.2% since the start of 2025, yet the platform it operates now holds $127.8 billion in funds under administration (FUA) and continues to deliver double-digit revenue growth. That gap between operational momentum and share price trajectory is the central tension for Australian investors weighing the stock after its pullback. The company sits at the intersection of two structural tailwinds: the ongoing migration of financial advisers from legacy bank platforms to independents, and a continuing boom in self-managed superannuation fund (SMSF) establishment across Australia. This analysis walks through Hub24’s three-product business model, quantifies its historical revenue and profit growth, assesses what its current return on equity signals about capital efficiency, examines the competitive field, and synthesises what three major brokers say about valuation after the decline.
The numbers are stark. From January 2025 through to May 2026, Hub24’s share price declined 16.2%. Over the same period, the operational story moved in the opposite direction.
The company’s Q3 FY26 Market Update, released 21 April 2026, reported the following asset figures as at 31 March 2026:
$151.7 billion in total funds under administration as at 31 March 2026, up from group FUA/FUM of $95.7 billion reported as at 31 December 2025.
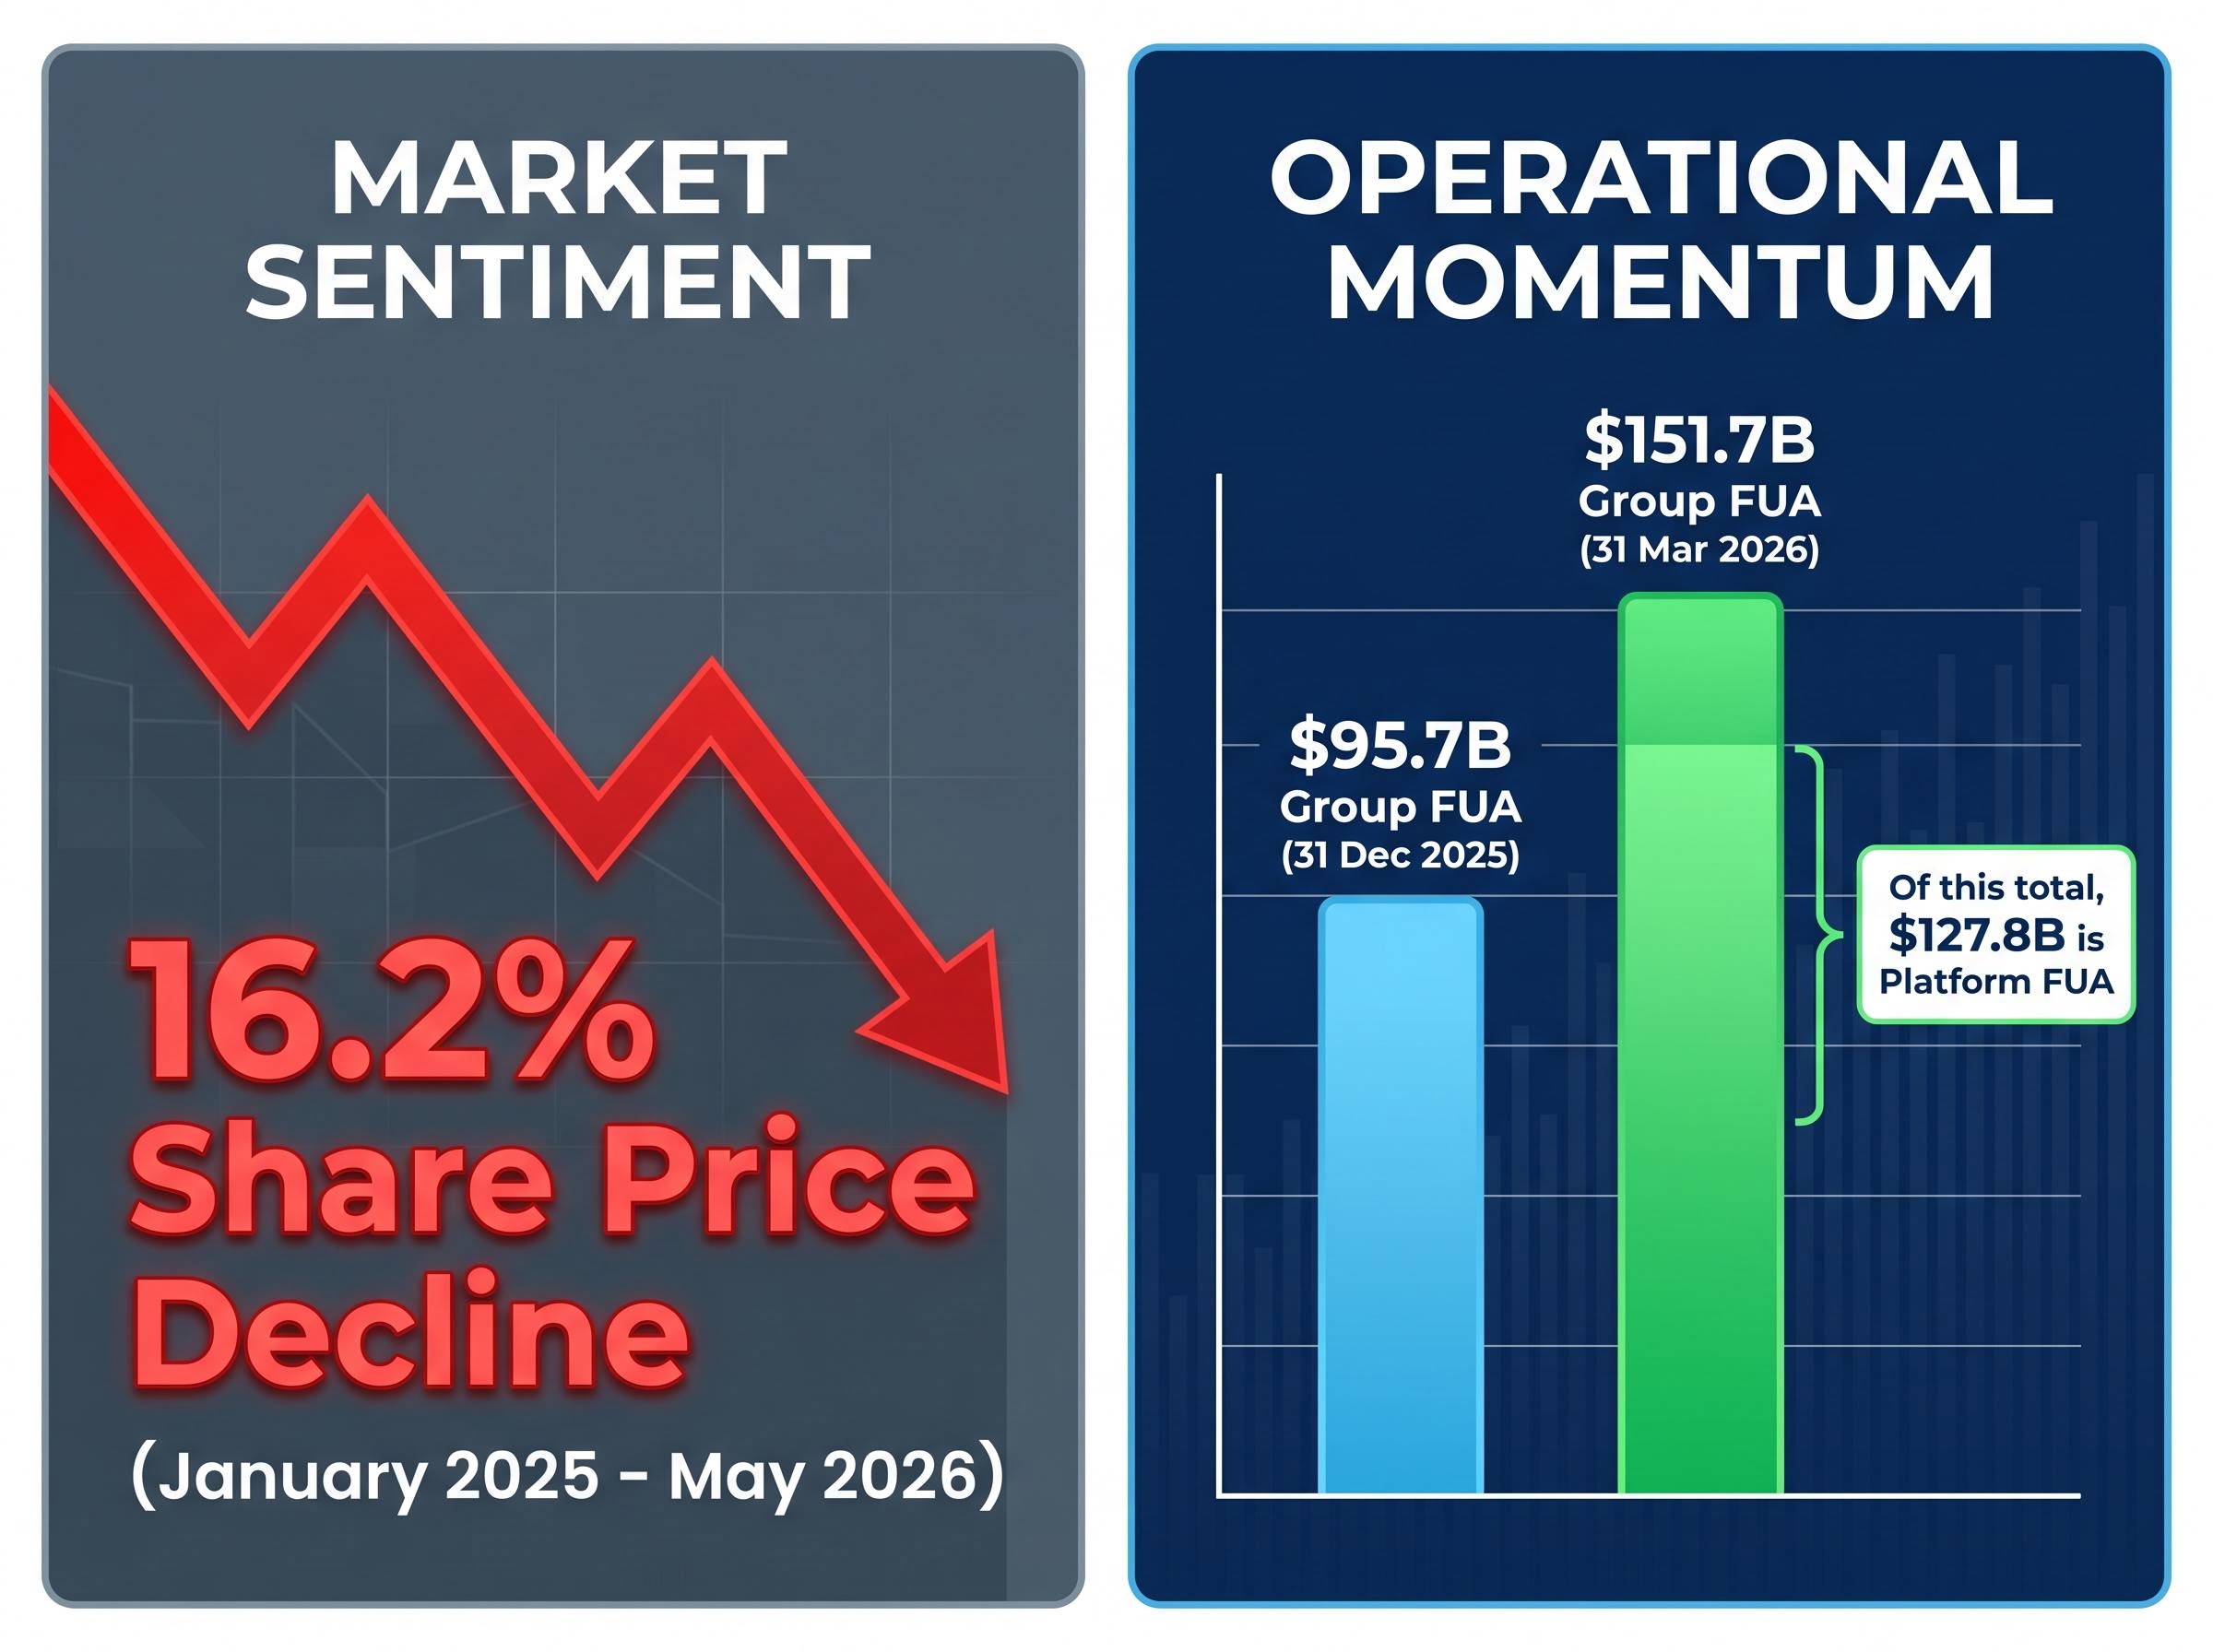
That sequential jump deserves scrutiny. Market-wide volatility and softer equity returns through 2025 created headwinds for all platform stocks, not Hub24 specifically. The sell-off reflected a sector-wide repricing of growth multiples rather than anything unique to the company’s operations. The question that frames the rest of this analysis is whether the price decline represents a deterioration in fundamentals or an external sentiment reset against a business that kept compounding underneath.
The platform migration dynamics visible in recent market activity illustrate the structural tailwind concretely: Generation Development Group completed an $1.8 billion transfer of managed discretionary account portfolios from Xplore Wealth onto the HUB24 platform in May 2026, a transaction that simultaneously expanded HUB24’s FUA and validated its position as the destination platform of choice for MDA consolidations.
Hub24, established in 2007, operates three interconnected products that together form what management describes as a whole-of-wealth proposition. The interlocking nature of these products matters: losing one to a competitor is harder than it might appear on a standalone basis.
| Product | Primary Customer | Core Function | Key Growth Driver |
|---|---|---|---|
| HUB24 Platform | Financial advisers and their clients | Investment platform providing access to managed funds and investment products | Adviser migration from legacy bank platforms |
| Class | Accountants, administrators, advisers | SMSF administration software covering portfolio management, legal documentation, and regulatory compliance | Structural growth in SMSF establishments |
| myprosperity | Accountants, advisers, and their end clients | Client portal for wealth visibility, document sharing, and engagement | Deepening ecosystem retention and cross-sell |
The HUB24 investment platform is the core revenue engine. It was awarded Overall Best Platform in the 2024 Adviser Ratings Financial Advice Landscape Report and ranked first for Overall Satisfaction and Brand Image in the 2024 Wealth Insights Platform Service Level Report.
Class benefits directly from SMSF volume growth regardless of whether new funds are established with financial advice. According to data reported by Professional Planner in February 2026, 80% of FY25 SMSF establishments occurred without advice. That statistic matters: it means the Class addressable market expands even when adviser headcount stalls.
The SMSF sector itself is substantial. ATO data updated 18 March 2026 showed over 653,000 SMSFs with total assets of $1.05 trillion as at 30 June 2025. Padua WealthData, published 31 January 2026, reported 663,867 SMSFs as at 31 December 2025, with 48,464 new establishments in calendar 2025, up from 37,701 in 2024.
The ATO’s latest SMSF statistics confirm the sector’s scale, recording over 653,000 funds holding $1.05 trillion in total assets as at 30 June 2025, a base that continues to expand with each new wave of fund establishments and provides the structural volume from which Class derives its recurring software revenue.
myprosperity, the client portal layer, deepens adviser and accountant retention within the Hub24 ecosystem by giving end clients a single view of their wealth. The stickiness this creates is cumulative rather than transactional.
SMSF trustees using Class to administer their funds face a related governance obligation beyond software compliance: fund manager mandate fidelity within the SMSF’s own investment strategy requires periodic review, particularly when underlying fund managers quietly shift their portfolio behaviour away from the mandate that justified their inclusion in the trust’s investment strategy.
The compounding trajectory first.
Hub24 delivered 44.4% annualised revenue growth from 2021 to FY24, placing it among the fastest-growing platform businesses listed on the ASX over that period.
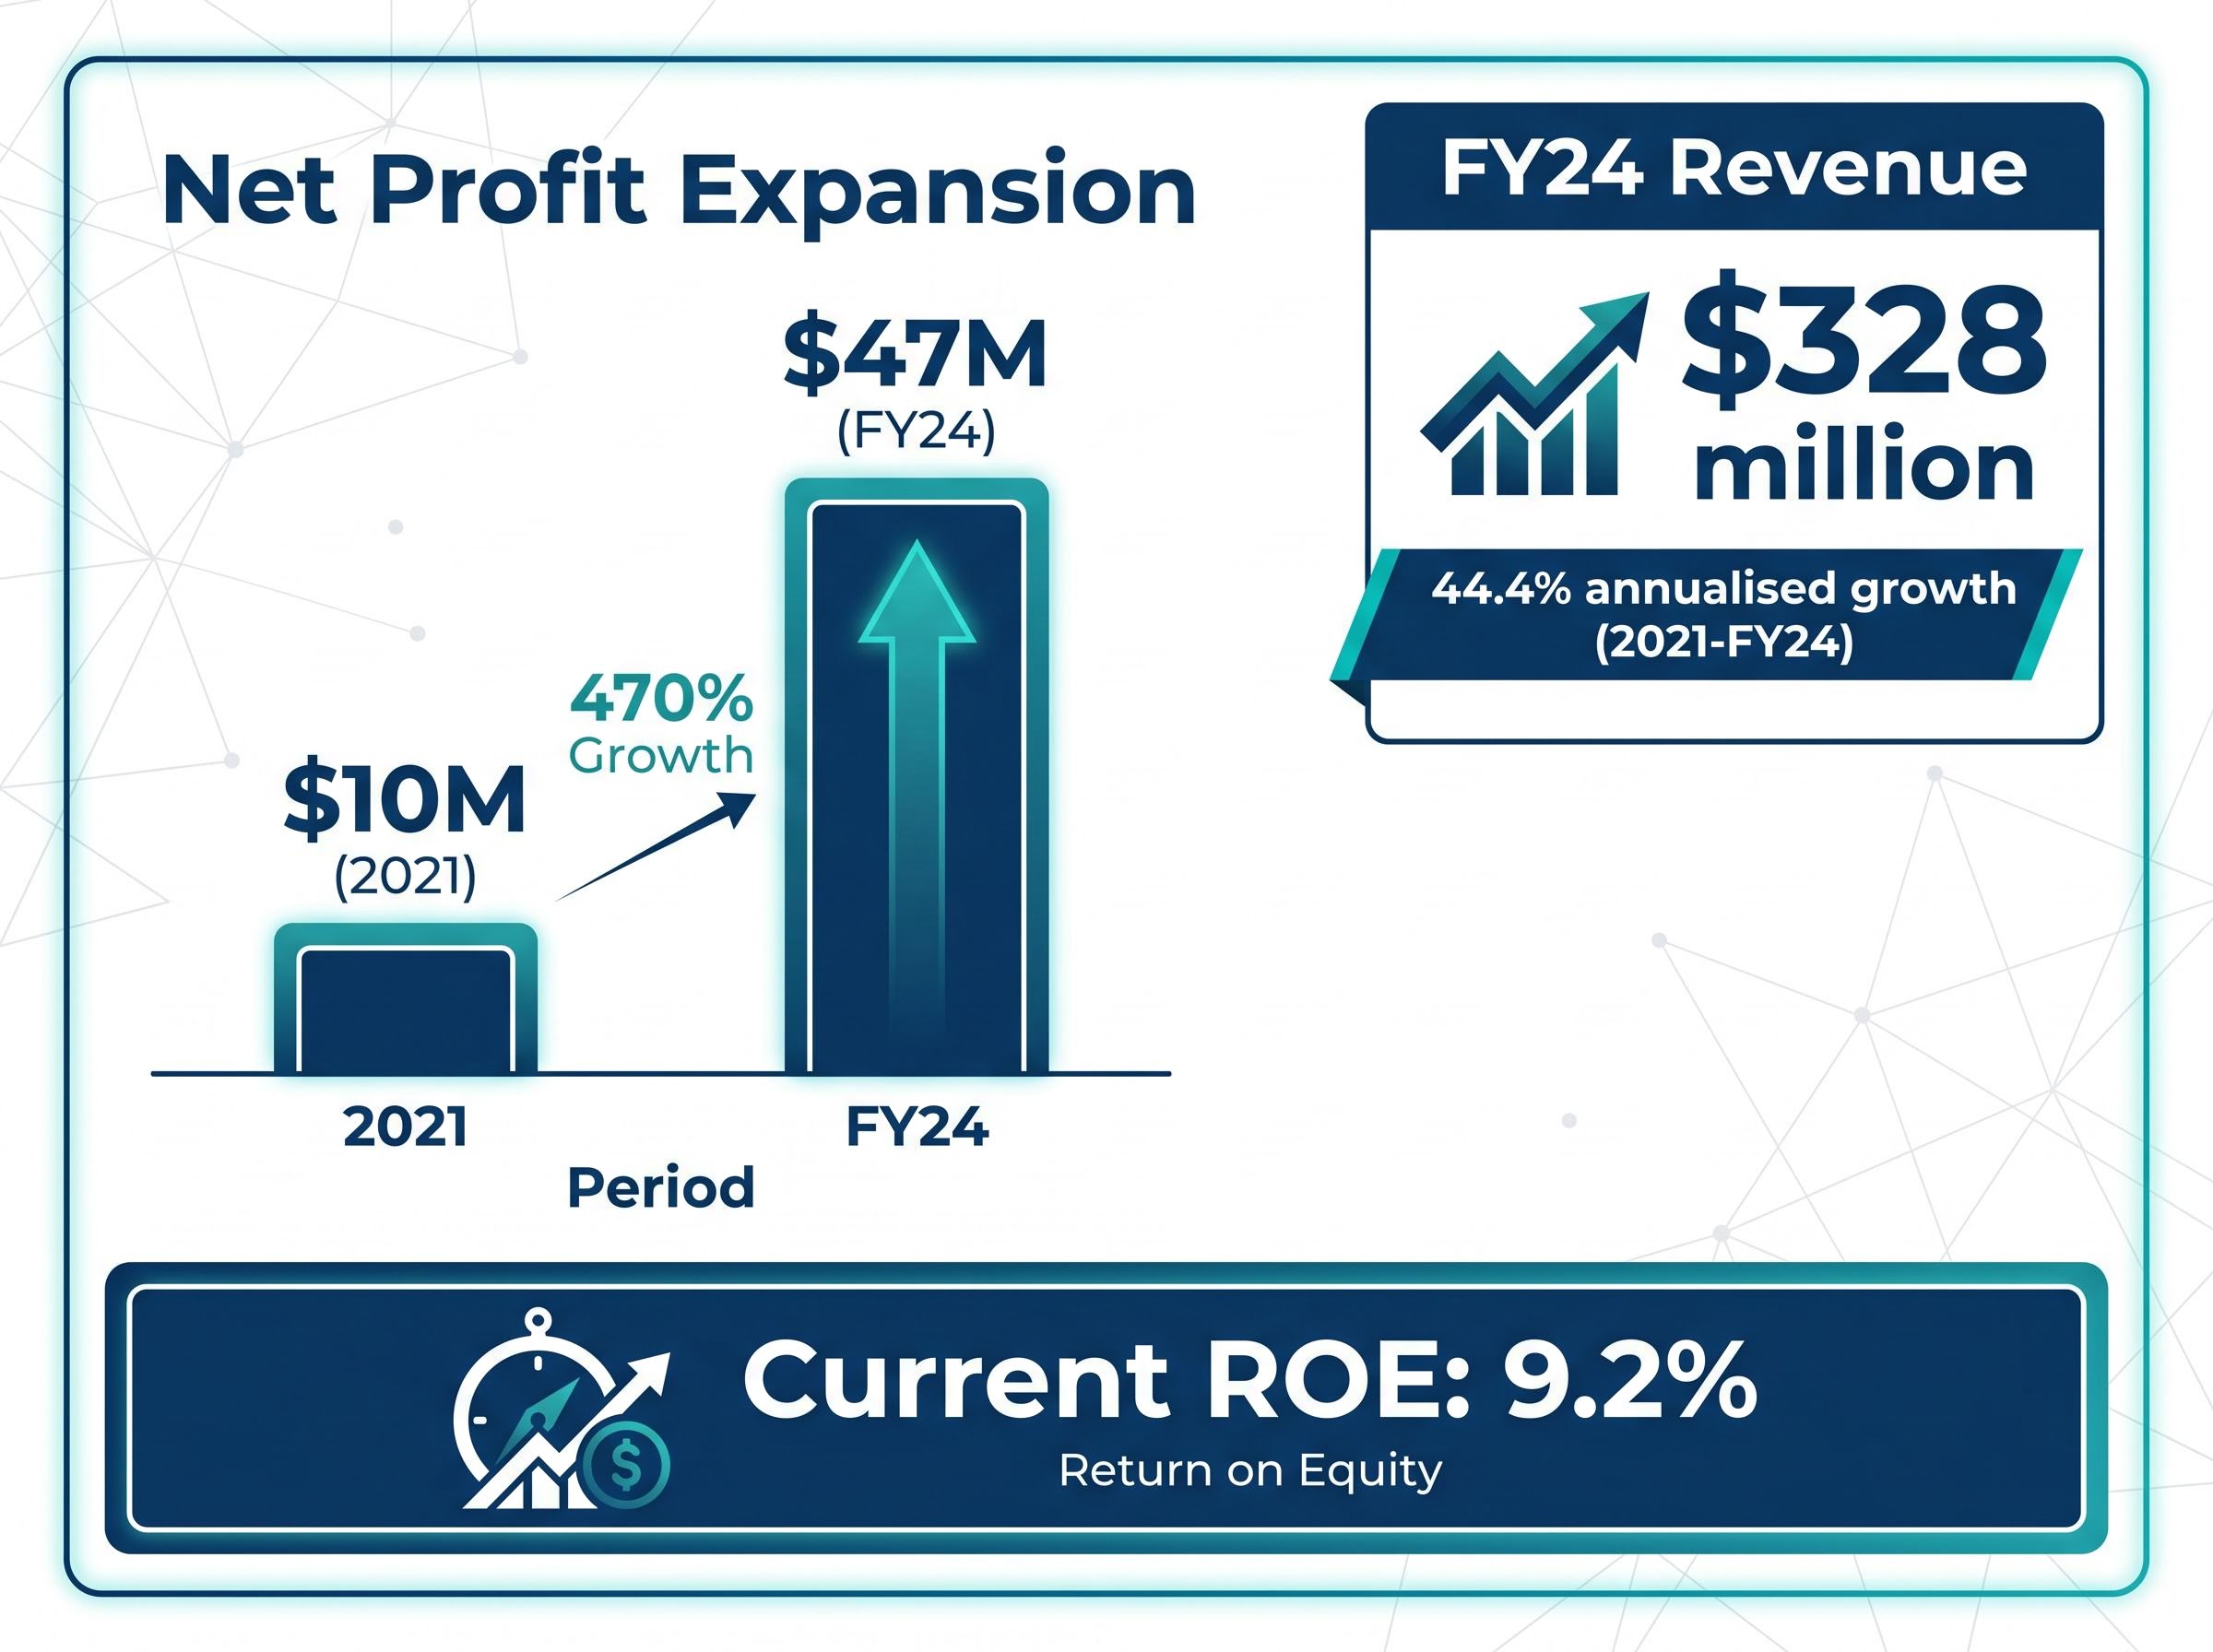
FY25 results, released 28 August 2025, showed continued revenue growth from the $328 million FY24 base. The 1H FY26 results, released 21 February 2026, confirmed continued double-digit revenue growth alongside margin expansion from operating leverage as FUA scales. Management reaffirmed the medium-term platform FUA target of $120-$150 billion by FY28, a target the company had already exceeded at $127.8 billion as at March 2026.
Return on equity (ROE) measures how much profit a company generates for every dollar of shareholder equity. It answers a simple question: how efficiently is this business converting its capital base into earnings?
Hub24’s most recently reported ROE stands at 9.2%. In the context of 44.4% revenue growth, that figure warrants attention. A 9.2% ROE sits below the broader ASX average and may reflect the company’s ongoing investment phase, acquisition costs associated with Class and myprosperity, and the capital intensity of scaling a platform business. This is not necessarily a sign of structural inefficiency; it may indicate a business still deploying capital into growth rather than optimising for near-term returns. Both numbers together, the growth rate and the ROE, provide a more honest picture of where Hub24 sits in its maturity curve than either metric alone.
The tension between Hub24’s 9.2% ROE and its 44.4% revenue CAGR is precisely the kind of analytical problem that makes valuing growth stocks on the ASX structurally different from applying the same metrics to mature industrials or banks, where ROE stability and dividend yield carry far more interpretive weight.
Hub24 is winning the larger war while facing a sharpening contest in its own tier.
The structural shift away from legacy bank platforms, including BT Panorama and AMP, toward independent next-generation platforms remains the primary tailwind. The Investment Trends 2025 Adviser Technology and Investment Platforms Report confirmed that Hub24, Netwealth, and CFS Edge continue to gain share from these incumbents.
Professional Planner reported in May 2025 that platform consolidation among smaller licensees and white-label platforms was funnelling adviser migrations predominantly toward Hub24, Netwealth, or CFS Edge. That structural consolidation benefits all three.
The contest among the independents, however, is intensifying. According to Money Management, 15,135 advisers were on the Financial Adviser Register (FAR) as at mid-April 2026. Padua WealthData reported the asset opportunity per adviser reached $68 million in Q4 2025, up from $62 million in Q4 2024 and $22 million in Q4 2018. The pool of advisers is finite; the value each adviser controls is rising.
| Competitor | Platform Tier | Key Strength | Threat Level to Hub24 |
|---|---|---|---|
| Netwealth | Independent / Next-gen | Off-platform asset integration, advice workflow tools | High (direct peer) |
| CFS Edge | Independent / Institutional hybrid | Growing feature set, FNZ technology backing | High (accelerating) |
| Praemium | Independent / SMA-focused | Managed accounts and SMA capabilities | Moderate (niche overlap) |
| BT Panorama / AMP | Legacy / Institutional | Existing adviser base and brand recognition | Low (losing share structurally) |
Professional Planner reported in September 2024 that CFS Edge’s growing feature set was placing it in more direct competition with Hub24 and Netwealth for independent financial adviser flows.
Netwealth’s share price pullback of 12.6% over the same period tells a related but distinct story: net inflows and FUA growth remained strong at Netwealth while net profit margin compressed sharply from 35.4% to 15.71%, a divergence that sharpens the question of whether Hub24’s margin trajectory justifies its premium over its closest peer.
Five risk categories deserve honest engagement rather than a compliance-style listing.
80% of FY25 SMSF establishments occurred without financial advice, according to Class data reported by Professional Planner. This figure reframes the adviser-numbers risk: Class’s growth is not entirely tethered to the adviser population.
The risks are real but largely industry-wide rather than company-specific. That distinction matters when assessing whether a decline in the share price represents a structural warning or a sentiment-driven discount.
The spread between broker targets tells the story of a genuine analytical disagreement, not background noise.
| Broker | Rating | Price Target | Core Rationale |
|---|---|---|---|
| Morgan Stanley | Overweight | $52 | Attractive entry point for long-term growth investors |
| Macquarie | Outperform | $48 | High-quality compounder with under-appreciated margin expansion |
| Morningstar | 3-star Hold | $38 | Pullback returns stock to fair value, not deep value |
Macquarie described Hub24 as “a high-quality compounder” and characterised the 2025 share price weakness as a buying opportunity, while acknowledging near-term earnings risk from softer market returns.
Wilsons placed Hub24 on its conviction buy list in October 2025, noting via Livewire Markets that the sell-off had pushed the stock to an implied FY26 price-to-earnings ratio in the low-20s versus the high-20s previously.
The $38-$52 range reflects a specific disagreement: how much of Hub24’s long-term growth should the market pre-pay for? Morgan Stanley and Macquarie argue the answer is “more than the current price reflects.” Morningstar’s position is that the pullback has simply corrected an overvaluation rather than creating a new opportunity.
The analytical threads converge on a company with strong structural positioning, an impressive growth history, modest current ROE, credible broker support at or above prevailing levels, and real but manageable risks.
The bull case rests on Hub24’s positioning as a long-term compounder with meaningful upside to the $48-$52 broker targets, supported by platform tailwinds that remain intact. The medium-term FUA target of $120-$150 billion by FY28 has already been exceeded at $127.8 billion, implying a potential upward revision. The bear case, anchored by Morningstar’s $38 fair value estimate, holds that the stock is roughly fairly valued after the pullback rather than cheaply priced, with integration risk and market sensitivity creating genuine uncertainty.
Hub24 is not a distressed value opportunity. It is a high-quality growth company trading at a lower multiple than it commanded in 2024. Whether that distinction represents an attractive entry point depends entirely on an investor’s time horizon and expectations for sustained platform growth.
This article is for informational purposes only and should not be considered financial advice. Investors should conduct their own research and consult with financial professionals before making investment decisions. Past performance does not guarantee future results. Financial projections are subject to market conditions and various risk factors.
Hub24 is an ASX-listed wealth platform business that earns revenue primarily through its HUB24 investment platform, which charges fees based on funds under administration, alongside its Class SMSF administration software and myprosperity client portal products.
Hub24's share price declined approximately 16.2% from January 2025, reflecting a sector-wide repricing of growth multiples driven by market volatility and softer equity returns, rather than any deterioration specific to the company's operations or competitive position.
Funds under administration (FUA) is the total value of client assets held on a platform, and it matters because Hub24's fee revenue is directly linked to FUA levels, meaning rising markets and net inflows increase earnings while falling markets reduce them mechanically.
Broker targets range from $38 (Morningstar, fair value after pullback) to $52 (Morgan Stanley, Overweight), with Macquarie setting a $48 Outperform target and describing Hub24 as a high-quality compounder where 2025 weakness represents a buying opportunity.
Growth in self-managed superannuation fund establishments directly expands the addressable market for Hub24's Class software division, with 48,464 new SMSFs established in 2025 alone and ATO data confirming over 653,000 funds holding $1.05 trillion in total assets as at June 2025.