Warsh Nears Fed Chair as 10-Year Yield Hits June 2025 High
5 mins ago

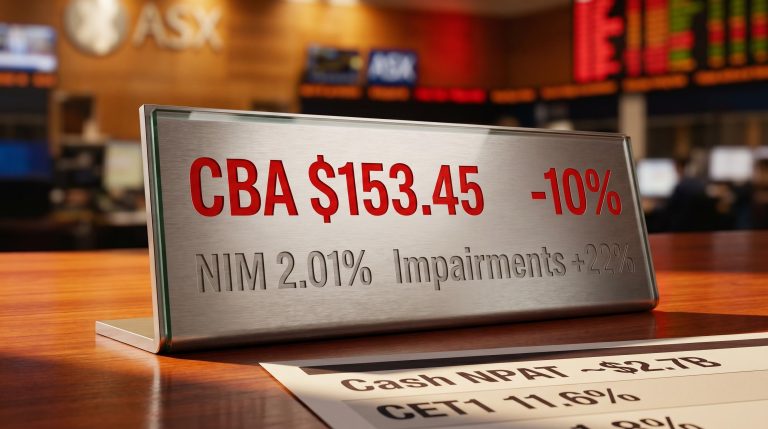
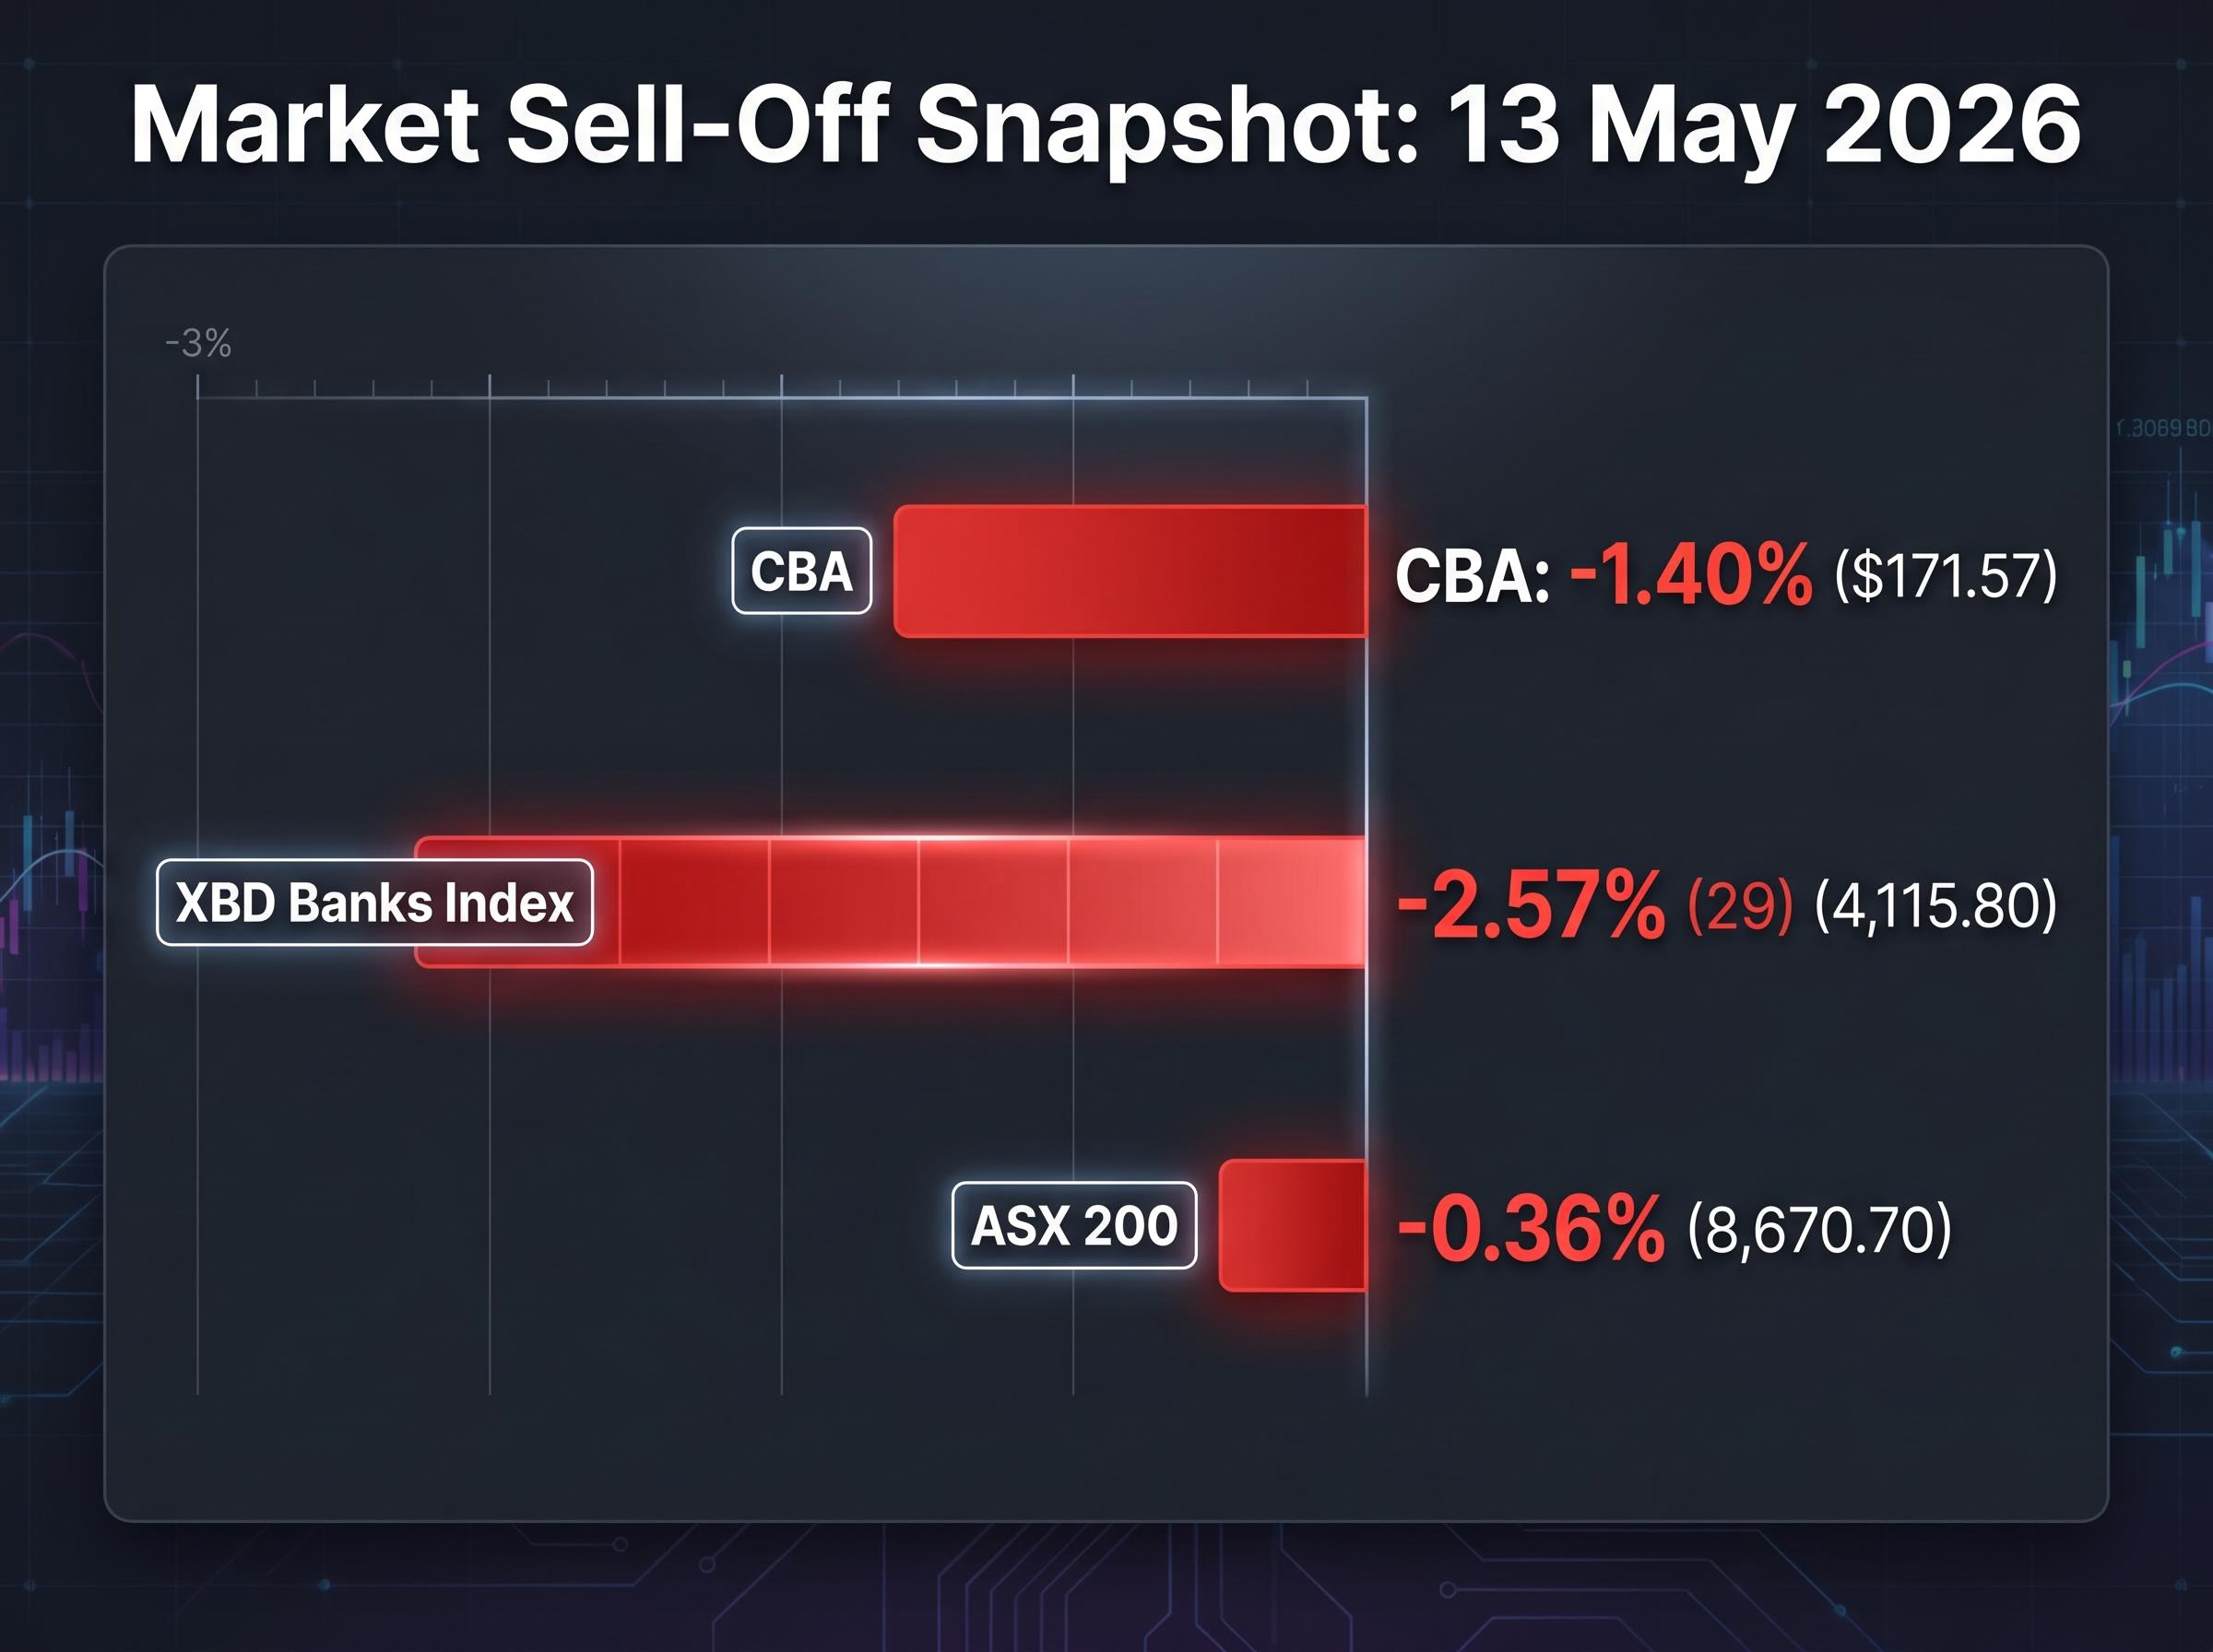
Commonwealth Bank of Australia shares were down 1.40% on Wednesday morning, trading at $171.57, as investors digested a March quarter update that showed profit declining relative to the first-half average despite headline year-on-year growth. The move came the morning after CBA released its unaudited Q3 FY2026 trading update on 12 May 2026, covering the three months to 31 March 2026. The broader banking sector also fell, with the S&P/ASX 200 Banks Index (XBD) down 2.57% against an ASX 200 that lost only 0.36%, signalling that CBA’s result landed poorly across the sector, not just in isolation.
What follows unpacks the specific figures behind the sell-off, separates what the numbers actually confirm from market noise, and helps retail investors assess whether the reaction reflects genuine fundamental deterioration or an overcorrection against elevated expectations.
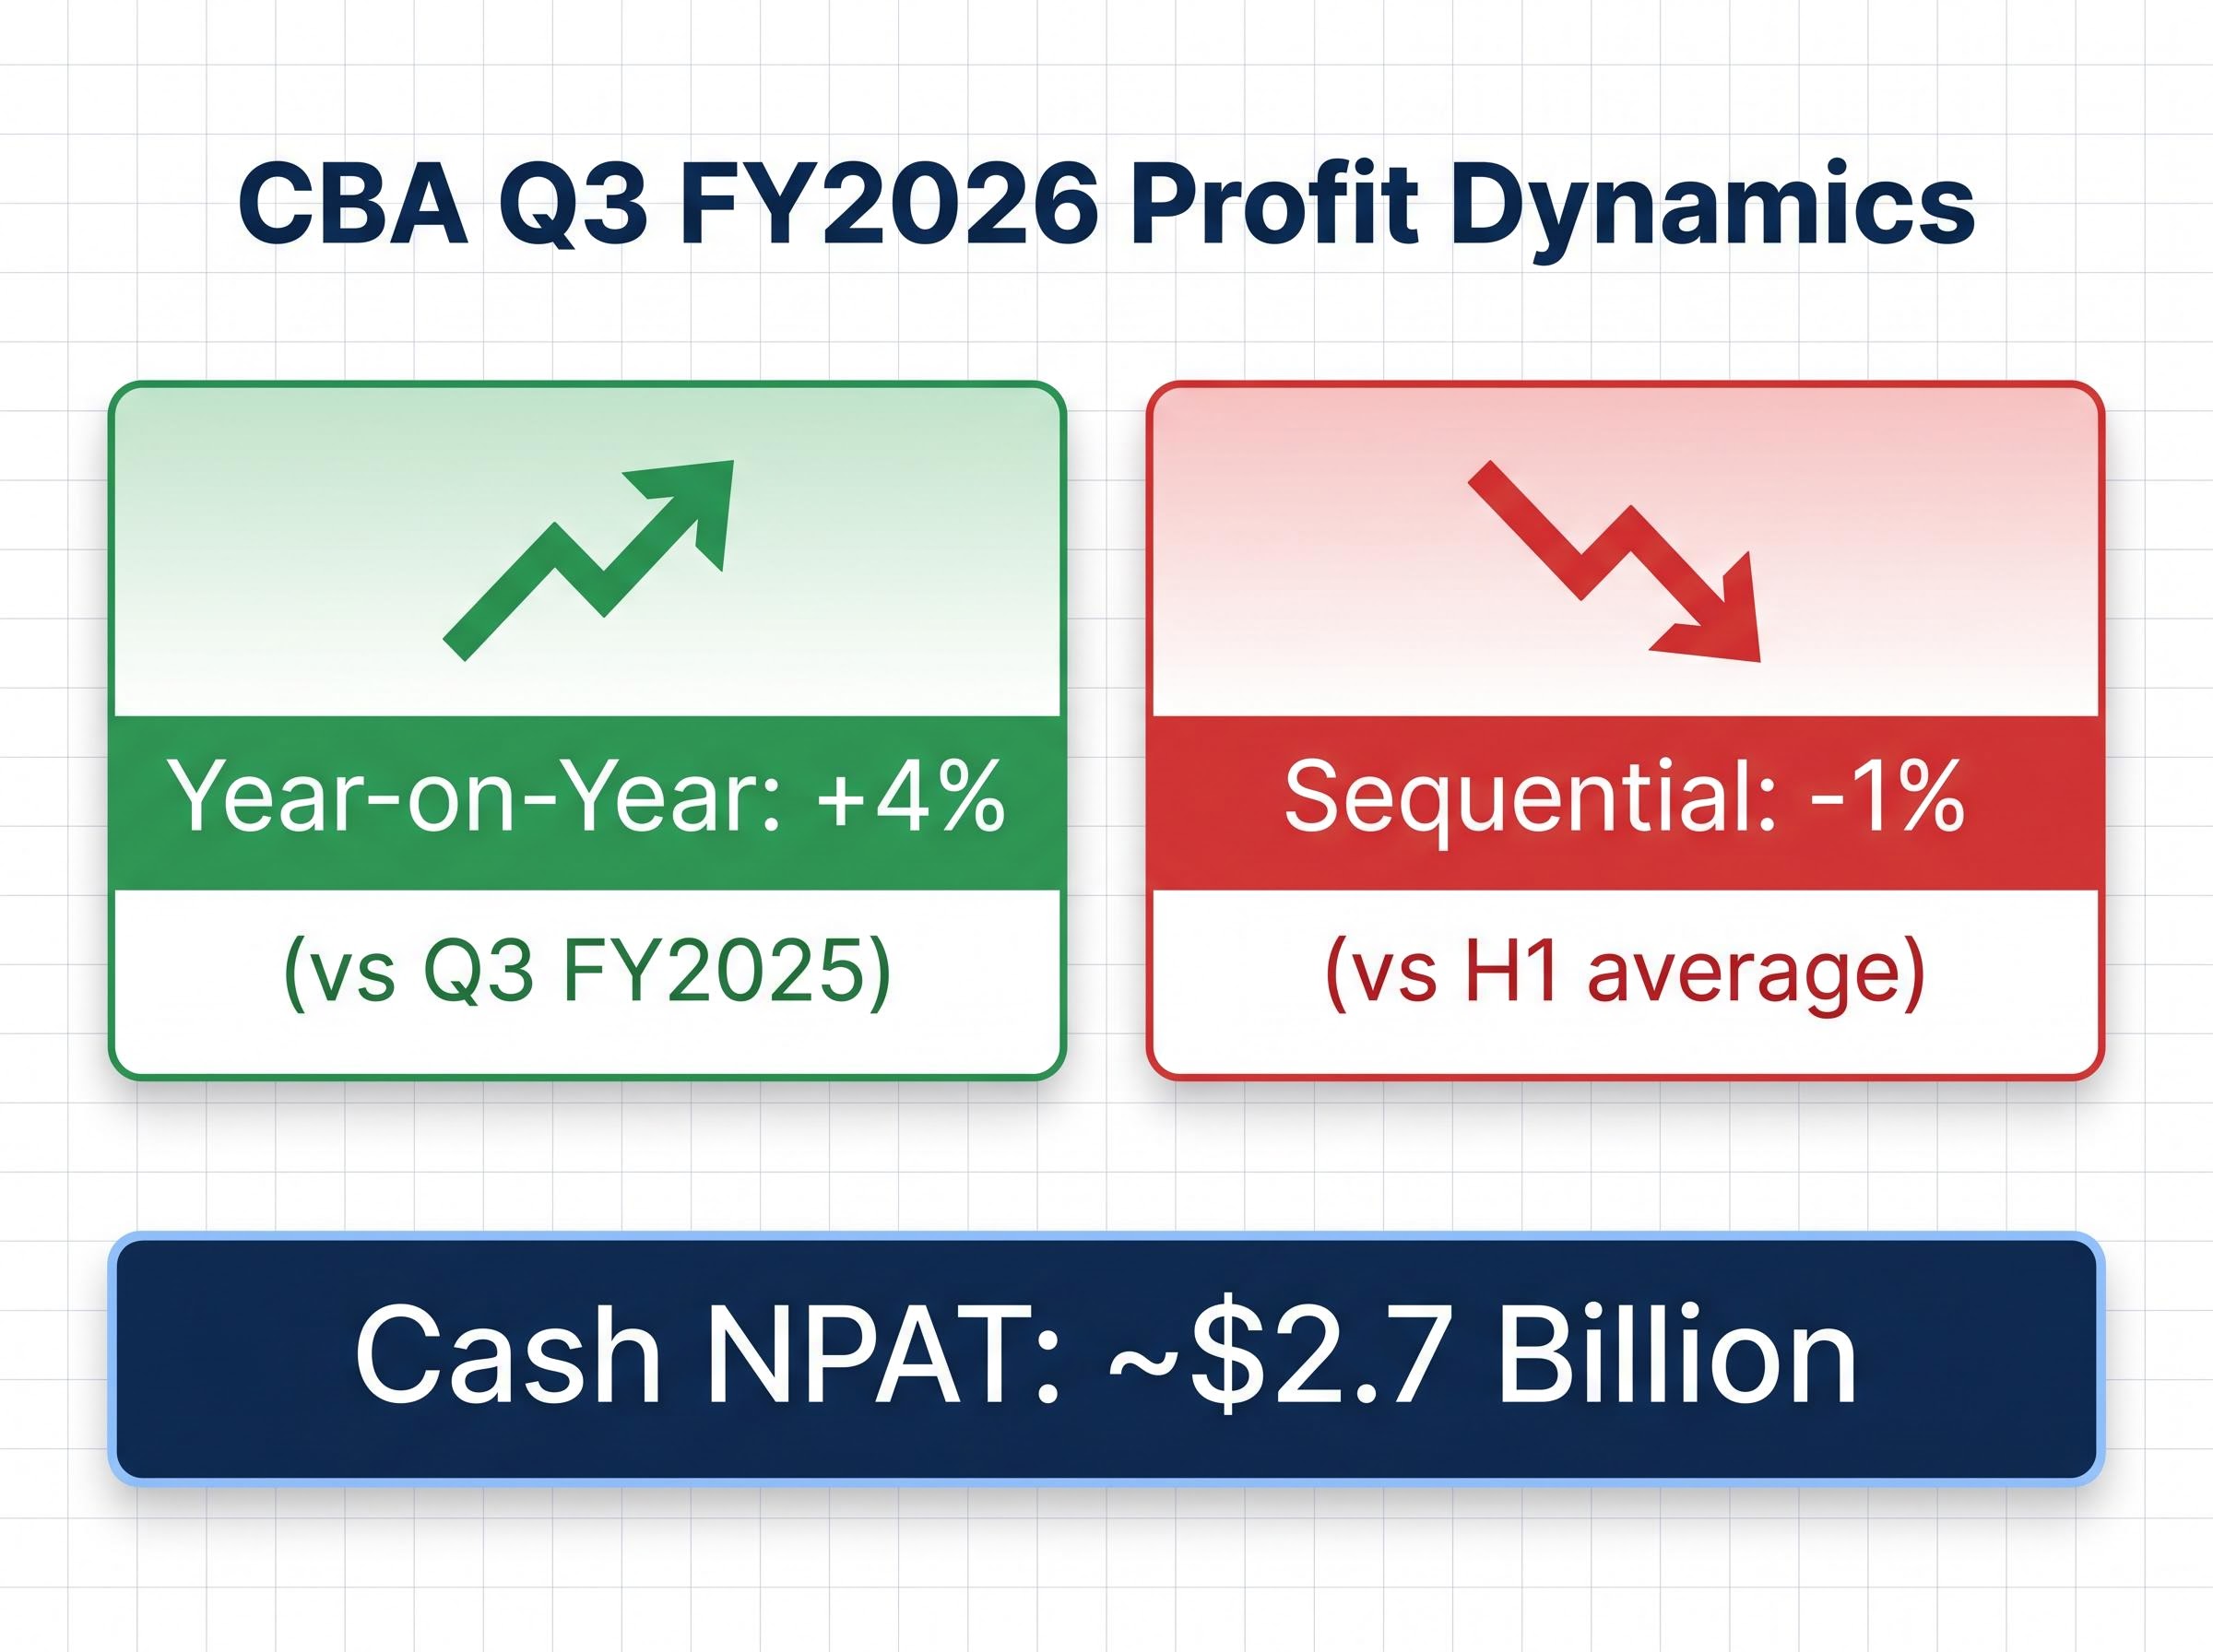
CBA reported cash net profit after tax (NPAT) of approximately $2.7 billion for Q3 FY2026, and statutory NPAT of approximately $2.6 billion. Both figures were unaudited. Year-on-year, cash profit rose 4% compared with Q3 FY2025.
That number, in isolation, looks healthy. But it is not the number institutional investors were watching.
Cash profit fell 1% against the first-half quarterly average, even as it rose 4% year-on-year. For a bank trading at a significant premium to peers, the sequential direction matters more than the annual comparison.
CBA’s valuation premium relative to sector peers has been a persistent point of tension between strong operational metrics and analyst consensus, with all 14 covering analysts holding sell ratings and an average price target sitting roughly $44 below recent trading levels, a gap that today’s sequential profit miss does little to narrow.
| Metric | Q3 FY2026 | QoQ change (vs H1 avg) | YoY change (vs Q3 FY2025) |
|---|---|---|---|
| Cash NPAT | ~$2.7B | -1% | +4% |
Australian bank stocks are priced on forward expectations, meaning a sequential miss can trigger disproportionate selling even when absolute numbers remain solid. This pattern is not new for CBA. Q1 FY2026 results in November 2025 triggered a 5% single-session drop to $166.31 on 11 November 2025 despite broadly similar dynamics: solid year-on-year metrics, but a result that fell short of what the valuation implied.
Net interest income grew 1% for the quarter ended 31 March 2026. That headline figure, though, conceals a tug-of-war between forces pulling in opposite directions.
Lending and deposit volume growth did the heavy lifting. Home loan balances rose $41 billion over the twelve months to March 2026. Household deposit balances grew $38 billion over the same period, at 1.1 times the system rate. Business lending expanded $21.6 billion year-on-year, growing at 1.2 times the system rate.
Replicating portfolio earnings and expanded deposit margins added further support.
Four specific headwinds partially offset those gains:
Overall operating income was essentially flat against the first-half quarterly average once net interest income gains and other income declines netted out. Volume growth at or above system rates is a sign of competitive health, not market share erosion. The flat income outcome tells a story about margin compression and structural headwinds, and that distinction matters for assessing CBA’s medium-term earnings trajectory.
The RBA Financial Stability Review from March 2026 confirmed that net interest margin compression across large Australian banks was being driven by intensifying competition in mortgage and business lending, providing independent corroboration that the headwinds CBA flagged in its Q3 update reflect sector-wide structural dynamics rather than institution-specific underperformance.
Operating expenditure rose 1% for the quarter, excluding restructuring costs and notable items. Three specific drivers accounted for the increase:
CBA’s management framed the expenditure increase as a deliberate investment in the bank’s multi-year technology transformation, positioning CBA as the most digitally advanced of Australia’s Big 4 banks.
The spending is producing measurable results. Retail transaction accounts grew by more than 170,000 during the March quarter, with new-to-bank account openings cited as the primary driver. That customer acquisition figure provides one tangible signal that the digital investment is translating into competitive advantage, not simply keeping pace with sector obligations.
Cost growth at 1%, however, is worth scrutinising when set against flat income. It means the cost-to-income ratio is not improving, and for a bank trading at a premium valuation, investors will want evidence that technology spend delivers operating leverage in subsequent quarters, not just customer volume.
CBA reported a loan impairment expense of $316 million for Q3 FY2026. Within that figure, the bank added $200 million to the forward-looking component of its collective provisions.
A forward-looking collective provision increase means the bank is setting money aside now for losses it has not yet incurred but expects may materialise. Management attributed the top-up specifically to elevated macroeconomic and geopolitical uncertainty, not to deterioration in the existing loan book.
The macroeconomic assumptions driving bank valuations can produce wildly divergent fair value estimates from the same underlying data: the same model applied to NAB produces a range from $19.00 to $85.50 per share depending solely on growth and discount rate inputs, which illustrates why CBA’s provisions top-up for geopolitical uncertainty lands differently for bulls and bears.
The RBA cash rate decision on 5 May 2026 moved the cash rate target to 4.35%, with the Monetary Policy Board citing persistent inflation and global economic uncertainty as the primary drivers, the same macroeconomic conditions CBA’s management identified as the rationale for its $200 million forward-looking provisions top-up.
That distinction is worth holding clearly. The $200 million is not a response to loans going bad today. It is a hedge against conditions CBA’s management believes may worsen.
CEO Matt Comyn stated that the bank’s balance sheet settings were deliberately structured to support customers through a period of uncertainty.
Consumer arrears edged up only modestly during the quarter. Corporate troublesome and non-performing exposures also increased, though actual loss levels remained low relative to historical norms.
The provisions increase is the clearest signal that CBA’s management is hedging against conditions it expects to deteriorate. For investors, this is a leading indicator worth monitoring across subsequent quarters more closely than the current quarter’s credit quality data alone.
The quarterly earnings result pressured the share price, but it did not undermine the structural foundations of CBA’s balance sheet. Three metrics illustrate that resilience.
| Metric | Q3 FY2026 | Context |
|---|---|---|
| CET1 ratio | 11.6% | Above APRA minimum requirements |
| Deposit funding | 79% of total funding | Conservative funding mix |
| Long-term wholesale funding | $32 billion secured | Strong progress on FY2026 funding task |
CEO Matt Comyn explicitly positioned the bank’s capital and liquidity settings as deliberate buffers for an uncertain environment, noting headwinds including energy costs, sustained interest rates, and Middle East supply chain disruption.
The Common Equity Tier 1 (CET1) ratio measures the capital buffer a bank holds above its minimum regulatory requirements, expressed as a percentage of its risk-weighted assets. At 11.6%, CBA holds a comfortable margin above the floor set by the Australian Prudential Regulation Authority (APRA). This buffer determines the bank’s capacity to absorb unexpected losses and sustain dividend payments.
CET1 ratio benchmarks across the sector show NAB at 12.05% and Westpac at 12.53%, both sitting above CBA’s 11.6%, which means CBA’s capital buffer, while comfortably above APRA minimums, is not the strongest in the peer group despite the bank’s premium valuation.
A 79% deposit funding ratio means that the vast majority of the money CBA lends out comes from customer deposits rather than wholesale markets. Deposit funding is considered more stable and less expensive than wholesale borrowing, which makes it a positive indicator for long-term funding resilience. These metrics confirm that CBA is not in structural distress, which is the most relevant question for long-term holders amid a sharp intraday price move.
The key price reference points from the current session and recent history:
For Big 4 Australian banks trading at elevated valuations, single-session drops of 5-8% on modest earnings misses are not unusual. The pattern has repeated across multiple reporting periods.
The November 2025 precedent is instructive. CBA fell sharply on NIM compression and expense concerns, yet the decline did not mark the beginning of a sustained structural downturn. That does not make today’s sell-off irrelevant, nor does it make it an automatic buying signal. It provides the longitudinal context needed to assess the current move as part of a recurring pattern rather than an unprecedented event.
The ASX 200 sat at 8,670.70, down 0.36%, while the XBD Banks Index fell 2.57% to 4,115.80, confirming the banking sector bore disproportionate pressure on the session.
CBA’s underlying business metrics, including volume growth above system rates, a 11.6% CET1 ratio, and low actual credit losses, remain solid. But the sequential profit decline and the $200 million provisions top-up handed the market a reason to reprice a stock trading at a significant premium to book value and peers.
Q3 FY2026 figures are unaudited. Full-year results will provide the definitive picture of FY2026 performance. In coming weeks, analyst price target revisions from Macquarie, UBS, and Citi will indicate whether the institutional consensus view has shifted, or whether this sell-off follows the pattern of prior post-results corrections that proved temporary.
Investors tracking the CBA share price should monitor the ASX announcement lodged on 12 May 2026 directly via CBA’s investor relations page for confirmed figures, and watch for broker commentary that typically emerges later in the session and post-close.
For investors wanting to move beyond the immediate share price reaction and build a structured view on whether CBA’s current price reflects fair value, our full explainer on valuing ASX bank shares applies both a PE comparison and a dividend discount model to ANZ in May 2026, walks through how sharply DDM outputs shift with different discount rate assumptions, and explains how APRA capital requirements and franking credit mechanics change the numbers for Australian-based investors specifically.
This article is for informational purposes only and should not be considered financial advice. Investors should conduct their own research and consult with financial professionals before making investment decisions. Q3 FY2026 figures referenced are unaudited and subject to confirmation in CBA’s full-year results.
A sequential profit miss occurs when a company's profit falls compared to the previous period's average, even if it rises year-on-year. For CBA, cash profit fell 1% against the first-half quarterly average in Q3 FY2026, which matters because a bank trading at a premium valuation is held to a higher standard where the directional trend of profit growth is scrutinised as closely as absolute figures.
CBA added $200 million to its forward-looking collective provisions during Q3 FY2026, citing elevated macroeconomic and geopolitical uncertainty. This is a precautionary measure against losses the bank has not yet incurred but expects may materialise, not a response to existing loans deteriorating.
CBA reported a Common Equity Tier 1 (CET1) ratio of 11.6% in Q3 FY2026, which sits above APRA minimum requirements but is below peers NAB at 12.05% and Westpac at 12.53%. The CET1 ratio measures the capital buffer a bank holds above its regulatory minimum, determining its capacity to absorb unexpected losses and sustain dividends.
CBA has a recent history of sharp post-results declines when earnings fall short of the expectations implied by its premium valuation. In November 2025, CBA dropped 5% to $166.31 on Q1 FY2026 results day and fell roughly 16% over the broader post-results period, a pattern that provides context for interpreting the 1.40% drop seen on 13 May 2026.
CBA's net interest income grew 1% in the quarter to 31 March 2026, supported by home loan balance growth of $41 billion over twelve months, household deposit growth of $38 billion at 1.1 times the system rate, and business lending expansion of $21.6 billion at 1.2 times system rate. These gains were partially offset by cash rate lag effects, competitive margin pressure, a weaker New Zealand dollar, and two fewer trading days in the quarter.