
The Memo That Halved Meta’s AI Infrastructure Cost Estimate
8 hrs ago
Commonwealth Bank of Australia trades at 27-29x trailing earnings, a premium that implies the market considers it the highest-quality bank on the ASX. But what would an investor actually interrogate to verify that claim using the numbers that matter, rather than relying on share price momentum as a proxy for quality?
Retail investors evaluating Australian bank stocks often default to dividend yield or recent price performance when forming a view. These metrics reflect what the market thinks, not what the business is doing. With the RBA cash rate now at 4.35% following hikes in February, March, and May 2026, and net interest margin (NIM) pressure building across the sector, the gap between a well-capitalised, high-return bank and a mediocre one carries more weight than it has in years.
What follows uses CBA’s most recently reported figures as a live case study to explain three metrics that matter most when assessing Australian bank quality: NIM, Return on Equity (ROE), and CET1 capital ratio. Each is benchmarked against the ASX major bank average so readers finish with a replicable framework, not just a verdict on one stock.
The instinct to reach for a P/E ratio or earnings-per-share growth rate when evaluating a bank is understandable. It is also insufficient. Banks are leveraged financial intermediaries; their risk and return profile is structurally different from an industrial or consumer company. A retailer’s revenue comes from selling goods. Roughly 85% of CBA’s total revenue comes from lending, which means the efficiency of that lending operation, and the capital buffer behind it, define the business in a way that a single P/E number cannot capture.
CBA’s trailing P/E of approximately 27-29x sits well above the major bank sector average of 22-24x. The premium exists. But what justifies it? Three metrics, used together, provide the answer. These are the same measures APRA, sell-side analysts, and bank management teams themselves foreground in investor reporting:
NIM measures the spread between what a bank pays depositors for their funds and what it charges borrowers for loans, expressed as a percentage of interest-earning assets. A higher NIM means the bank extracts more profit from each dollar it deploys into lending. For a business where lending income constitutes 85% of revenue, NIM is the most direct measure of operating efficiency.
When interest rates rise quickly, a bank’s funding costs tend to increase faster than its loan repricing, squeezing margins in the short term. This deposit re-pricing lag is the mechanism through which the February, March, and May 2026 RBA hikes (bringing the cash rate to 4.35%) are pressuring margins across the sector. CBA’s at-call deposits, which represent approximately 79% of its funding base, reduce some of that structural lag because at-call rates adjust more quickly. They do not eliminate the pressure entirely.
The third consecutive RBA hike in May 2026 brought the cash rate to 4.35%, reversing nearly all of the easing delivered across 2025 and resetting the sector-wide assumptions that underpinned bank NIM forecasts entering the year.
CBA reported a NIM of approximately 2.04% in 1H FY2026, down roughly 4 basis points versus 1H FY25. NIM had briefly stabilised in the December 2025 quarter, supported by higher swap rates and growth in at-call deposits. The 2026 tightening cycle has renewed that margin pressure.
| Bank | NIM (Latest) | Data Confidence |
|---|---|---|
| CBA | ~2.04% | Medium (1H FY2026, source access limited) |
| NAB | ~1.98% | Low (unverified directional figure) |
| Westpac | ~2.01% | Low (unverified directional figure) |
The December 2025 quarter provided a brief respite for NIM across the sector. The 2026 tightening cycle, with three RBA hikes in four months, has renewed margin pressure and placed at-call deposit repricing dynamics back at the centre of the outlook.
The picture for CBA is mixed. Home lending volume is growing, with CBA mortgages up 7%, but per-loan margins are being compressed by competitive pricing pressure. Volume growth and margin quality are pulling in opposite directions.
ROE measures net profit as a proportion of total shareholder equity: the return generated on every dollar shareholders have invested in the business. Where NIM captures efficiency per dollar lent, ROE captures efficiency per dollar of shareholder capital. For banks, sustaining ROE above the cost of equity is the dividing line between compounding value and merely recycling capital.
CBA’s ROE stands at approximately 13.1% on a full-year basis (with an FY25 implied figure of approximately 12.5%), against an ASX banking sector average of roughly 9.35% according to Rask data. That gap is material. It represents one of the clearest quantitative justifications for CBA’s premium multiple.
| Bank | ROE (Latest) | P/E (TTM) |
|---|---|---|
| CBA | ~13.1% | ~27-29x |
| ANZ | ~13.0% | ~22-24x |
| NAB | ~14.2% | ~22-24x |
| Westpac | ~13.8% | ~22-24x |
CBA’s ROE of approximately 13.1% against a sector average of 9.35% represents one of the clearest quantitative justifications for its premium multiple.
The table, however, introduces a complication. NAB and Westpac both report higher point-estimate ROE figures than CBA (noting these are unverified directional figures), yet trade at sector-average multiples. CBA’s premium, then, is not purely an ROE story. It reflects the market’s confidence in the durability of CBA’s returns, underpinned by deposit franchise strength and a 20%-plus mortgage market share.
ROE compression is a sector-wide trend, driven by rising capital requirements and NIM headwinds. At 27-29x earnings, CBA’s valuation is already pricing in continued outperformance. If ROE reverts toward the sector average, the valuation case weakens considerably.
A bank can report strong margins and healthy returns right up until the point it cannot absorb unexpected losses. Common Equity Tier 1 (CET1) is the metric that separates those two conditions. It measures the proportion of a bank’s risk-weighted assets funded by core equity, specifically ordinary shares and retained earnings. A higher ratio means a larger loss-absorption buffer.
CBA’s CET1 ratio stands at 12.3%, flat versus June 2025 and up 10 basis points versus December 2024. On an international equivalent basis, that figure translates to 18.3%, contextualising Australia’s comparatively conservative capital standards. The ratio sits well above APRA’s minimum requirement of 10.25%, providing approximately $10 billion of buffer above regulatory minimums.
CBA’s 1H FY2026 results release confirms the 12.3% CET1 ratio and the APRA minimum of 10.25%, providing the primary data source for the capital figures used throughout this analysis.
| Bank | CET1 Ratio | APRA Minimum |
|---|---|---|
| CBA | 12.3% | 10.25% |
| ANZ | ~12.8% | 10.25% |
| NAB | ~12.1% | 10.25% |
| Westpac | ~11.9% | 10.25% |
CBA holds approximately $10 billion above APRA’s regulatory minimum, a buffer that underpins both dividend continuity and strategic flexibility.
From 1 January 2027, Additional Tier 1 (AT1) instruments will no longer count toward capital adequacy for Australian banks under APRA’s revised framework. The Tier 1 capital concept is being eliminated, making CET1 the primary capital buffer metric going forward. The CET1 minimum for advanced banks rises to 6.00% (from 4.50%), while the conservation buffer is reduced to 2.50% (from 3.75%).

Transitional arrangements allow existing AT1 instruments to count as Tier 2 capital until 2032 call dates. CBA’s current 12.3% CET1 ratio absorbs this structural change comfortably. Banks operating closer to minimum thresholds face more adjustment pressure.
For income-focused investors, CET1 strength is the balance sheet foundation that makes dividend reliability possible. A bank with a thin capital buffer faces regulatory pressure to cut distributions at precisely the moment investors most want certainty.
Taken individually, each metric tells a partial story. Together, they form a composite view of bank quality:
The bull case writes itself from these numbers: above-sector NIM, materially higher ROE relative to the broad average, and the strongest absolute capital position, layered on top of a deposit franchise anchored by more than 20% mortgage market share.
The tension is equally clear. CBA’s share price of $174.01 (as of 11 May 2026) represents approximately 20% year-to-date appreciation, within a 52-week range of $147-$192. At 27-29x earnings, the premium requires those metrics to hold. The dividend yield of approximately 2.7% (fully franked, with an interim dividend of $2.35 per share) is modest by historical bank standards, meaning capital growth carries a larger share of the total return burden.
Discount models reinforce the valuation question. Rask’s dividend discount model estimates range from $98.33 (base case) to $143.80 (grossed up for franking credits), all below the current market price. The average broker price target as of February 2026 was approximately $123.54, implying material downside, though that consensus may lag the stock’s recent move.
Even adjusting for fully franked dividends, the most generous DDM estimate of $143.80 sits approximately 17% below CBA’s current share price.
The analyst consensus on CBA at the time of writing places all 14 covering analysts on a sell rating with an average price target of $130.34, a figure that sits roughly $44 below the current market price and provides external validation that the valuation tension identified in this scorecard is not an artefact of one modelling approach.

The scorecard does not resolve whether CBA is overvalued. It establishes the quantitative basis for the premium, and makes visible the conditions under which that premium could compress.
The three-metric framework used in this analysis is portable. It applies to any ASX-listed bank, and the process for applying it is straightforward:
The framework has limits. These metrics are backward-looking snapshots. What matters to share price is the direction of travel, not the current level in isolation. APRA’s 2027 AT1 removal will also require recalibration of capital comparisons across the sector as the regulatory baseline shifts.
Investors wanting to apply this methodology to Westpac’s H1 2026 figures, where the same three metrics produce fair value estimates ranging from $34 to $49 per share, will find our dedicated guide to valuing ASX bank shares using NIM, ROE, and CET1, which works through the Dividend Discount Model, price-to-book cross-check, and ROE-to-cost-of-equity comparison with live data.
CBA’s above-sector performance on NIM, ROE, and CET1 provides a quantitative basis for its premium valuation. That basis is visible in the numbers. It is also conditional: the premium is only justified if those metrics hold through a tightening cycle, competitive mortgage pricing pressure, and evolving APRA capital requirements.
Investors can access CBA’s primary data through its investor centre (cba.com.au/investor-centre) and APRA’s published capital standards for the authoritative regulatory benchmarks. Broker price targets and DDM models are inputs to a view, not conclusions.
The macro assumptions underlying bank valuations carry as much weight as the metrics themselves: the same NAB model produces a $19.00 to $85.50 per share range depending entirely on RBA rate trajectory and growth inputs, which is why two analysts looking at identical ROE and NIM figures can reach price targets $13 apart.
The three-metric framework is a starting point for any ASX bank analysis. It does not deliver a final verdict. It delivers the right questions.
This article is for informational purposes only and should not be considered financial advice. Investors should conduct their own research and consult with financial professionals before making investment decisions. Past performance does not guarantee future results. Financial projections are subject to market conditions and various risk factors.
Net interest margin (NIM) is the spread between what a bank pays depositors and what it charges borrowers, expressed as a percentage of interest-earning assets. For CBA, where lending income accounts for roughly 85% of total revenue, NIM is the most direct measure of operating efficiency and a key driver of earnings quality.
CBA's CET1 ratio stands at 12.3%, which is well above APRA's minimum requirement of 10.25%, providing approximately $10 billion of buffer above the regulatory floor. This capital strength underpins both dividend reliability and strategic flexibility for the bank.
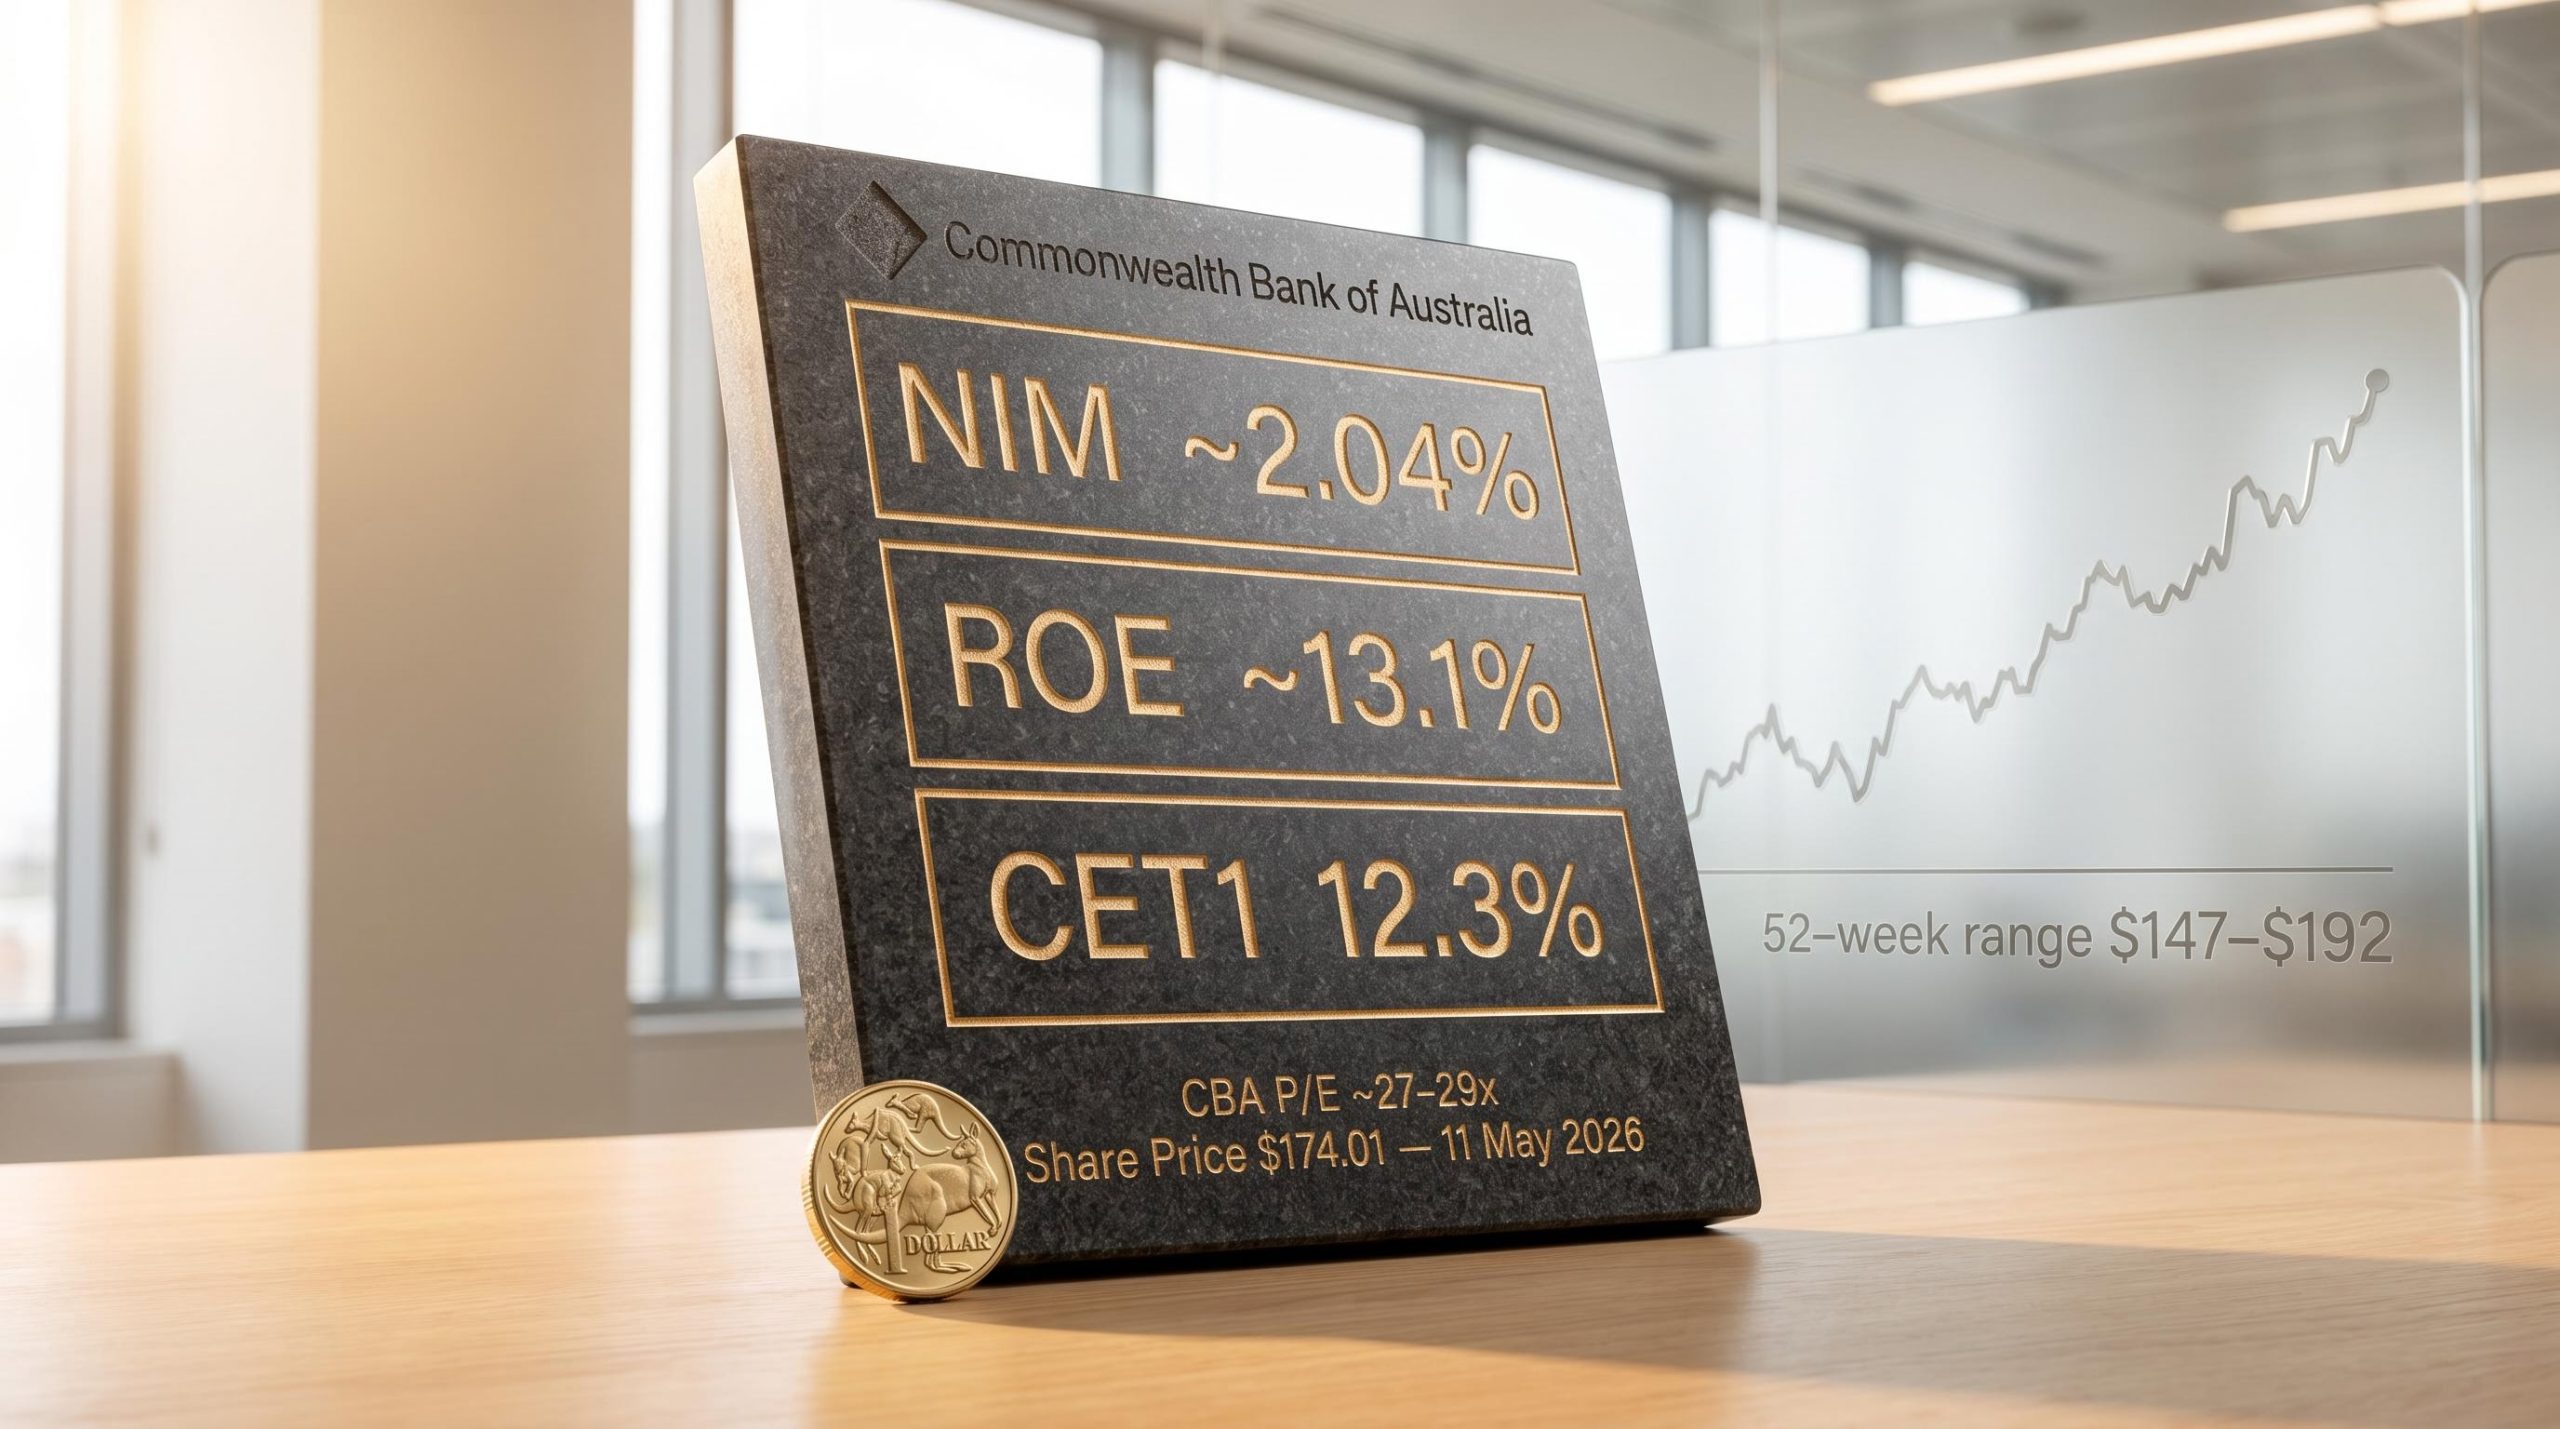
CBA reports a NIM of approximately 2.04%, an ROE of approximately 13.1% against a sector average of around 9.35%, and a CET1 ratio of 12.3%, all at or above sector averages. Together, these figures provide the quantitative foundation for CBA's 27-29x trailing earnings multiple relative to the major bank sector average of 22-24x.
Investors can locate NIM, ROE, and CET1 figures in any major bank's half-year or full-year results presentation via ASX announcements or the bank's investor relations page, then compare each figure against sector benchmarks and assess the direction of change versus the prior period. The framework is portable across all ASX-listed banks and requires no specialist modelling tools.
The three RBA cash rate hikes in February, March, and May 2026, bringing the cash rate to 4.35%, have renewed margin pressure across the sector by pushing up funding costs faster than loan repricing adjusts. CBA's NIM fell approximately 4 basis points to around 2.04% in the first half of FY2026, with competitive home lending pricing adding further compression despite 7% mortgage volume growth.


