How ASX’s CHESS Overhaul Became a $250M Governance Failure
20 hrs ago

Most investors can name Australia’s big four banks. Far fewer can explain why National Australia Bank trades at 19.7 times earnings while another major looks cheaper on paper yet delivers weaker returns on equity. The gap between recognising a bank stock and genuinely valuing bank shares sits in three metrics that professional analysts reach for first: net interest margin, return on equity, and Common Equity Tier 1 capital ratio.
With NAB’s H1 2026 results now public and all four major banks having reported, May 2026 is one of the strongest moments of the year for retail investors to benchmark the sector using real, current data. The problem is that these metrics are rarely explained in plain language. This article uses NAB’s actual H1 2026 figures as a teaching case to explain what each metric measures, what a good number looks like, how NAB compares to its ASX peers right now, and how to layer these numbers into a broader valuation framework applicable to any Australian bank stock.
Standard equity valuation ratios do not translate well to banks. Metrics like EV/EBITDA, which work for companies that produce goods or deliver services, lose meaning when applied to a business whose core activity is borrowing money at one rate and lending it at another. The revenue structure is fundamentally different, and so the analytical toolkit needs to be different too.
Consider the scale of that difference. For NAB, interest-derived income accounted for approximately 81% of total revenue in its most recent full financial year, according to Rask calculations.
81% of NAB’s revenue comes from lending-derived income, illustrating why margin-specific metrics matter more for banks than for almost any other sector on the ASX.
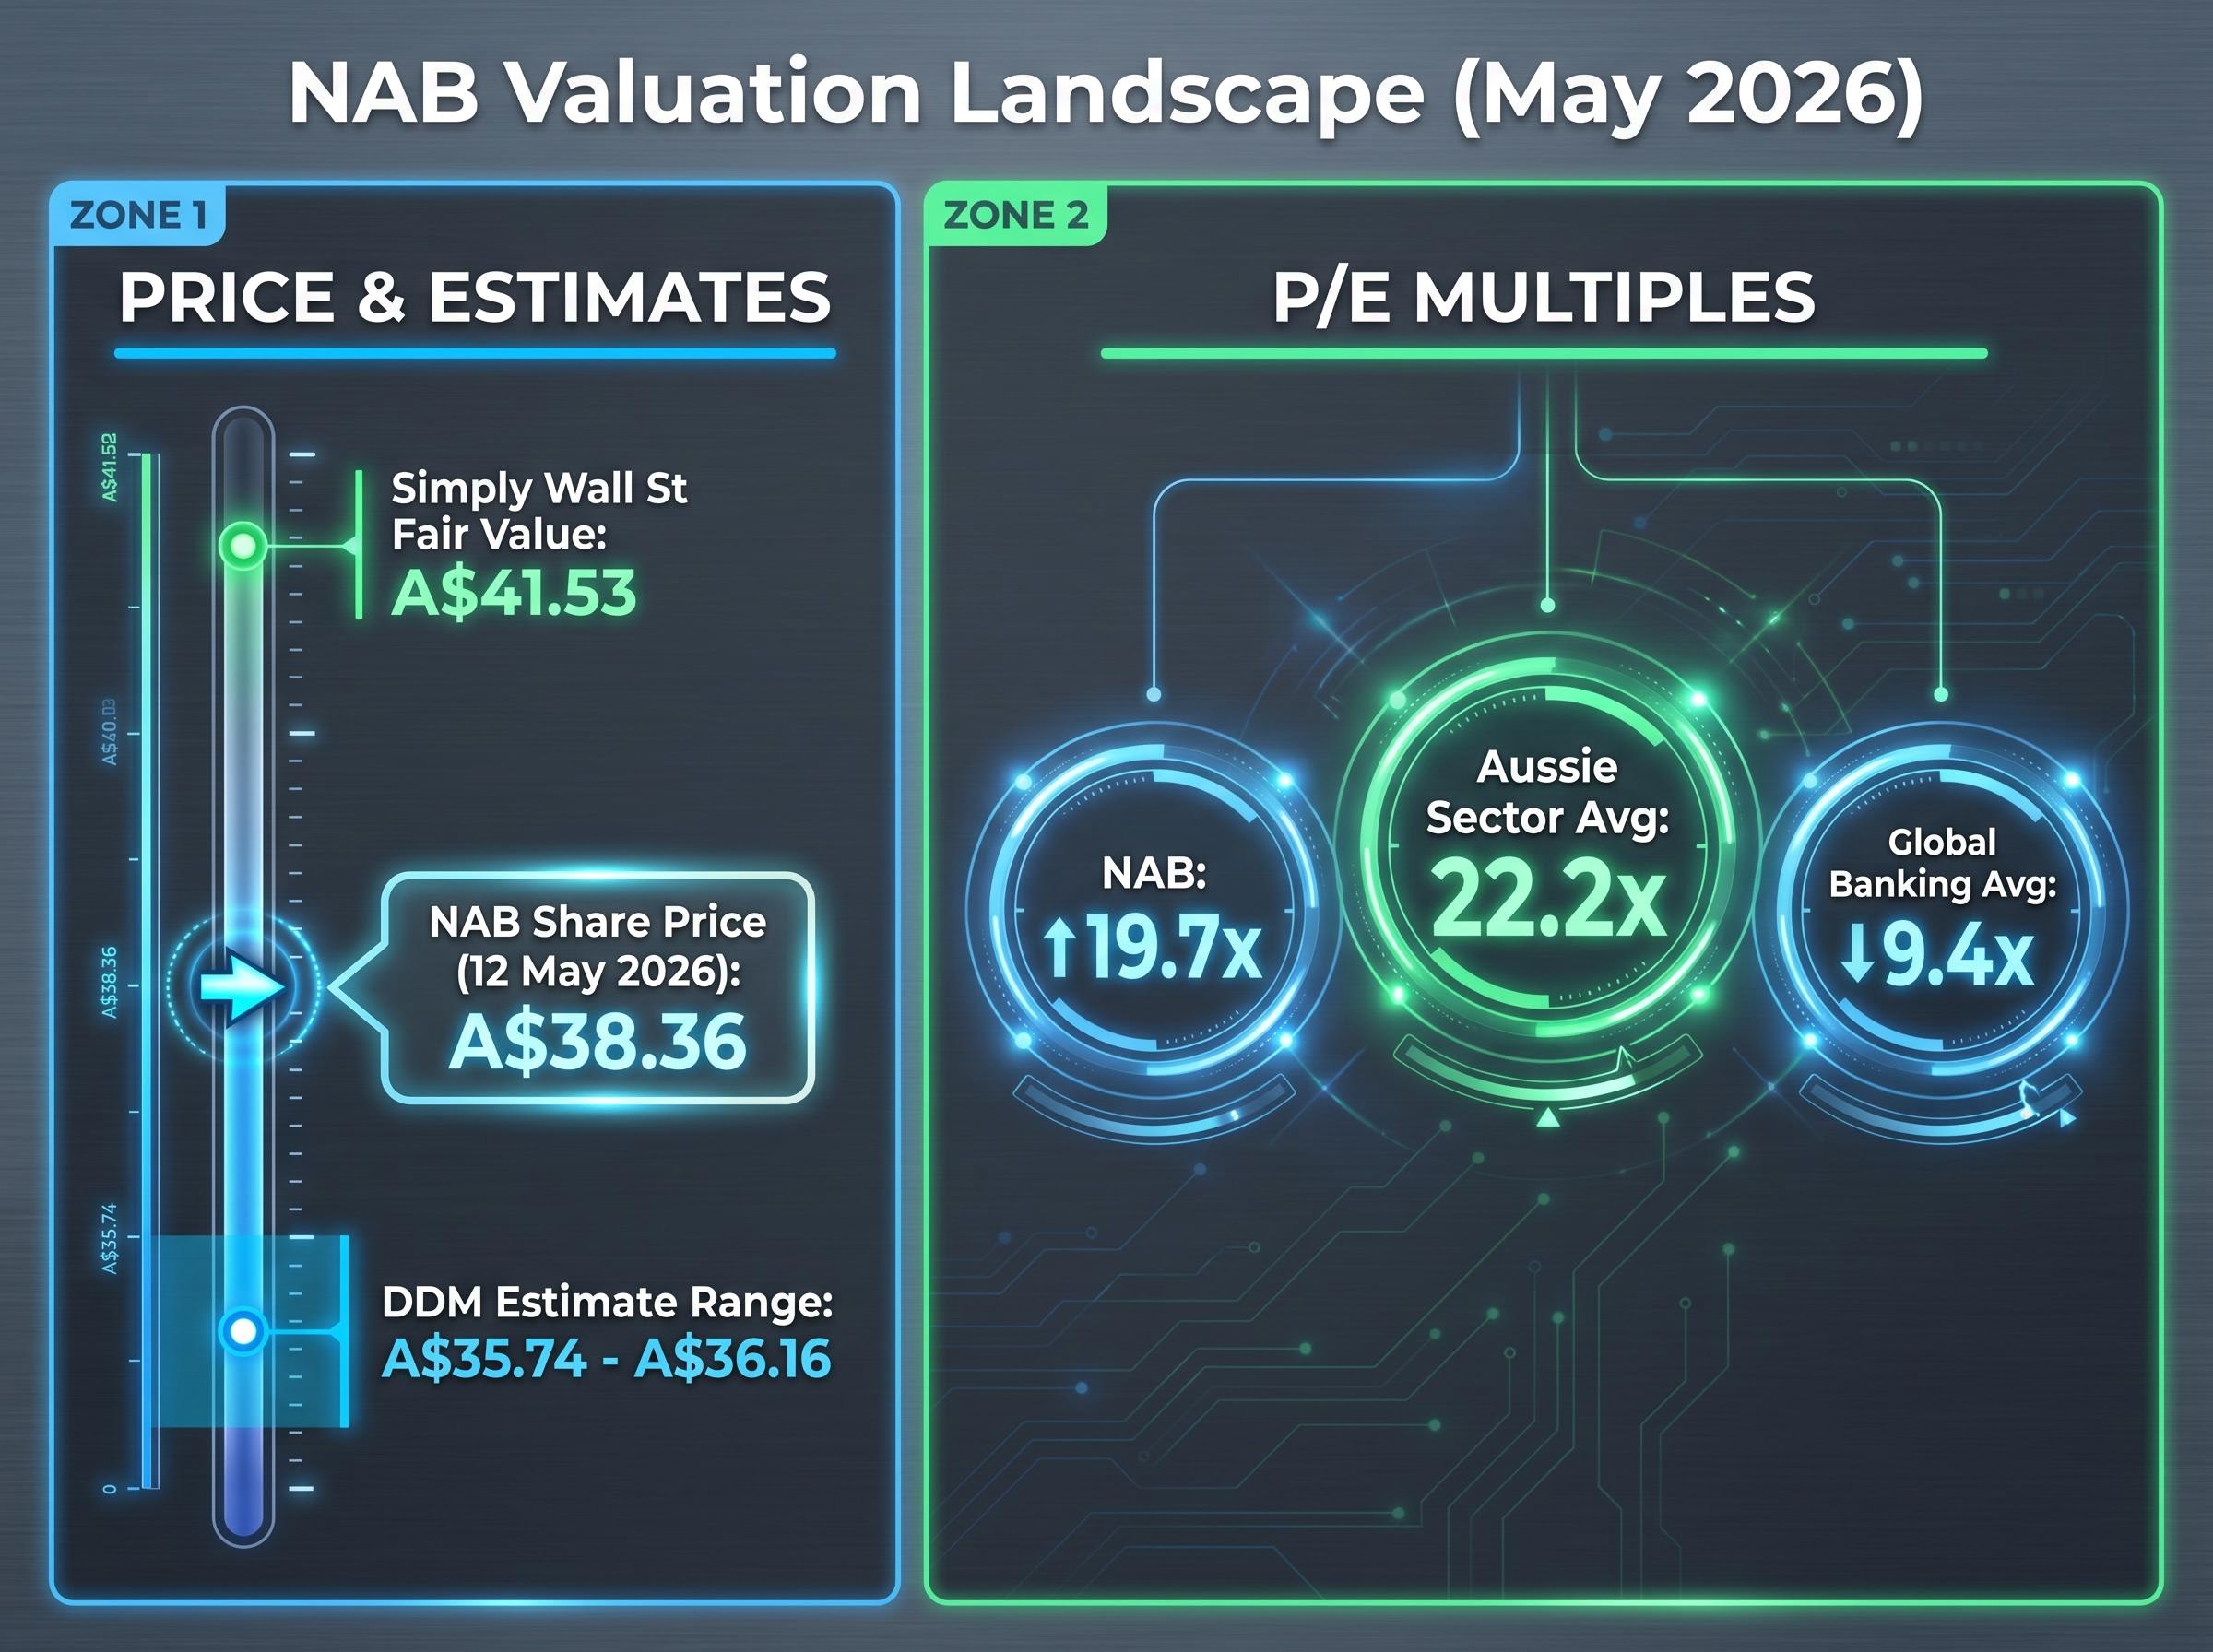
Even a familiar ratio like price-to-earnings requires sector-specific interpretation. NAB trades at 19.7x earnings, which looks modest against the Australian major bank average of 22.2x, but the entire Australian banking sector trades at roughly double the global banking average of approximately 9.4x. A low P/E relative to domestic peers does not mean cheap in a global context.
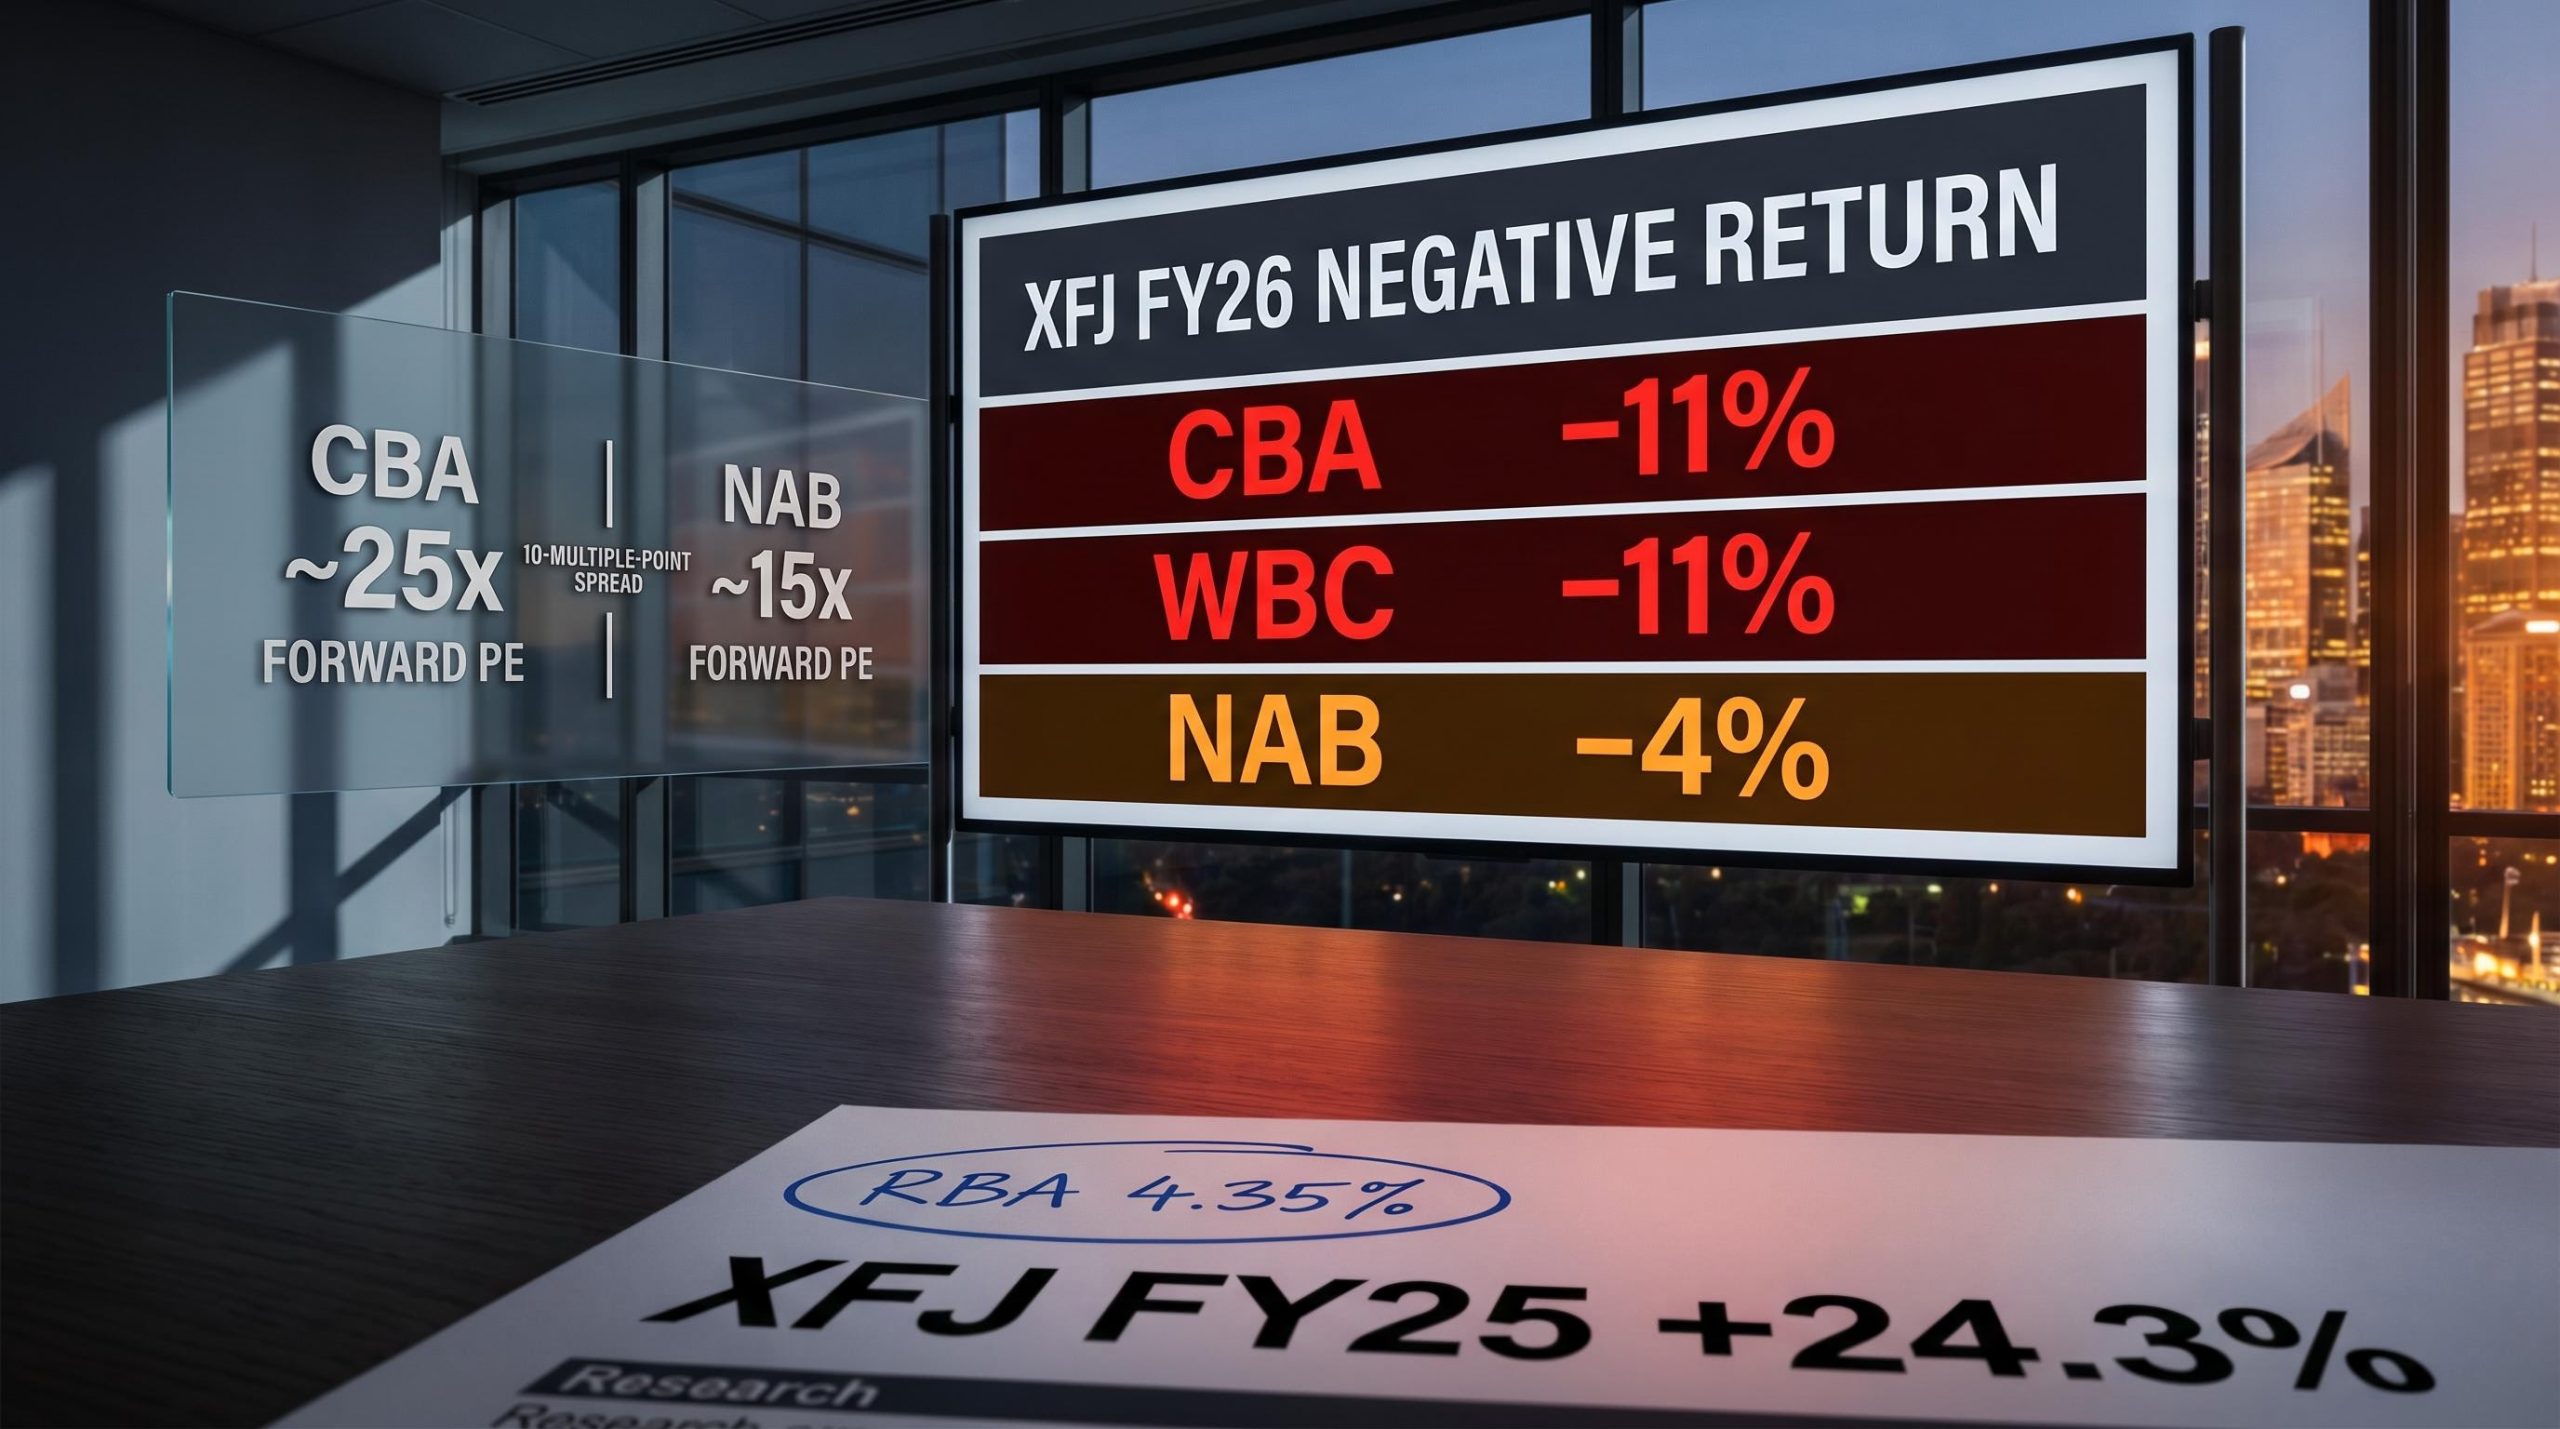
Big Four analyst consensus divergence is unusually wide heading into mid-2026: CBA carries unanimous sell ratings across 14 covering analysts with average price targets implying roughly 25% downside, while ANZ is the only major bank where buy ratings outnumber sell ratings, illustrating how differently the sector’s individual constituents are being priced.
The three metrics that replace the standard toolkit for bank stock analysis are:
Each of these metrics receives a dedicated section below, using NAB’s latest figures and peer comparisons to make the numbers concrete.
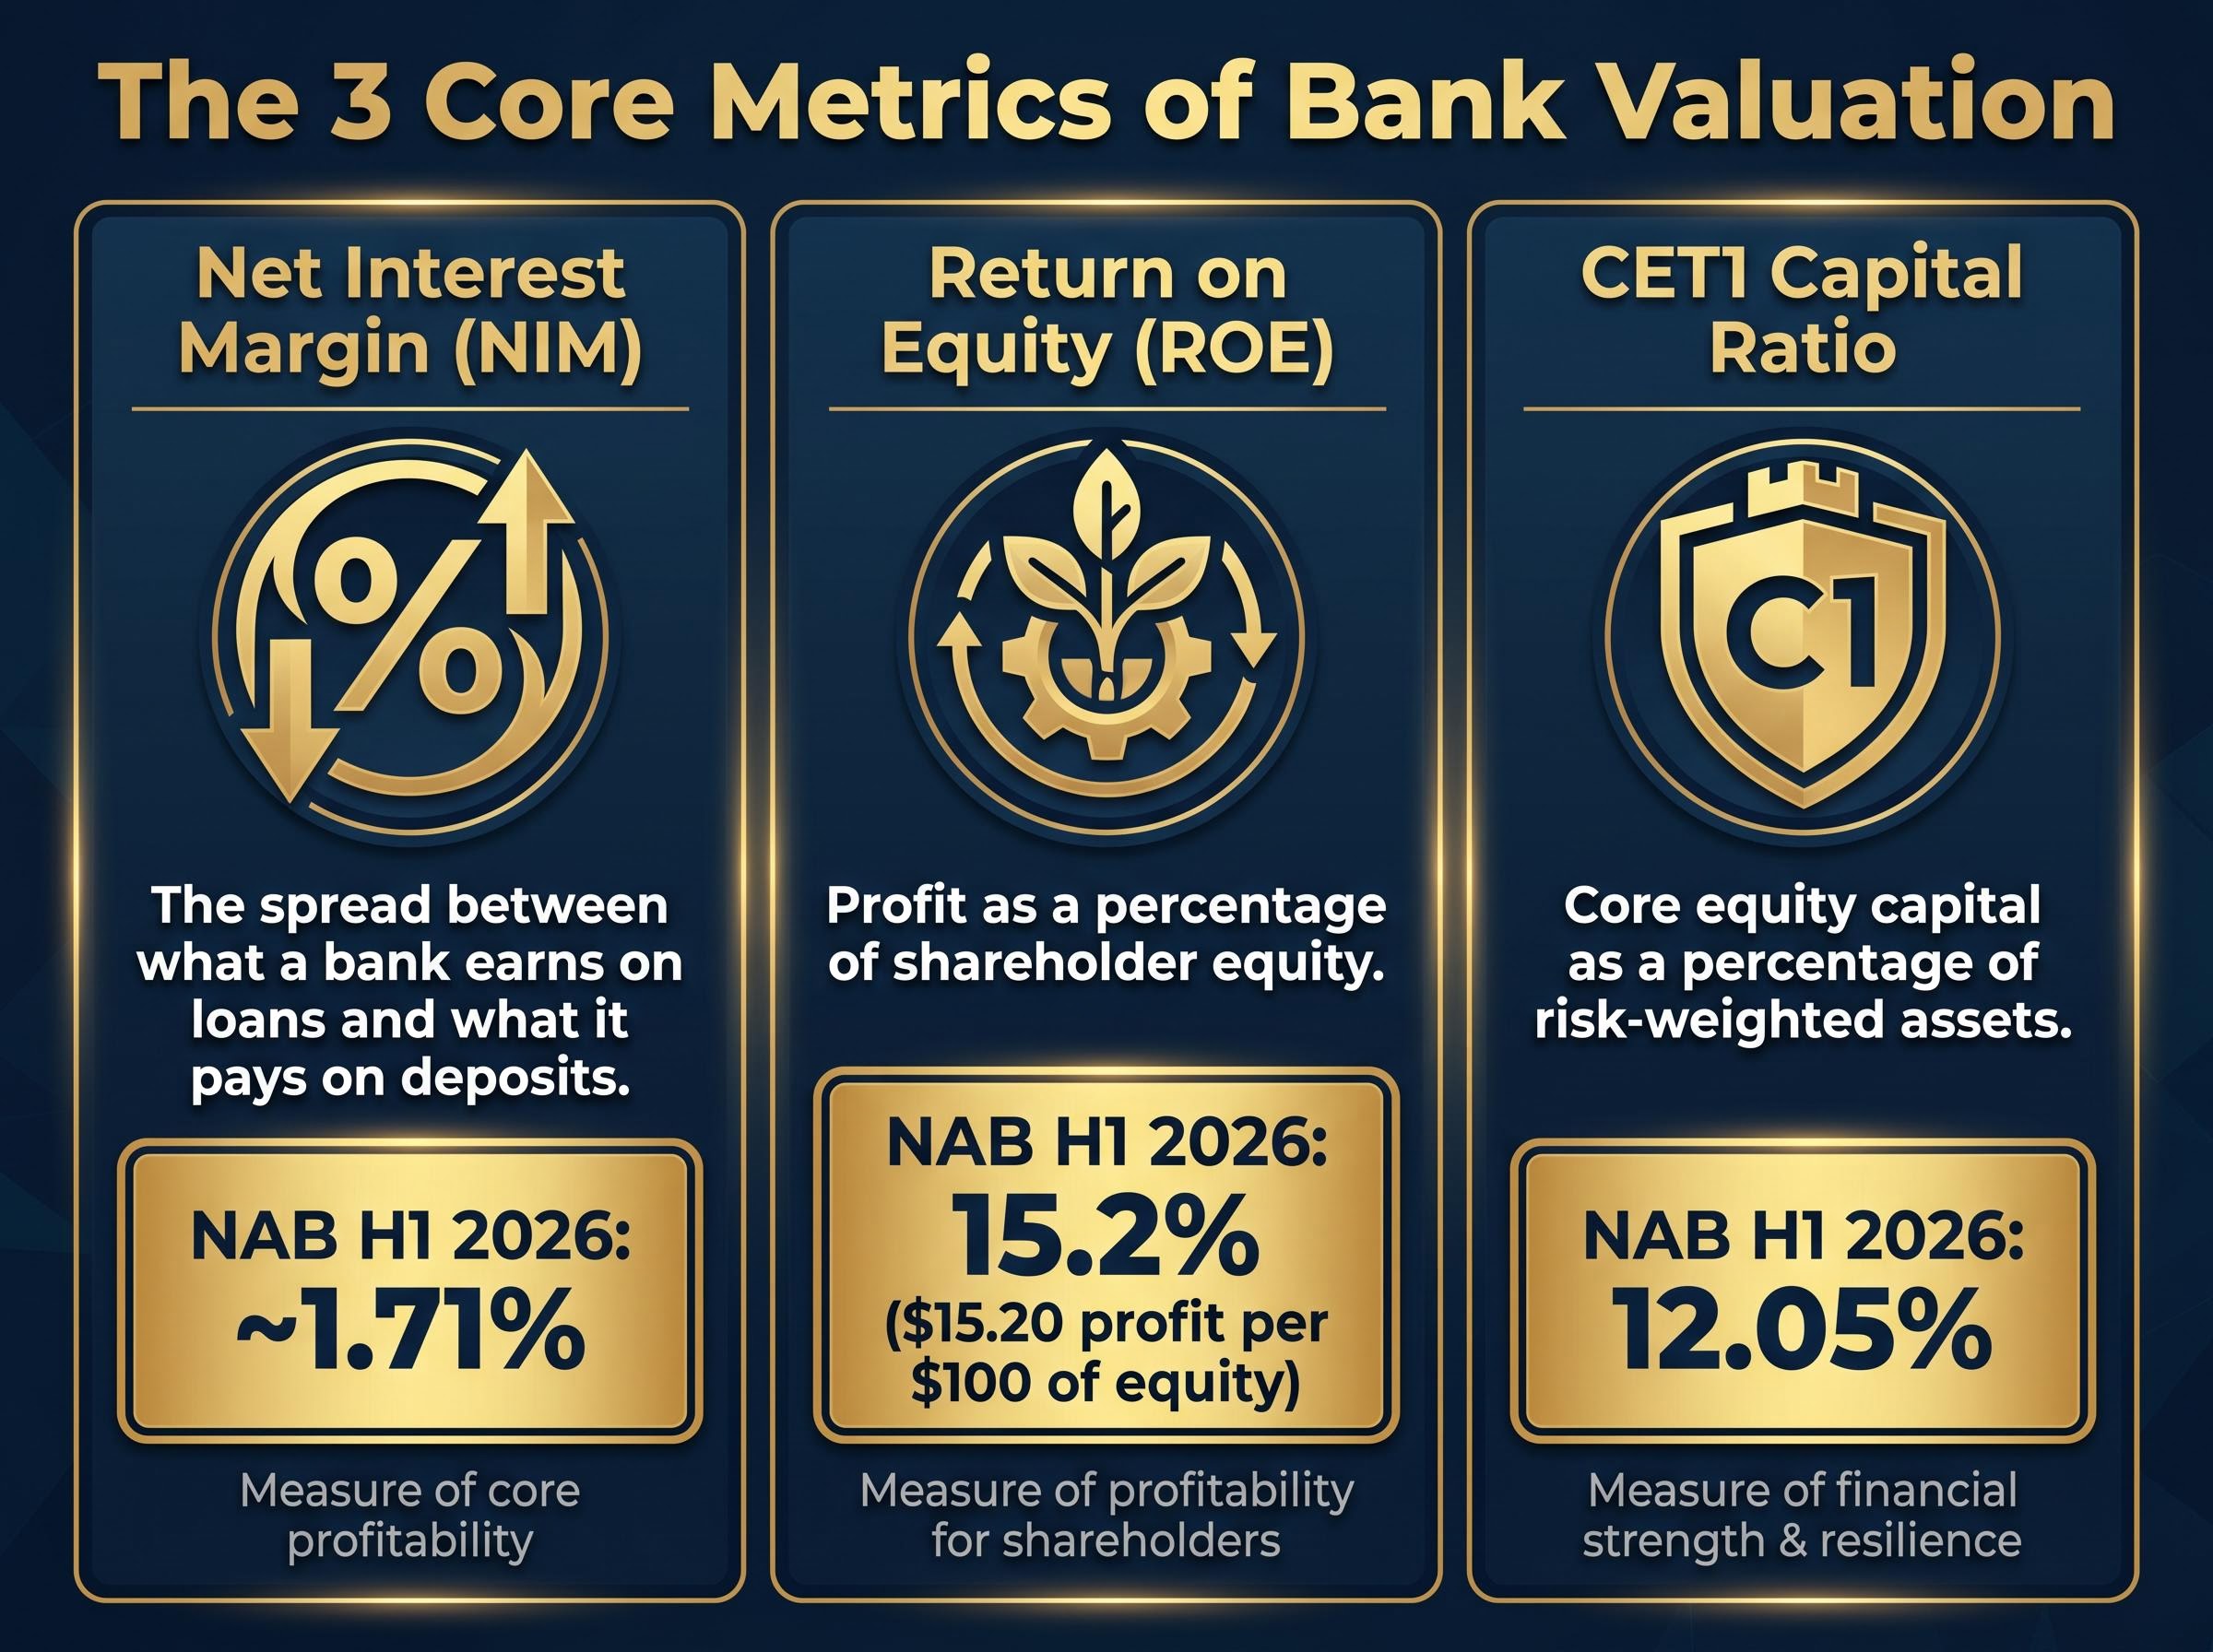
NIM captures the spread between the interest a bank earns on its loan book and the interest it pays to depositors and wholesale funders, expressed as a percentage of interest-earning assets. It is the single most direct window into a bank’s core earnings engine. A higher NIM means the bank is capturing more margin on every dollar it lends.
NAB reported a NIM of approximately 1.71% for H1 2026 (based on Rask calculations; investors should verify this figure against NAB’s official ASX announcement). That sits below the sector average of 1.78%, as reported in KPMG’s major banks H1 2026 analysis. At the other end of the range, ANZ reported the lowest NIM among the majors at 1.57%.
KPMG’s major Australian banks H1 2026 analysis benchmarks NIM, ROE, and CET1 across all four majors, providing the sector-wide data that makes peer comparisons meaningful rather than relying on any single bank’s self-reported positioning.
NAB’s net interest income for the half came in at A$9,163 million, reflecting the sheer scale of lending activity even at a below-average margin.
| Bank | NIM (H1 2026) | Net Interest Income |
|---|---|---|
| NAB | ~1.71% | A$9,163M |
| CBA | Stable (sector avg 1.78%) | Refer to CBA H1 2026 ASX announcement |
| Westpac | Stable | Refer to Westpac H1 2026 ASX announcement |
| ANZ | 1.57% | Refer to ANZ H1 2026 ASX announcement |
Three levers drive NIM in practice. The first is the RBA cash rate, which was increased by 25 basis points to 4.35% on 5 May 2026. A higher cash rate supports asset repricing on mortgages and business loans, which can lift margins.
The second lever works against the first: deposit pricing competition. As rates rise, customers migrate savings into higher-rate products, pushing up a bank’s funding costs. The third lever is mortgage market competition, where banks discount variable and fixed rates to win or retain borrowers, compressing the spread at the asset end.
NAB’s H1 2026 commentary specifically cited ongoing mortgage competition and deposit pricing pressure as active headwinds, despite the supportive rate environment. The result is a NIM that sits below the sector average, even as the cash rate remains at its highest level in over a decade.
Return on equity measures how much profit a bank generates for every dollar of shareholder equity on its balance sheet. It is the most intuitive profitability metric for retail investors because it maps directly to the return on their own capital.
NAB’s H1 2026 ROE came in at 15.2%, based on updated half-year results. In practical terms, that translates to approximately $15.20 in profit for every $100 of equity.
For every $100 of equity on NAB’s balance sheet, the bank generated approximately $15.20 in profit over the first half of 2026.
That figure places NAB near the top of the peer group. A comparison across the four majors illustrates the range:
NAB and CBA are running broadly neck and neck on capital efficiency, while Westpac sits at the lower end. A higher ROE is generally more favourable when comparing banks, but context matters. An unusually high ROE can sometimes reflect elevated leverage (borrowing more relative to equity) rather than genuine operational efficiency. Investors should consider ROE alongside the CET1 capital ratio, which measures the strength of the equity base itself.
The ROE comparison gives investors a clear signal about which banks are converting their capital base into returns most effectively, and which may have room for improvement.
Note: Rask’s full-year ROE calculation for NAB was 11.4% against a sector average of 9.35%. The 15.2% figure referenced above reflects the H1 2026 result. Investors should cross-reference NAB’s official investor presentation for the most current confirmed figure.
If NIM measures earnings and ROE measures efficiency, the Common Equity Tier 1 (CET1) capital ratio measures resilience. CET1 represents a bank’s core equity capital, the highest-quality capital on its balance sheet, expressed as a percentage of risk-weighted assets. It is the financial buffer that absorbs losses before depositors or bondholders bear any impact.
The Australian Prudential Regulation Authority (APRA) sets minimum CET1 requirements under its prudential standards APS 110 and APS 111. A bank comfortably above the minimum has greater flexibility to sustain dividends, absorb credit losses during a downturn, and avoid the kind of emergency capital raisings that dilute existing shareholders.
APRA’s capital adequacy prudential standards, covering APS 110 and APS 111, set the specific minimum CET1 thresholds that Australian banks must maintain, with buffers above those minimums determining each institution’s capacity to sustain dividends and absorb unexpected credit losses.
NAB’s March 2026 pro forma CET1 ratio stood at 12.05%, comfortably above APRA’s regulatory minimums.
| Bank | CET1 Ratio (H1 2026) |
|---|---|
| ANZ | 12.39% |
| CBA | 12.3% |
| NAB | 12.05% |
| Westpac | ~11.5% |
All four majors sit well above regulatory minimums, though a spread of nearly 90 basis points separates ANZ at the top from Westpac at the bottom. For income-focused investors, a strong CET1 ratio is a leading indicator of dividend sustainability: it signals that the bank has capital headroom to keep paying dividends even if loan losses rise.
Forward-looking flag: APRA’s phase-out of Additional Tier 1 (AT1) instruments takes effect in January 2027. This regulatory change could affect how all major banks structure and report their capital base, and investors should monitor upcoming disclosures closely.
The three metrics covered above, taken together, paint a specific picture of NAB in May 2026. The bank’s NIM sits marginally below the sector average, suggesting its core lending margin is under slightly more competitive pressure than peers. Its ROE is among the highest of the four majors, indicating strong capital efficiency. Its CET1 ratio is solid, though not the highest in the group.
The next step is layering in valuation tools to determine whether the current share price reflects those fundamentals fairly. A practical framework for doing so involves four steps:
On a P/E basis, NAB trades at 19.7x earnings, a discount to the Australian sector average of 22.2x. Simply Wall St’s fair value estimate for NAB is A$41.53, while the share price as of 12 May 2026 was A$38.36.
Applying the same framework to Westpac illustrates how the same three metrics can tell a markedly different story across the peer group: valuing bank shares with NIM and CET1 alongside ROE shows Westpac’s 1.94% NIM sitting well above the sector average, even as its price-to-book ratio of 1.80x sits at the top of its 10-year historical range.
NAB’s share price of A$38.36 sits modestly below one fair value estimate of A$41.53, suggesting potential undervaluation on that model. Valuation models are inputs to decisions, not decisions themselves.
For income-focused investors, a basic DDM using NAB’s FY2025 full-year dividend of A$1.70 (fully franked) and a forward dividend assumption of A$1.71 produces an estimated fair value range of A$35.74 to A$36.16, depending on growth and discount rate assumptions.
NAB’s dividends are fully franked, meaning eligible Australian investors can claim tax credits that materially lift the effective yield. When franking credits are incorporated into the DDM, the estimated fair value rises to approximately A$51.66.
Franking credit calculations for Australian investors, particularly those in SMSF pension phase or lower tax brackets, can shift the effective value of a fully franked dividend significantly: a $1,000 cash dividend grosses up to $1,428.57 once the attached credit is refunded by the ATO, a difference that the headline yield figure never captures.
This franking-adjusted figure is not directly comparable to the share price. It represents the gross value of dividends including tax credits and should be interpreted alongside a standard DDM rather than in isolation. Investors seeking further guidance on franking credits can consult resources from the Australian Taxation Office (ATO) and ASIC MoneySmart.
A metrics framework is only as useful as the investor’s understanding of its limits. Four considerations deserve attention:
The limits of quantitative bank valuation become clearest when the same ANZ model produces a fair value anywhere between roughly $24 and $42 depending solely on the discount rate applied, a spread that reflects different macroeconomic views rather than any arithmetic inconsistency.
The Australian banking sector trades at approximately 22x earnings, roughly double the global banking average of 9.4x. That premium reflects domestic market dynamics, but investors should be aware of it when assessing relative value.
ASIC MoneySmart and ASX Investor Education offer additional resources for retail investors building their analytical toolkit.
The framework explored through NAB’s H1 2026 results is not NAB-specific. It applies to any ASX-listed bank. The five-step process, in summary:
NAB’s current figures illustrate a bank with genuine strengths (above-average ROE, solid CET1, modest P/E discount to peers) and specific areas worth monitoring (below-average NIM, ongoing competitive pressures on margins). That is neither a screaming buy nor an obvious avoid. It is a balanced picture that the framework is designed to produce.
For further research, NAB’s investor relations page, APRA’s prudential handbook, and ASIC MoneySmart all offer primary-source material. Always verify metrics against the most recent official ASX announcements before making any investment decision.
This article is for informational purposes only and should not be considered financial advice. Investors should conduct their own research and consult with financial professionals before making investment decisions. Past performance does not guarantee future results. Financial projections are subject to market conditions and various risk factors.
Net interest margin (NIM) is the spread between the interest a bank earns on its loans and the interest it pays to depositors, expressed as a percentage of interest-earning assets. It is the most direct measure of a bank's core earnings engine, meaning a higher NIM indicates the bank captures more profit on every dollar it lends.
A CET1 ratio comfortably above APRA's regulatory minimums is generally considered healthy; among the ASX major banks in H1 2026, ratios ranged from approximately 11.5% (Westpac) to 12.39% (ANZ). A higher CET1 ratio signals greater resilience to credit losses and stronger capacity to sustain dividend payments.
NAB reported an ROE of 15.2% for H1 2026, placing it at or near the top of the major bank peer group, ahead of ANZ at 11.6% and Westpac at approximately 10%, and broadly in line with CBA at approximately 15%.
The ASX major bank sector trades at approximately 22x earnings, roughly double the global banking average of approximately 9.4x, reflecting domestic market dynamics including concentrated market structure, strong regulatory frameworks, and consistent dividend income that attracts local income-focused investors.
Franking credits represent tax already paid by the company, and for eligible Australian investors they can materially increase the effective yield; for example, NAB's fully franked dividend of A$1.70 per share grosses up to a higher pre-tax equivalent once the attached credit is refunded by the ATO, which can shift a dividend discount model fair value estimate significantly.