
How ASX Triple Witching Works and Why Midday Is the Danger Zone
27 mins ago

An investor managing a portfolio for a family member with no capacity to reinvest distributions faces a fundamentally different selection problem than an accumulator dripping dividends back into the same fund every month. The covered call ETF universe is identical for both. The criteria that determine which fund belongs in each portfolio are not. Most covered call ETF coverage defaults to fund-versus-fund comparison: which vehicle offers the better yield, the longer distribution streak, the stronger total return. That framing skips a prior question, one that determines which metrics even matter for a given investor. This guide explains how reinvestment capacity should anchor every covered call ETF decision, what metrics to prioritise depending on whether distributions are spent or reinvested, and how to apply that framework to real fund selection, including what to do when a fund’s structural changes alter whether it still fits.
Two investors hold the same covered call ETF. One reinvests every distribution. The other spends it as income. After five years, their outcomes diverge sharply, even if the fund’s total return is identical over that period.
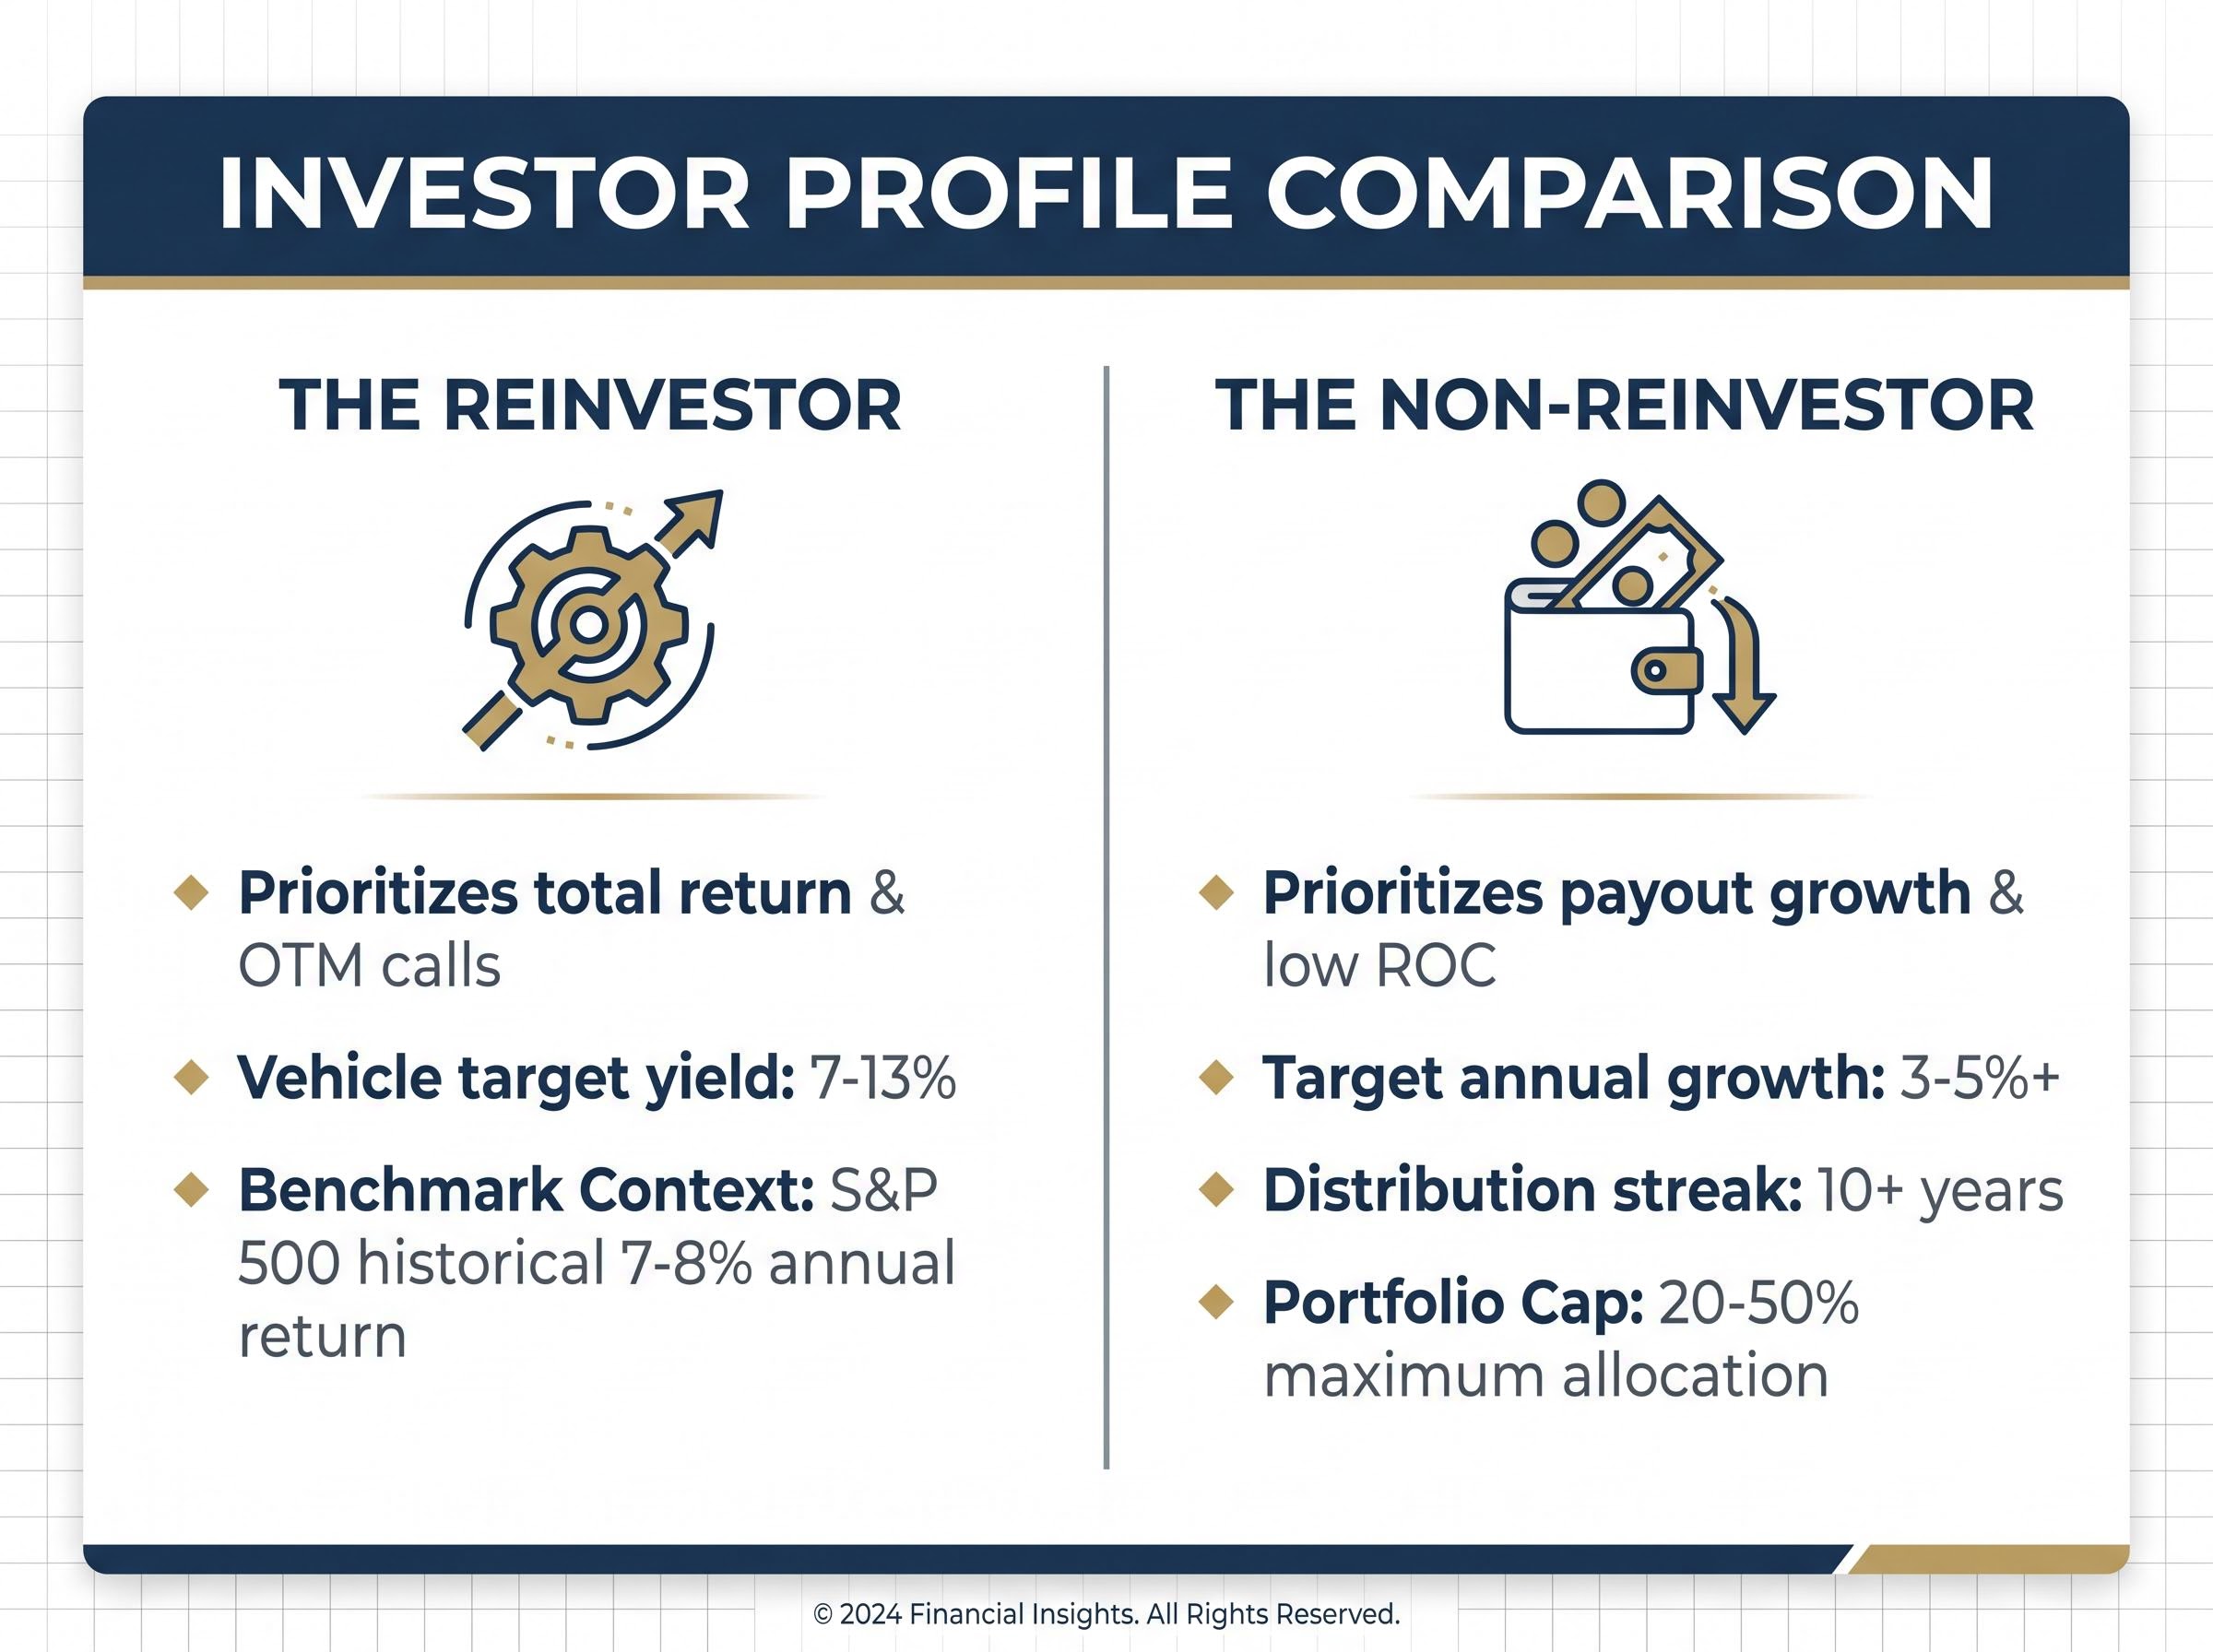
The reinvestor compounds monthly cash flows back into a vehicle that typically yields 7-13%, generating a rising unit count that amplifies future distributions. The non-reinvestor receives a flat stream of payments that loses purchasing power to inflation unless the fund organically grows its payout. Reinvestment capacity is not a preference. It is the single most decisive variable in fund selection.
The two profiles require different evaluation criteria:
For context, the S&P 500 has historically returned approximately 7-8% annually. Reinvestors choosing a capped-upside vehicle over a plain equity index fund are accepting a structural drag on compounding. That tradeoff only makes sense if they understand what they gain in exchange.
ETF portfolio construction decisions extend well beyond the covered call category: the same core questions around cost drag, concentration risk, and tax treatment apply when investors are deciding how much of a total portfolio to allocate to any income-generating vehicle versus plain index exposure.
ETF comparison content defaults to fund-versus-fund framing because it is easier to publish and easier to search. “Best covered call ETF 2026” generates more clicks than “which covered call ETF metric matters for your situation.” The practical consequence is investors selecting on yield or streak length when their circumstances demand they select on payout growth or total return.
Covered call ETFs hold a portfolio of equities and systematically sell call options on those holdings. The premiums collected from selling those options are distributed to investors as income. Premium size is directly tied to implied volatility: when markets are volatile, premiums rise; when conditions are calm, premiums compress.
The tradeoff is structural. By selling a call option, the fund agrees to cap its upside at the strike price. If the underlying stocks rise above that level, the fund cannot participate in those gains. Strong bull markets therefore structurally disadvantage covered call strategies relative to plain equity index funds. This is a feature of the mechanism, not a failure of any individual fund.
When premium income falls short of the fund’s target distribution, many funds maintain payouts through return of capital (ROC), which distributes the investor’s own principal back to them as “income.” Over time, ROC reduces the fund’s net asset value (NAV), eroding the base from which future distributions are generated. For non-reinvestors, this creates a compounding problem: the income looks stable while the asset quietly shrinks.
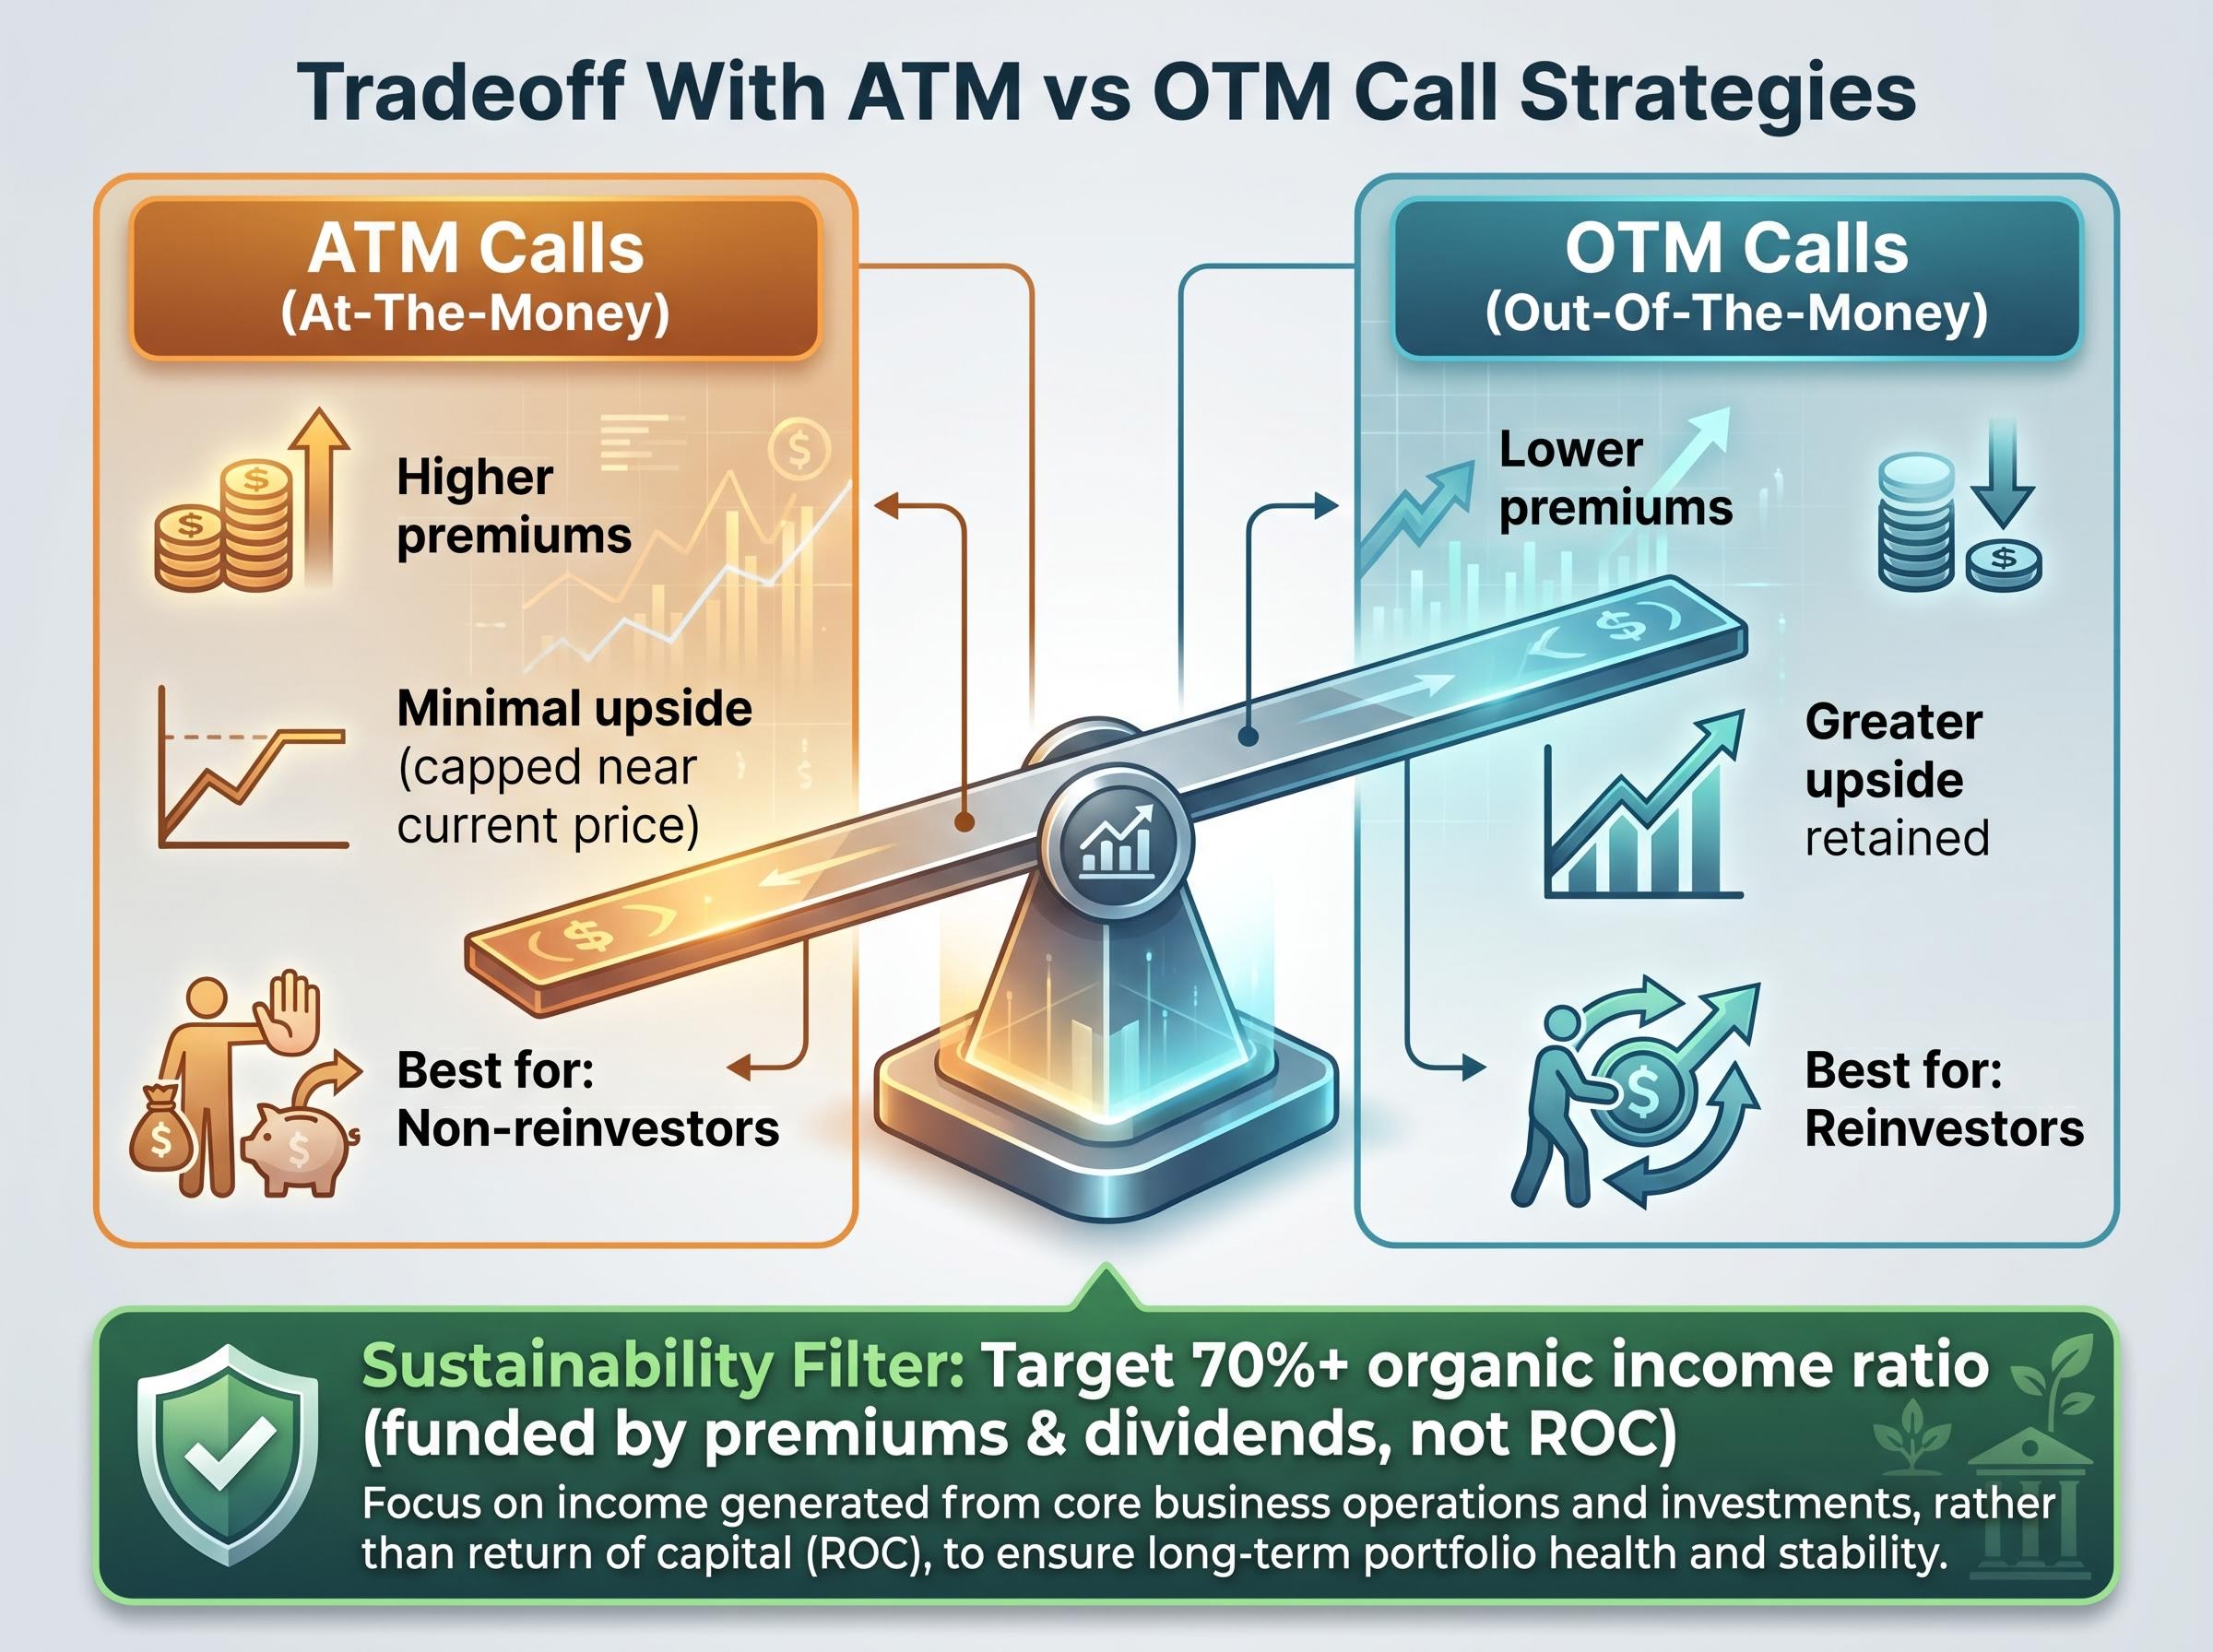
The distinction between at-the-money (ATM) and out-of-the-money (OTM) call strategies determines where a fund sits on the income-versus-growth spectrum.
| Strategy | Income level | Upside participation | Best suited for |
|---|---|---|---|
| ATM calls | Higher premiums | Minimal; gains capped near current price | Non-reinvestors seeking maximum cash flow |
| OTM calls | Lower premiums | Greater; fund retains more equity upside | Reinvestors seeking total return with income |
Practical filter: For income-dependent investors, analysts broadly suggest targeting funds where 70% or more of distributions are funded by actual premiums and dividends rather than ROC. Funds falling below this threshold may be supplementing payouts with principal, a practice that erodes long-run income sustainability.
An investor who spends every distribution is entirely dependent on the fund’s organic payout growth to maintain inflation-adjusted income over a multi-decade retirement. A fund paying a high yield with a flat distribution history is quietly failing that investor, even if the monthly payment never technically drops.
Payout growth history and distribution streak consistency function as evidence of strategy discipline across multiple market cycles. Harvest Brand Leaders Plus Income ETF (HBF) illustrates this well: the fund has maintained an extended streak of unbroken distributions, with a lifetime payout increase and annual growth rate consistent with its operating history. That is modest growth, but the near-uninterrupted reliability is precisely what income-dependent holders require.
By contrast, Harvest Healthcare Leaders Income ETF (HHL) shows an approximately 10-year streak but only approximately 4% annually in historical payout growth. For a non-reinvestor relying on that income stream for decades, inflation erosion becomes a genuine long-run concern.
Sequencing risk sharpens the stakes further. A distribution cut or NAV erosion event early in retirement, before recovery is possible, disproportionately harms non-reinvestors who cannot reduce spending to compensate. The damage compounds forward.
Non-reinvestors should screen for:
Advisors broadly suggest capping covered call ETF allocation at 20-50% of a total portfolio for income-dependent investors. The remainder should include bonds, dividend growth equities, or real-return instruments that provide uncapped income streams. Diversifying across funds with different underlying sector exposures further reduces the volatility risk of depending on a single options strategy in a single market segment.
A blended covered call ETF strategy, built around the Anchor, Booster, and Juicer framework, allows income-dependent investors to assign each fund a defined role based on yield, NAV stability, and return-of-capital profile before setting allocation weights, rather than sizing positions on yield alone.
For an investor compounding distributions back into the fund, capped upside becomes the primary drag on long-run returns. In a bull market, a covered call ETF structurally underperforms its benchmark index. That underperformance compounds forward every month the reinvestor buys more units of a vehicle that cannot fully participate in rising markets.
Covered call ETFs structurally underperform plain equity index funds in strong bull markets. This is a verified feature of the strategy, not a fund-specific failure. Reinvestors should accept this tradeoff knowingly rather than discover it as a surprise.
SSRN research on covered call return drag confirms a strong negative mechanical relationship between derivative income yield and total return, finding that higher-yielding covered call strategies tend to produce lower total returns, greater tax realisation, and a more negatively skewed return profile across market cycles.
OTM call strategies, which sacrifice some premium income for greater equity participation, are generally the superior choice for reinvestors compounding over time. Harvest Tech Achievers Growth and Income ETF (HTA) demonstrates what strong underlying holdings can deliver: current distributions of approximately $0.13/unit monthly, with a historical payout growth of approximately 4-4.5% over its lifetime. That distribution growth reflects strong underlying equity performance, which also feeds total return.
Concentrated covered call funds, which write options on a small basket of individual stocks rather than a broad index, delivered only 0.26% in year-to-date price appreciation through May 2026 compared to 2.72% for index-proxy equivalents, meaning nearly all investor returns in that category arrived as distributions rather than NAV growth, a profile that suits non-reinvestors spending income but compounds cost drag for accumulators.
Hamilton Enhanced U.S. Covered Call ETF (HYLD) offers another lens. With a yield of approximately 12-13%, historical distribution CAGR of roughly 6-7%, and a 2024 total return of approximately 20%, the fund shifted in Q4 2024 toward increased OTM call weighting, aiming to capture more upside participation. For a reinvestor, that strategic evolution matters more than the yield figure.
Before selecting a covered call ETF, reinvestors should ask three questions:
HYLD provides a concrete case study in why fund selection is not a one-time decision. The fund originally operated as a fund-of-funds model, holding third-party external products. Around 2023, it underwent a distribution cut (from approximately $0.14 to approximately $0.12) and transitioned to an internally managed covered call writing strategy, a substantial operational shift that changed the fund’s risk and income profile.
| Period | Distribution level | Strategy type | Best suited for |
|---|---|---|---|
| Pre-2023 | ~$0.14/unit | Fund-of-funds (external products) | Non-reinvestors seeking stable income |
| Post-2023 | ~$0.12, recovering to ~$0.15 | Internally managed covered call writing (OTM shift in Q4 2024) | Reinvestors seeking total return with income |
A non-reinvestor who selected HYLD for its pre-2023 distribution history would need to re-evaluate after the cut and the strategy overhaul. The fund they originally analysed no longer exists in the same form. The distribution recovered to approximately $0.15 over the subsequent three years, and lifetime distribution growth sits at roughly 12.73% (approximately 3% annually) over four years of operation. But the income profile, the strategy mechanics, and the risk characteristics all shifted.
Community investor response to distribution cuts in well-known funds typically treats them as significant re-evaluation triggers, not short-term noise. That instinct is sound.
Any material change warrants re-running the same evaluation used at initial selection. Specific triggers include:
The framework consolidates into a clear sequence. Determine reinvestment capacity first. Select the metrics that matter for that investor type. Evaluate specific funds against those metrics. Monitor for structural changes that may shift suitability.
| Investor type | Primary metric | Secondary metric | What to avoid |
|---|---|---|---|
| Non-reinvestor / retiree spending income | Payout growth (3-5%+ annually) | Distribution streak consistency (10+ years) | High ROC, yield-only selection, no growth track record |
| Near-retiree / transitioning | Payout growth + low ROC | Total return consideration | Highly leveraged or ATM-only strategies |
| Reinvestor / accumulator | Total return vs. benchmark | Low NAV erosion | Chasing raw yield without benchmark comparison |
| Universal filter (all investors) | Organic income ratio (70%+) | Strategy transparency (ATM vs. OTM disclosed) | Funds without clear strategy disclosure |
The four-step selection sequence:
Chasing raw yield without this prior step remains the single most common mistake in covered call ETF selection. The same fund can be ideal or problematic depending solely on who holds it. The practical next step: categorise your reinvestment situation before opening a fund comparison tool, not after.
Tax-deferred distribution structures, such as those used by JP Morgan’s ROCQ and ROCY funds launched in March 2026, use FLEX options call spreads to classify payouts as return of capital and defer tax liability until shares are sold, offering a meaningfully different after-tax profile compared with ELN-based funds that distribute ordinary income annually, a distinction that changes the optimal fund choice for investors holding covered call ETFs in taxable accounts.
This article is for informational purposes only and should not be considered financial advice. Investors should conduct their own research and consult with financial professionals before making investment decisions. Past performance does not guarantee future results. Financial projections are subject to market conditions and various risk factors.
—
A covered call ETF holds a portfolio of equities and systematically sells call options on those holdings, distributing the premiums collected as income to investors. The tradeoff is a cap on upside participation: if the underlying stocks rise above the option strike price, the fund cannot capture those gains.
Return of capital (ROC) occurs when a fund's premium income falls short of its target distribution and it pays investors back their own principal as income, which gradually erodes the fund's net asset value. Investors relying on distributions for spending should target funds where 70% or more of payouts come from actual premiums and dividends rather than ROC, to protect long-run income sustainability.
Yes, reinvestors should prioritise total return relative to benchmarks, NAV trajectory, and out-of-the-money call strategies that preserve more equity upside, while income-spending investors should focus on payout growth history of 3-5% or more annually, distribution streak consistency of 10 or more years, and a low return-of-capital ratio.
A strategy change, such as a shift from a fund-of-funds model to direct covered call writing or a move from at-the-money to out-of-the-money calls, alters the fund's income profile and risk characteristics, meaning investors should re-run their original evaluation criteria to determine whether the fund still fits their situation. The article uses Hamilton Enhanced U.S. Covered Call ETF (HYLD) as a concrete example of how a distribution cut and strategy overhaul around 2023 changed which investor type the fund best suited.
Advisors broadly suggest capping covered call ETF allocation at 20-50% of a total portfolio for income-dependent investors, with the remainder held in bonds, dividend growth equities, or real-return instruments that provide uncapped income streams and reduce reliance on a single options strategy.