CBA’s Share Price at $176: What a DDM Says It’s Actually Worth
42 mins ago

Most Australian investors check their portfolio balance regularly. Far fewer measure that balance against anything. A 9% annual return sounds strong in isolation, but without a reference point it carries no meaning. Did the broader market return 12%? Did a passive index fund deliver the same result for a fraction of the effort? Morningstar Australia publishes a monthly market index performance report covering Australian, US, European, and Asian benchmarks, and it remains one of the most accessible yet underused tools available to retail investors. In May 2026, with Australian equities continuing to lag US markets and the gap between domestic and global returns widening, the case for benchmarking has rarely been clearer. This guide shows how to read monthly index reports, choose the right benchmarks for a specific portfolio, and turn monthly snapshots into a coherent long-term performance narrative, without needing a financial adviser to interpret the numbers.
A portfolio return is a number. A number without context is not a result.
An investor who earned 8% over the past twelve months may feel satisfied, but that figure only becomes informative when placed against a relevant reference point that reflects their actual asset mix and risk profile. The real question is not “did I make money?” but “did I make more than I would have by holding a passive index?” That gap, the opportunity cost of active decision-making, is what benchmarking measures.
The error most commonly made is structural, not mathematical. Comparing a diversified multi-asset portfolio solely against the S&P/ASX 300 is not a minor shortcut. It is a misaligned comparison that can mask persistent underperformance for years. If the portfolio holds 40% in global equities and bonds, the ASX 300 tells the investor nothing about whether those allocations added or subtracted value.
Vanguard Australia’s 2026 Portfolio Trends report found that advisers are increasingly recommending global equity diversification alongside domestic holdings. Domestic-only benchmarks are growing more inadequate with each year that Australian portfolios become more international.
The error extends beyond benchmarking methodology: home bias in Australian portfolios has produced a measurable compounding cost over the past decade, with ASX 200/300 annualised returns of 11.1% trailing the MSCI World at 12.5% and the S&P 500 at 15.5%, a gap that franking credits alone do not close for growth-oriented investors.
What a benchmark tells you:
What raw return figures alone cannot tell you:
A benchmark is only meaningful when it mirrors the investor’s actual asset class exposures. A mismatched benchmark provides false reassurance or false alarm, both equally damaging.
Opening the report for the first time can feel like encountering a wall of index names and percentage figures. The structure, once understood, is straightforward.
Morningstar Australia publishes these reports on a consistent monthly cadence. The most recent edition covers April 2026, released on 11 May 2026. Each report tracks short-term and extended performance results across Australian, US, European, and Asian benchmarks, providing a single document that captures the major building blocks of a diversified portfolio.
The report is produced for Morningstar Australasia clients and New Zealand wholesale clients. It is positioned as a supplementary investment resource, not financial advice. For retail investors, its value lies in the breadth of index coverage in one place.
The indices covered map directly to the major asset classes a diversified investor holds. The table below shows what each tracks and why it matters.
| Index name | Asset class | Region | What it measures for a retail investor |
|---|---|---|---|
| S&P/ASX 300 | Equities | Australia | Broad Australian share market performance |
| S&P/ASX 200 | Equities | Australia | Large-cap Australian share performance |
| MSCI World ex Australia | Equities | Global (developed) | International share performance excluding Australia |
| Bloomberg Global Aggregate Bond Index | Fixed income | Global | Global bond market returns |
| FTSE EPRA/NAREIT | Real estate | Global | Listed real estate investment trust performance |
Previous monthly editions (January, February, March 2026) are also available, enabling multi-month trend analysis from a single source.
The reports are freely downloadable as PDFs from the Morningstar Australia website. No subscription is required for the index performance documents.
The archive (January through April 2026 at minimum) allows investors to construct a rolling four-month picture, which is more instructive than any single edition. When starting out, accessing at least three to six months of back-issues establishes a performance baseline before interpreting current figures. A single month in isolation invites the same problem as a single portfolio return: a number without context.
The principle is simple: a benchmark should be a weighted blend of indices that mirrors the investor’s actual exposure across equities, bonds, and alternatives. The execution is more practical than it sounds.
Consider a typical Australian balanced portfolio split 60% equities and 40% bonds. If the equity portion is divided equally between domestic and international shares, and the bond allocation is entirely global fixed income, the benchmark blend might look like this: 30% S&P/ASX 200 performance, 30% MSCI World ex Australia performance, and 40% Bloomberg Global Aggregate Bond Index performance.
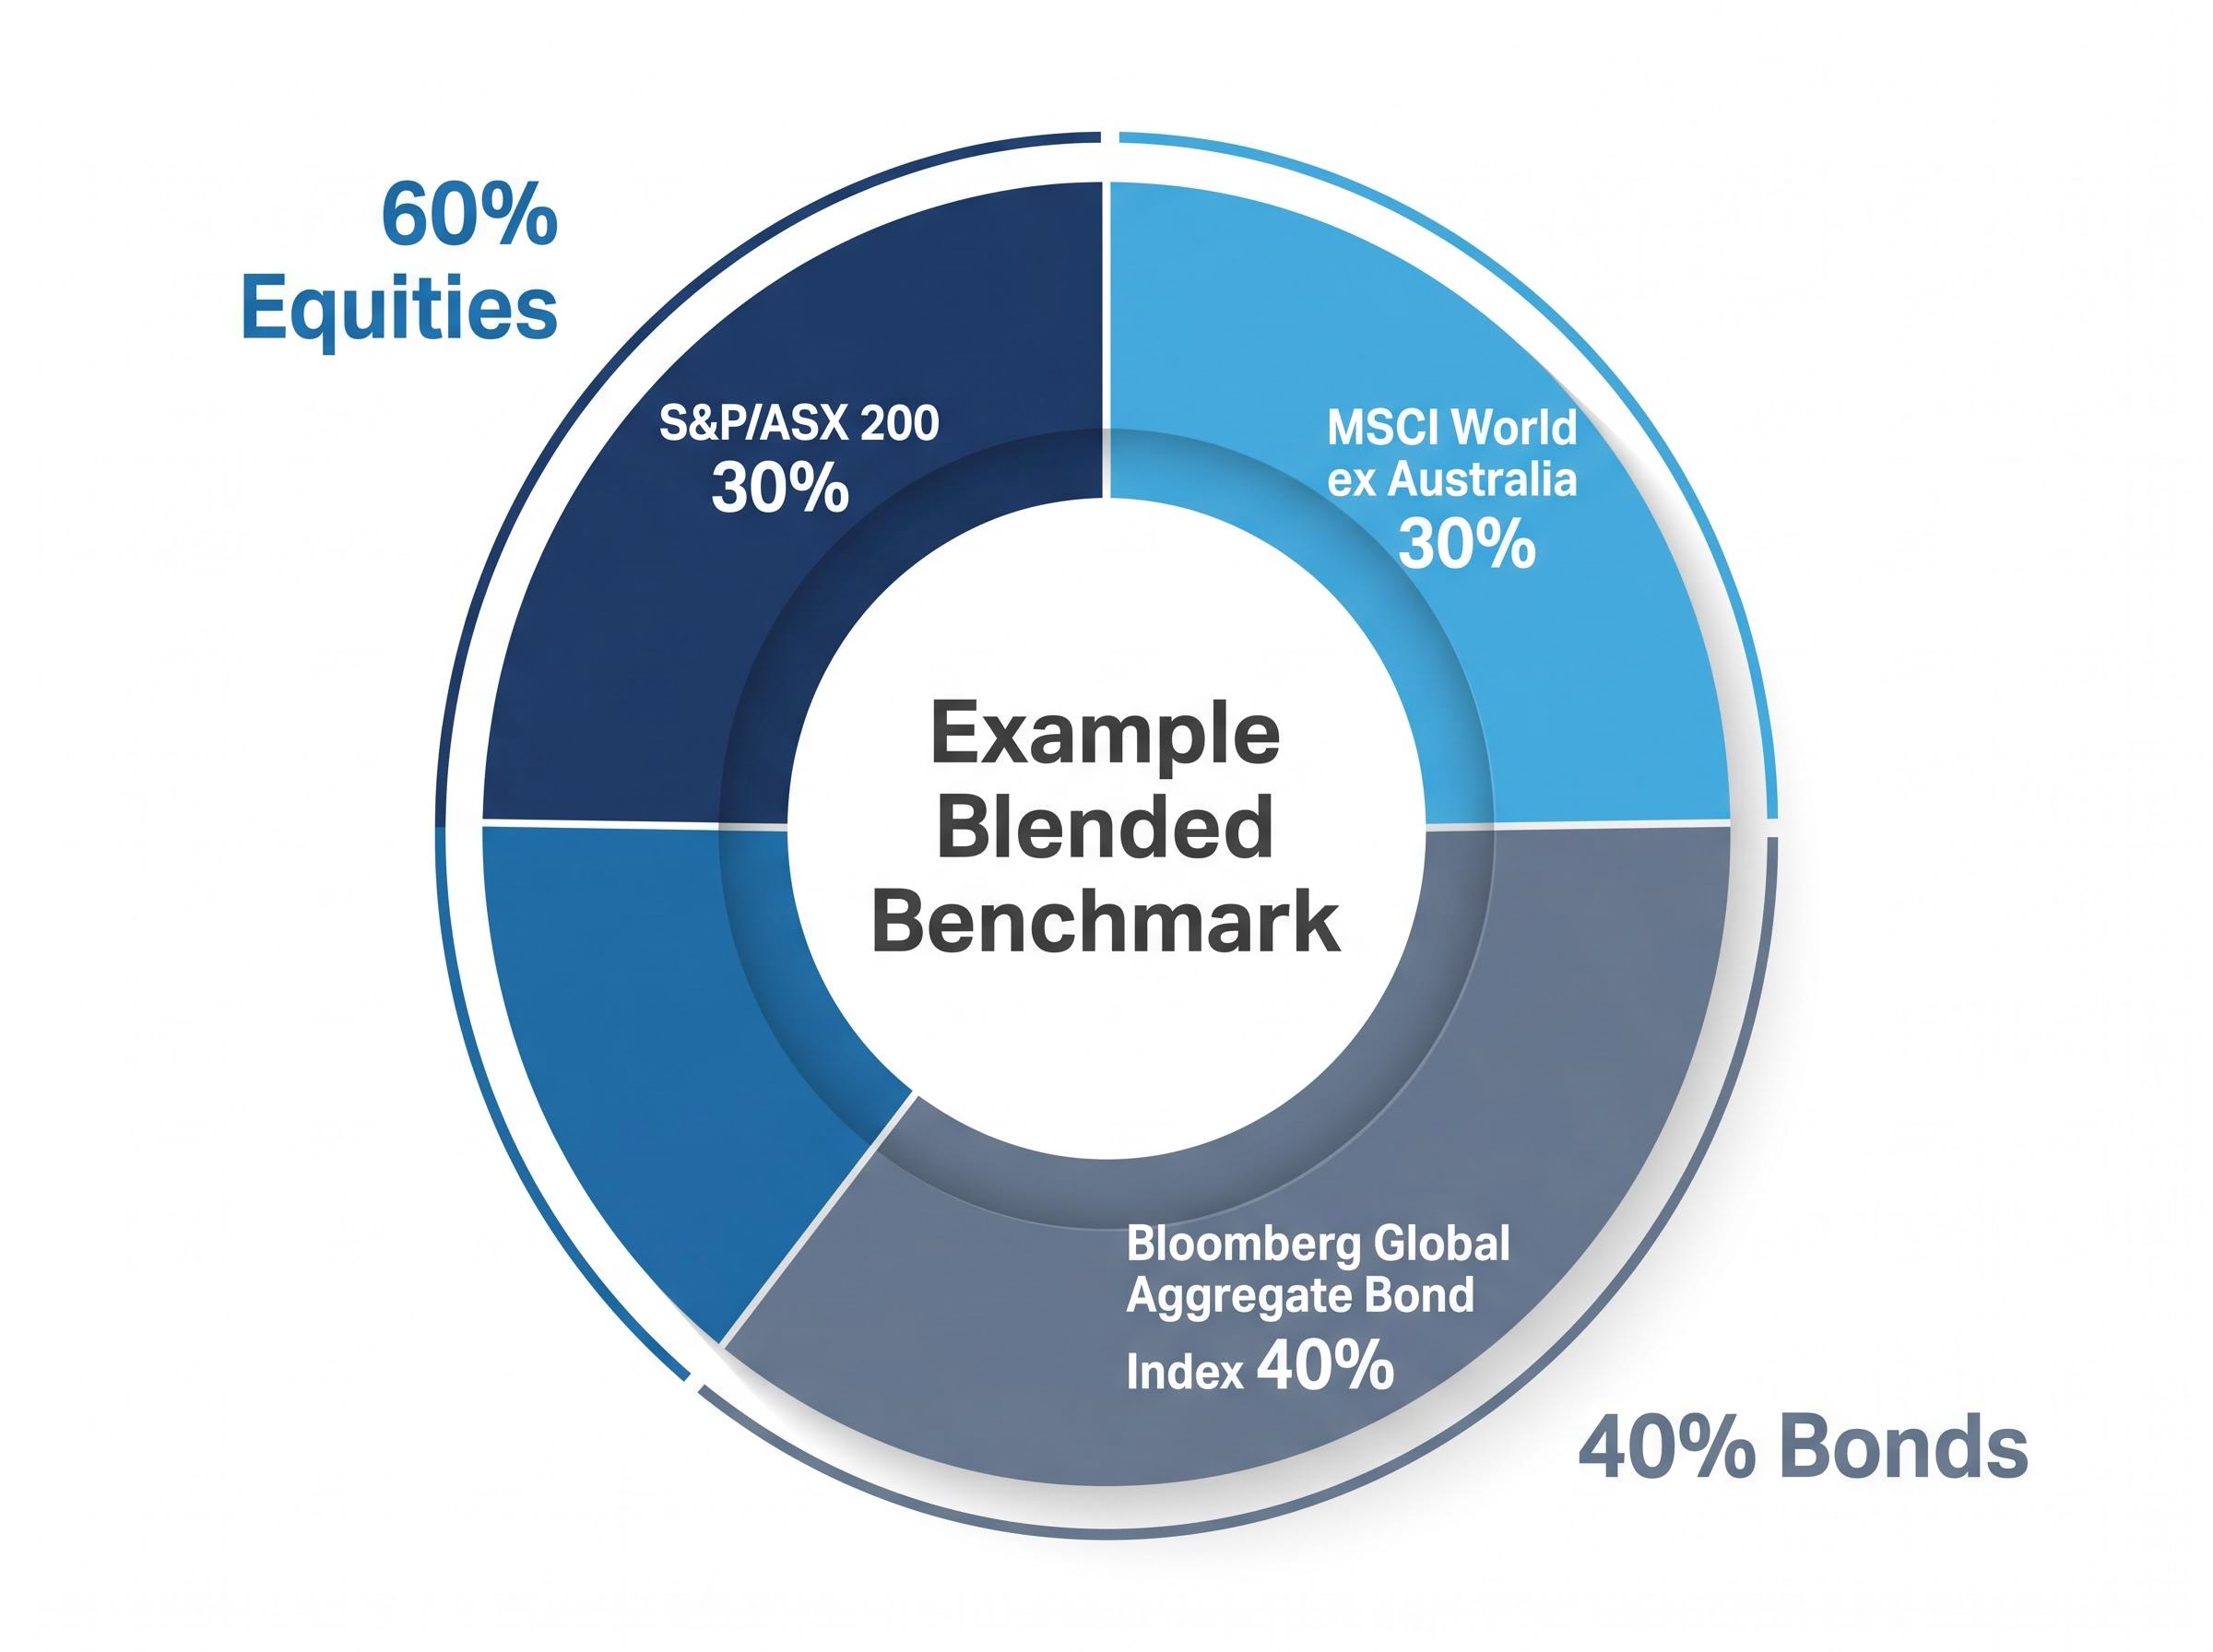
The monthly Morningstar report provides the return figures for each of those indices. The investor multiplies each index return by its portfolio weight, sums the results, and arrives at a single blended benchmark return for the month.
Three ETFs commonly serve as practical proxy benchmarks in the Australian retail context:
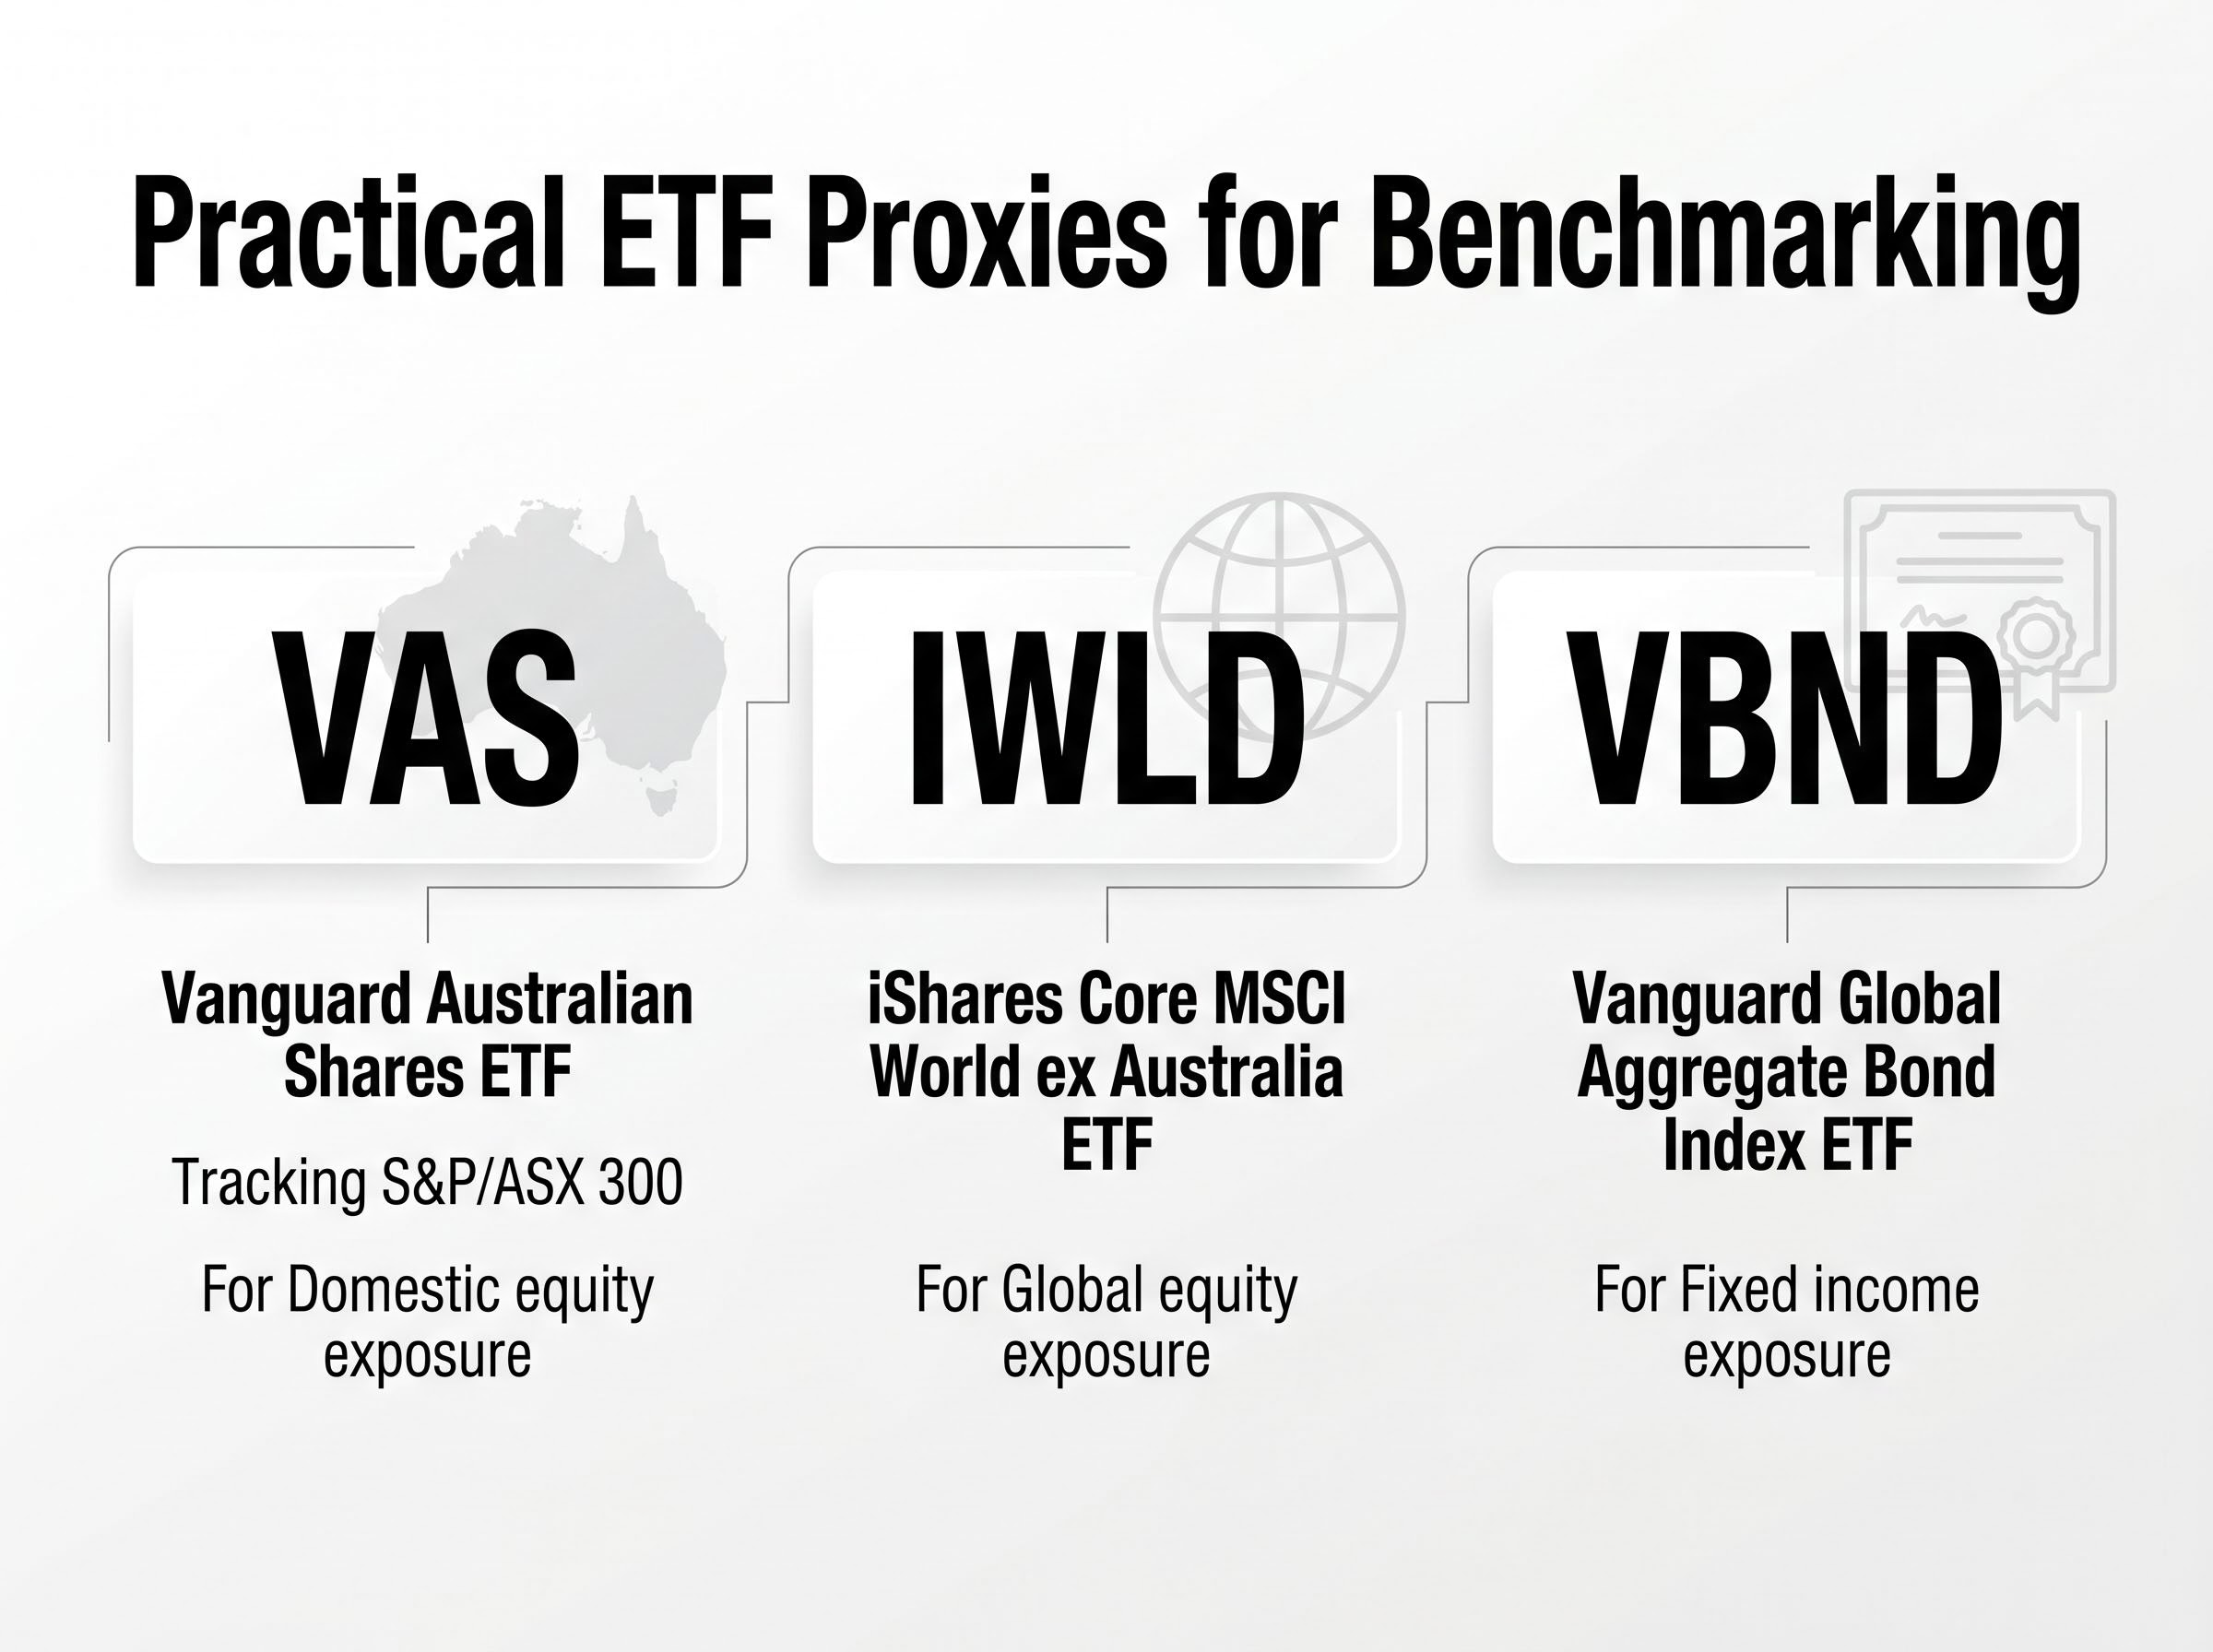
These are useful because they allow investors to compare their own stock-picking or fund selection against low-cost passive alternatives, the clearest test of whether active decisions have added value.
The Morningstar Balanced (50) portfolio structure provides a documented example of how blended benchmarks are applied in practice. Vanguard Australia’s 2026 adviser preference data shows an average domestic fixed income allocation of approximately 65%, with increasing global equity diversification, offering context for what a typical balanced benchmark might look like.
The construction process in three steps:
Comparing a balanced portfolio against the ASX 300 alone is like measuring a triathlon result against a sprint time. The comparison tells the investor nothing about the parts of the race that matter most to their actual finish.
Monthly index reports arrive twelve times a year, each carrying an implicit invitation to react. A single month of underperformance can feel urgent. It rarely is.
The most valuable use of a monthly report is as one data point in a trend, not as a standalone signal. Treating a single month’s result as actionable, selling an underperforming asset class or rotating into the month’s winner, is a documented retail investor error that compounds over time. The Morningstar report itself provides the antidote: trailing 3-month, 6-month, and 12-month figures sit alongside the monthly number, turning a snapshot into a directional trend.
The current divergence between Australian and US equity performance illustrates the point. Australian equities have lagged US markets through 2025 and into 2026, driven largely by the technology sector composition difference. The S&P/ASX 200 carries minimal technology weighting compared to the S&P 500. An investor who reacted to a single month of relative underperformance by shifting from Australian to US equities would have been chasing a composition effect, not making an informed allocation decision. Historical Morningstar data suggests that prolonged periods of US outperformance relative to Australia have historically been followed by reversals.
ASX sector concentration explains much of the divergence: financials and materials together account for roughly 45% of the ASX 300, anchoring the index to regulated lending growth and commodity cycles rather than the technology-driven reinvestment that powered S&P 500 returns of 16.03% per year in Australian dollar terms over 15 years to April 2026.
The S&P/ASX 200 has also offered lower volatility than the S&P 500, providing a different risk-return profile that is particularly relevant for conservative and balanced investors.
What monthly data is useful for:
What monthly data should not drive:
The monthly archive provides the raw material for a simple running log. Each month, the investor records three figures: the date, their portfolio return, and their blended benchmark return. The variance between the two is the signal.
A lightweight spreadsheet approach works well: one row per month, three columns (date, portfolio return, benchmark return), reviewed quarterly. Over 12 months, this rolling window smooths out short-term volatility and reveals whether the investor is consistently tracking, beating, or lagging their benchmark. That pattern, not any individual month, is what matters.
The right platform reduces benchmarking from a quarterly manual exercise to something close to automated, making it far more likely the habit sticks.
Several Australian retail platforms offer benchmarking and tracking features suited to different investor profiles. Morningstar Investor’s X-Ray feature deserves particular mention: it allows investors to decompose their holdings and assess alignment with benchmark indices, making it directly complementary to the monthly index reports discussed throughout this guide.
ASIC’s RG 97 fee disclosure requirements mandate that managed funds and superannuation products present costs in a standardised format, which means investors reading a Product Disclosure Statement can extract the total annual cost of a fund and factor it directly into any performance comparison against a passive index benchmark.
For investors who work with a financial adviser, HUB24 has retained leadership in the adviser-platform space as of 2026, with integrated benchmarking and reporting tools. The broader fintech platform landscape continues to expand among Australian retail investors.
| Platform | Best suited to | Benchmarking capability | Key feature |
|---|---|---|---|
| Interactive Brokers | Sophisticated retail investors | Custom multi-asset benchmarks | Low fees, advanced analytics |
| SelfWealth | Domestic equity investors | ASX-focused tracking | Straightforward portfolio monitoring |
| Morningstar Investor | Research-oriented investors | X-Ray portfolio decomposition | Direct alignment with monthly index reports |
| HUB24 | Adviser-directed investors | Integrated benchmarking and reporting | Leading adviser platform as of 2026 |
| eToro | Engagement-focused investors | Basic benchmarking tools | Social trading and community features |
The choice depends on what the investor already holds and how they prefer to interact with their portfolio. An ASX-only investor may find SelfWealth sufficient. A multi-asset investor tracking a blended benchmark will need the depth of Interactive Brokers or Morningstar Investor.
Investors who are getting nothing useful from monthly reports are almost certainly making one or more of the following errors. Each is a logical consequence of a misunderstanding that is straightforward to correct once identified.
Portfolio rebalancing triggers are one of the most practical outputs of a consistent benchmarking habit: Vanguard’s framework recommends acting when any single asset class drifts more than 5 percentage points from its target weight, a threshold that only becomes visible when monthly index returns are tracked against a blended benchmark over time.
Benchmarks are only effective performance measurement tools when they reflect the investor’s actual asset class exposures. A mismatched benchmark produces a comparison without meaning.
Monthly index reports like Morningstar Australia’s are genuinely useful, but only when paired with a well-constructed benchmark, a long-term perspective, and the discipline to resist reacting to short-term noise. Without all three, the report is just another PDF collecting dust in a downloads folder.
The starting action is concrete: download the most recent Morningstar Australia monthly report, identify the two or three indices most relevant to the portfolio, and record those figures against the portfolio’s own return for the month. That single entry is the beginning of a tracking habit, not a one-time exercise. The value compounds as the personal performance archive grows, revealing patterns that no single monthly edition can show on its own.
Related StockWire X guides on portfolio construction, index ETFs, and rebalancing strategies offer the next practical steps for investors building this discipline from the ground up.
For investors who are newer to portfolio construction and want to build the foundational knowledge before applying benchmarking discipline, our comprehensive walkthrough of investing for beginners covers how to match investment vehicles to a risk profile, why fee selection is one of the highest-impact decisions available, and how to avoid the structural mistakes that compound quietly over time.
This article is for informational purposes only and should not be considered financial advice. Investors should conduct their own research and consult with financial professionals before making investment decisions.
Benchmarking portfolio performance means comparing your portfolio's return against a relevant reference index or blended index that reflects your actual asset class exposures, so you can assess whether your investment decisions added value relative to a passive alternative.
Identify the asset class weights in your portfolio, select the corresponding index for each class from the Morningstar monthly report, then multiply each index return by its portfolio weight and sum the results to produce a single blended benchmark return.
Morningstar Australia's monthly index performance reports are freely downloadable as PDFs from the Morningstar Australia website, with no subscription required, and the archive typically covers at least the most recent four months of data.
A typical 60/40 Australian balanced portfolio can be benchmarked using a weighted blend of the S&P/ASX 200 for domestic equities, the MSCI World ex Australia for international equities, and the Bloomberg Global Aggregate Bond Index for fixed income exposure.
The ASX 300 only reflects Australian large-cap equities, so if your portfolio also holds global equities or bonds, the comparison ignores those allocations entirely and can mask persistent underperformance in parts of the portfolio that the ASX 300 does not represent.