
How to Value a Stock Using Tesla’s $2,500 Analyst Spread
17 mins ago

At a forward P/E of roughly 185x to 217x, Tesla’s stock is not being priced as a car company. It is being priced as a bet that a transformation nobody can fully verify has already begun. The company sits at a rare valuation inflection point in May 2026: the market has already priced in a future that is partially real (Robotaxi operating in six U.S. cities, Optimus V3 in production) and partially unproven (no positive free cash flow from autonomy, Optimus not yet commercially deployed). This makes Tesla an unusually instructive case study for investors who want to understand how stock valuation analysis works when a company is mid-transition.
What follows is a replicable framework, built on Tesla’s actual Q1 2026 numbers and analyst scenarios, for evaluating any company whose share price is pricing in a future that has not yet arrived. By the end, readers will understand how to construct bull and bear scenarios, why entry price determines whether a correct thesis still makes money, and what questions to ask before committing capital to transformation stories.
Traditional valuation anchors on what a business earns today. An investor can look at Ford or GM, apply a near-term earnings multiple, and arrive at a defensible estimate of value. The numbers exist. The margins are observable. The revenue streams are mature.
Tesla forces a different exercise entirely. Its stock price reflects not just what the company currently produces but the probability and timing of revenue streams that do not yet generate meaningful cash flow. This is a probability-weighted bet on what a company will become, and it requires modification of the standard toolkit before it can be applied.
The market has already embedded a partial transformation premium into the share price. Consider where Tesla sits relative to its peer groups:
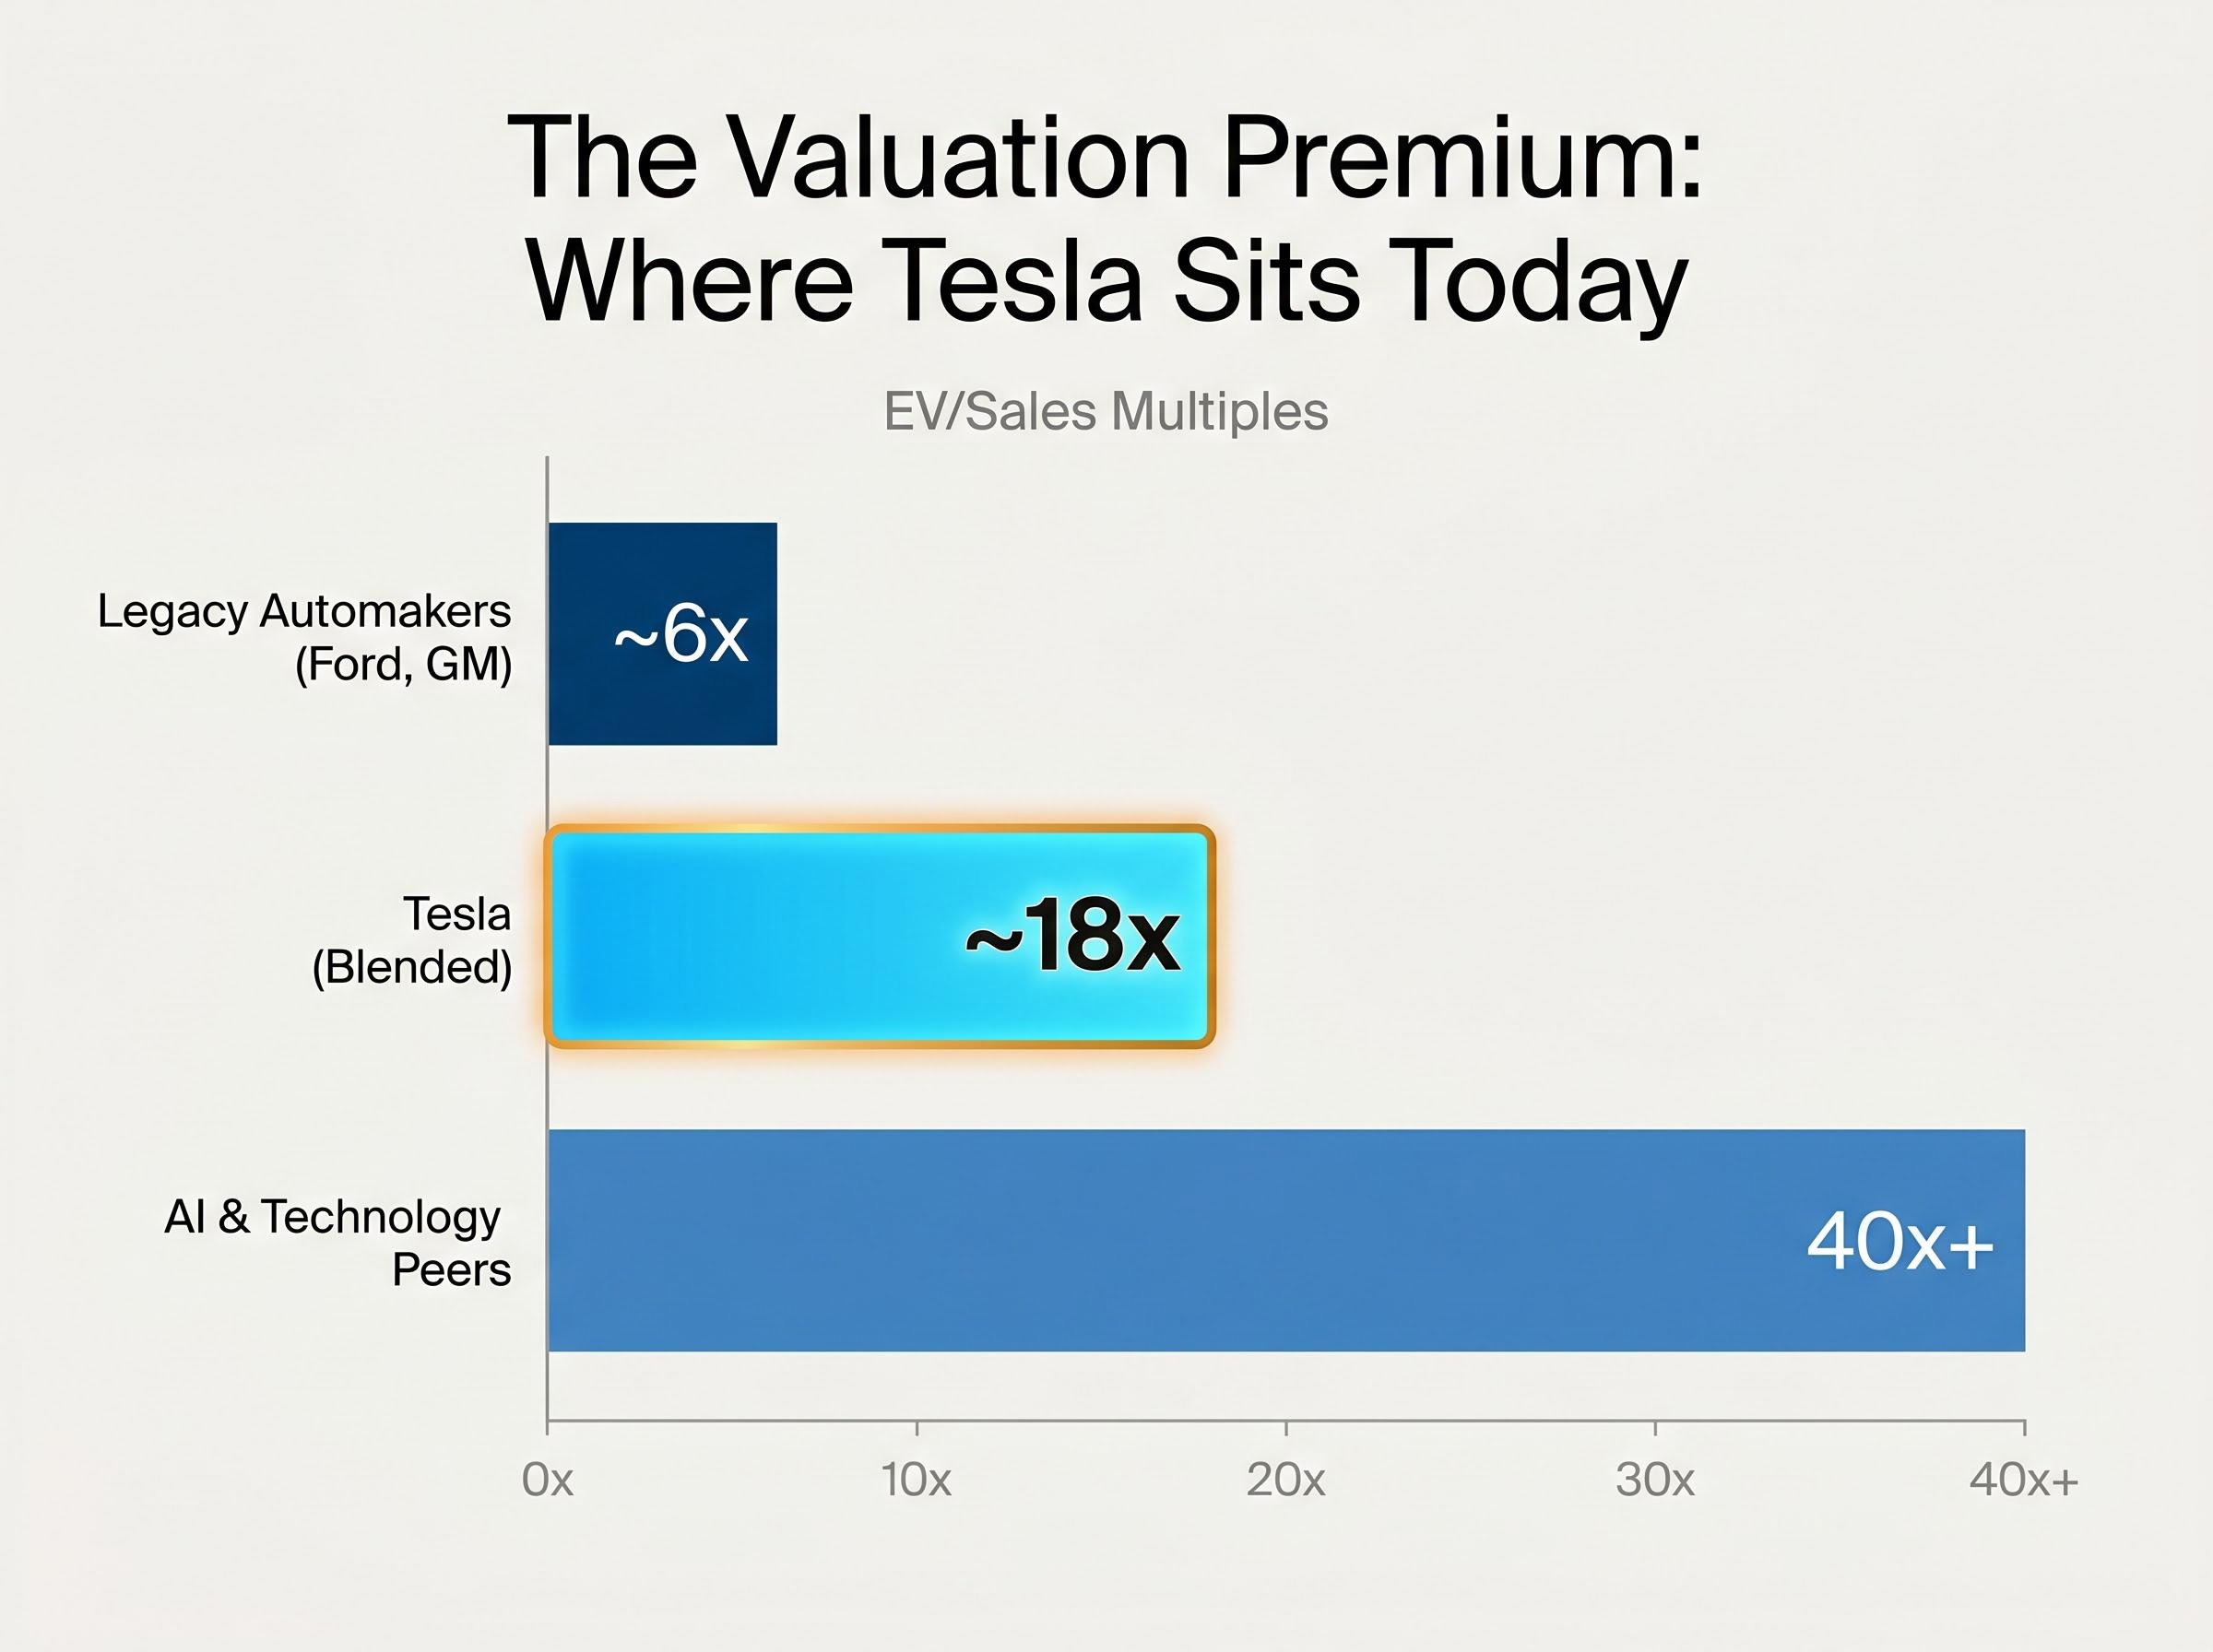
Tesla’s forward P/E of 185x to 217x sits far above automotive norms. For context, the company’s trailing P/E averaged roughly 100x over 2020 to 2024 and peaked near 1,200x in 2021. Today’s premium is elevated but not unprecedented within Tesla’s own history.
The valuation challenge for any company in transition is the same: separating what the stock currently prices in from what the underlying business actually demonstrates. That gap is where investment returns, and investment losses, are made. Every section that follows builds from this principle.
The gap between intrinsic value estimates and a stock’s live market price is not an anomaly but a product of price discovery mechanics: the continuous auction of competing bids and offers that aggregates every participant’s probability-weighted view of a company’s future into a single clearing price.
Scenario-based valuation is a structured way to test what different assumptions about a company’s future produce in terms of investor returns. Rather than forecasting a single outcome, the approach assigns different assumptions to three core variables and calculates the return implied by each combination.
Those three variables are the engine of every scenario:
NYU Stern’s probabilistic valuation framework formalises the mechanics behind scenario analysis, establishing that the expected value of a business is the probability-weighted average of cash flows across all plausible outcomes, not a single point estimate, which is precisely the principle that makes three-scenario modelling more rigorous than consensus forecasting alone.
The starting point for Tesla’s scenarios is observable. Q1 2026 revenue came in at $22.4 billion, up 16% year over year and ahead of consensus. Gross margin reached 21.7%, well above the 17% analyst consensus had projected. These figures provide the base from which forward assumptions are built.
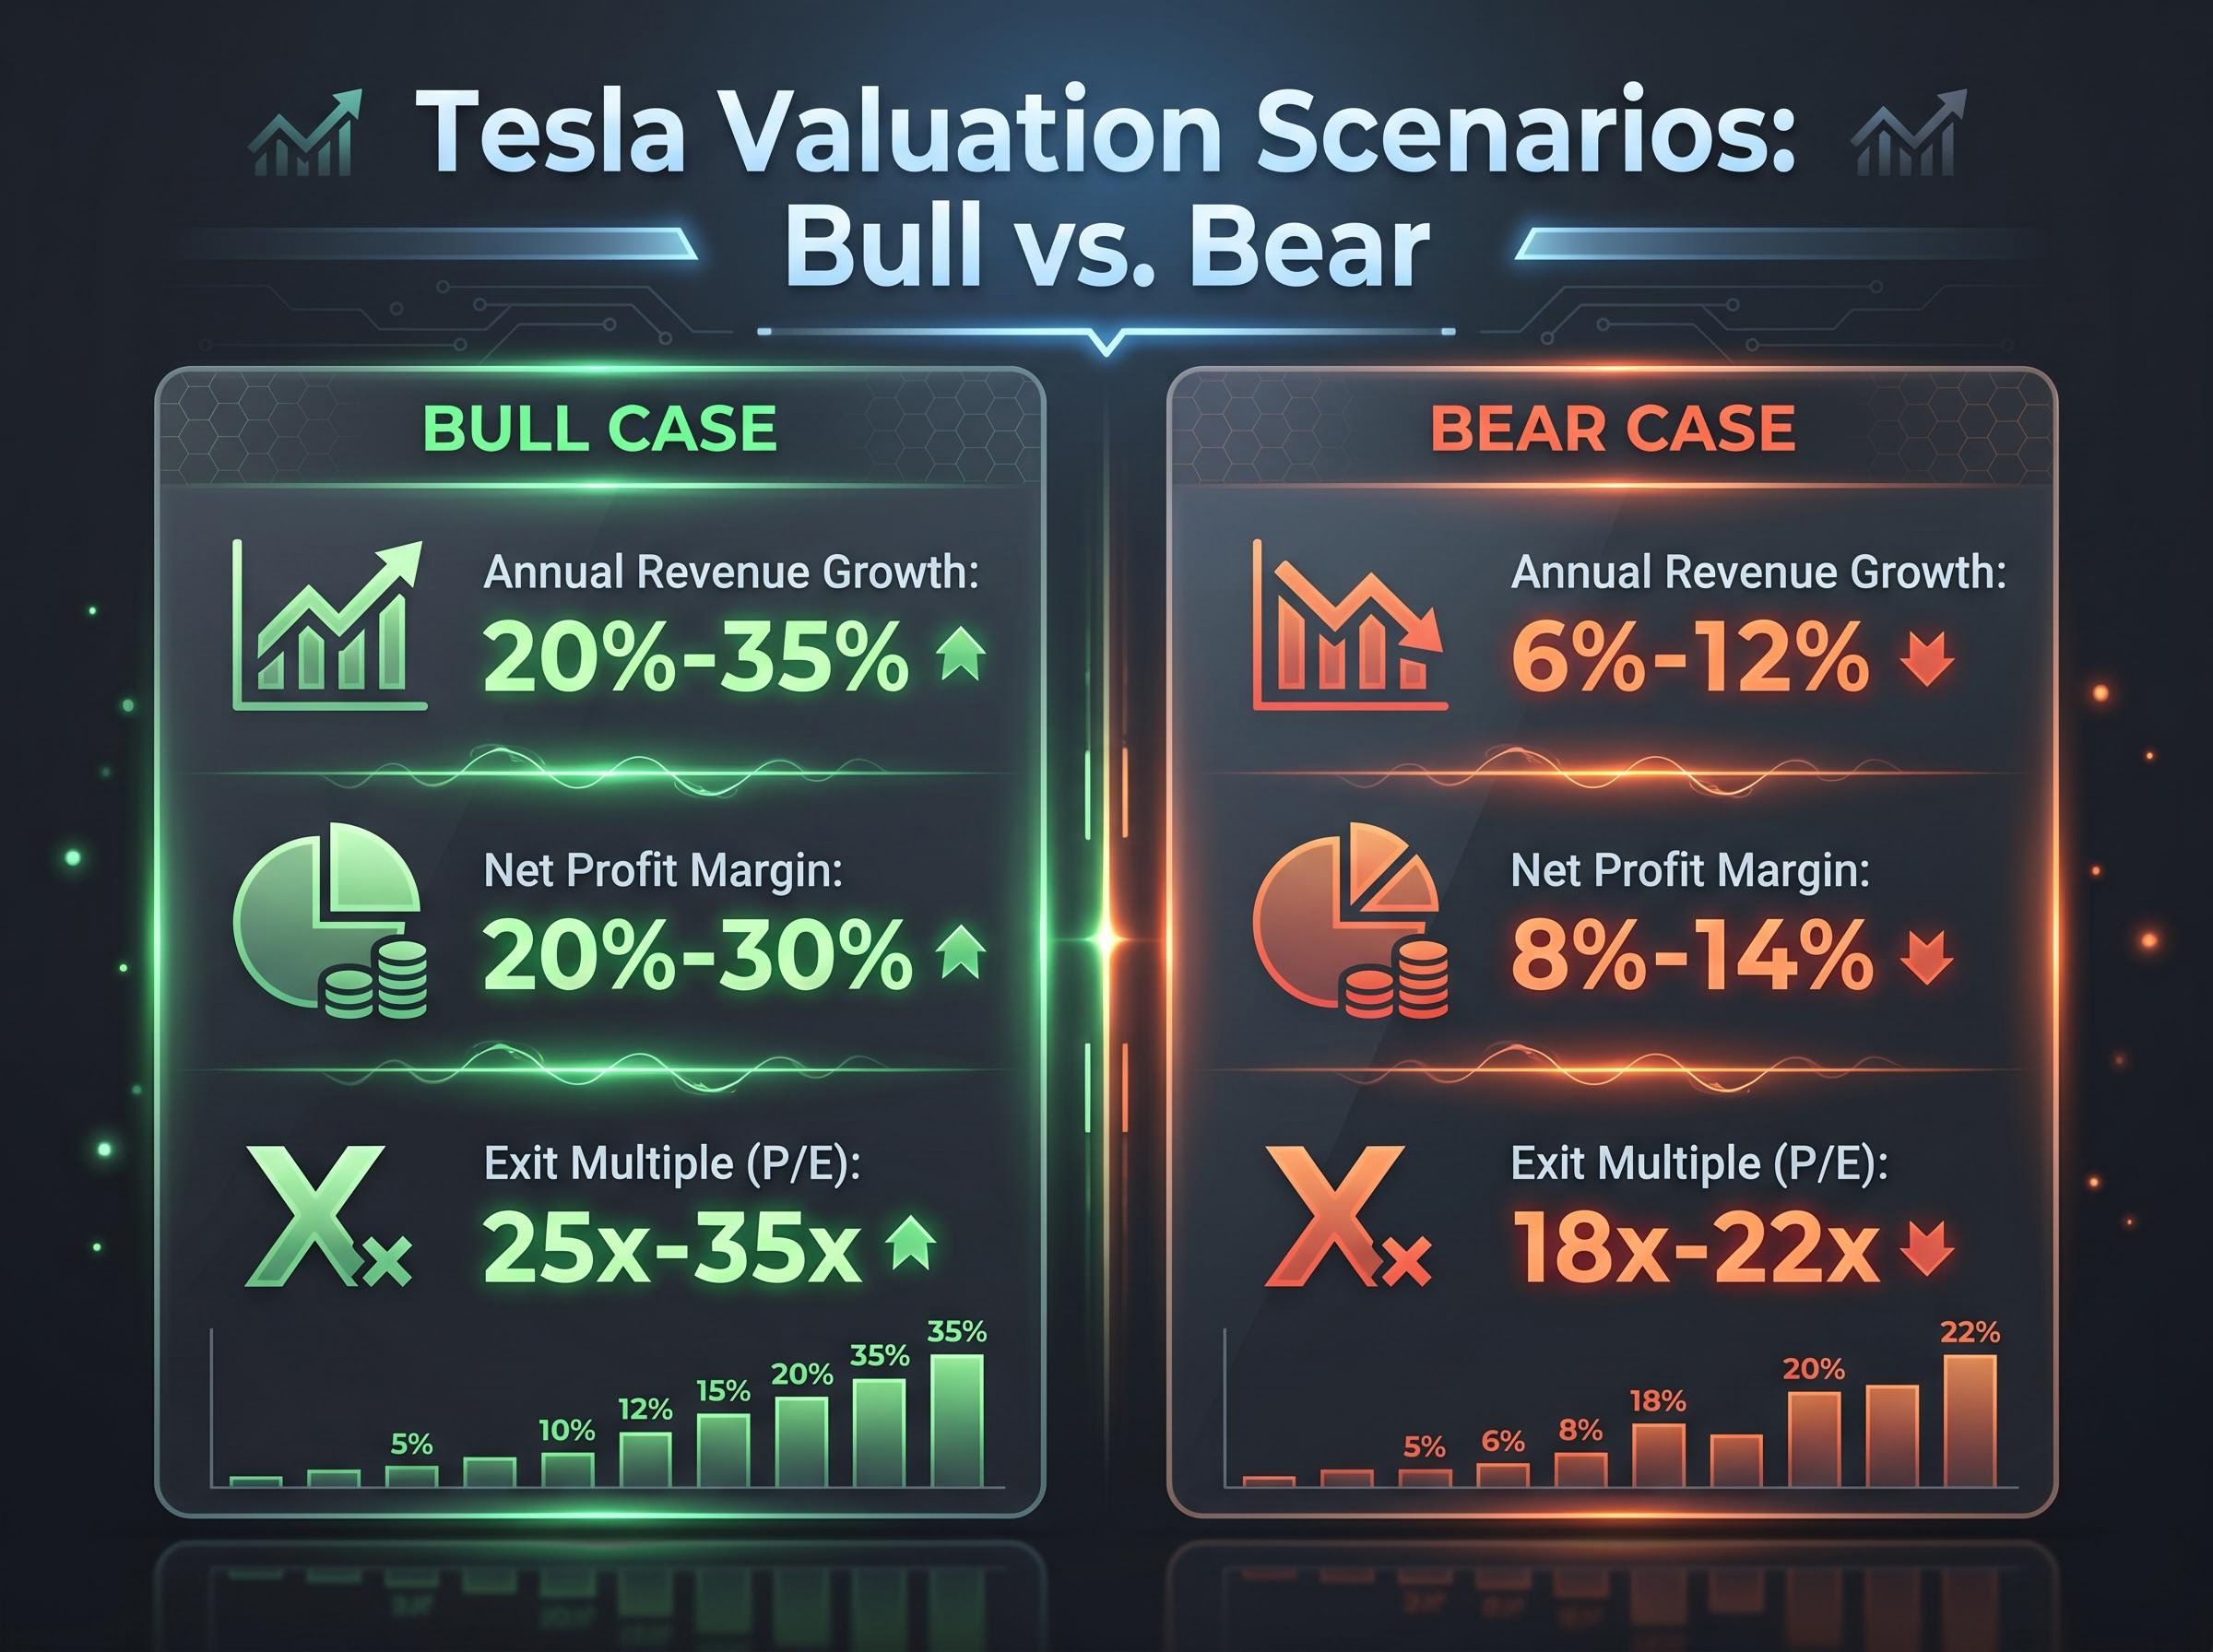
| Variable | Bull case | Bear case |
|---|---|---|
| Revenue growth (annual) | 20%-35% | 6%-12% |
| Net profit margin | 20%-30% | 8%-14% |
| Exit multiple (P/E) | 25x-35x | 18x-22x |
This scaffold will be populated with real analyst data in the sections that follow. First, it is worth understanding why the three variables matter more in combination than in isolation.
Small differences in each variable magnify dramatically over a 10-year horizon. An investor who is modestly wrong on all three simultaneously, say 5% below on growth, 3% below on margin, and 5x lower on exit multiple, can see a projected return swing from strongly positive to negative. The compounding effect means errors do not cancel out; they multiply.
The exit multiple deserves particular attention. It is often the most underappreciated variable because it depends not just on the company’s execution but on how the broader market values that category of business at the point of exit. A company can deliver on every operational milestone and still trade at a lower multiple than expected if market sentiment toward its sector has shifted.
The bull case for Tesla is not a feeling about the stock. It is a set of conditional requirements, each of which must hold for the scenario’s return projections to materialise. Mapped against the three scenario variables, the bull case assumes: annual revenue growth of roughly 20% to 35%, net profit margins expanding to 20% to 30%, and exit multiples of 25x to 35x earnings.
What would the real world need to look like for those numbers to be credible? The milestones form a logical chain:
ARK Invest’s Cathie Wood has set a bull case price target of $2,600 per share by 2029, with roughly 90% of the value attributed to Robotaxi and Optimus. This represents the outer boundary of the bull case.
Wedbush’s Dan Ives carries a price target of $600 with an Outperform rating, framing Tesla’s capex as an “AI moat builder.” Morgan Stanley’s Adam Jonas holds a target of approximately $410, with the thesis centred on accelerated Robotaxi rollout in Dallas and Houston as validation of the AI strategy.
Some analysts assign the full bull case a probability of roughly 5% to 10%. The return range it implies, approximately 11% to 35% annualised over a decade, explains why even a small position sized to the bull scenario can be mathematically defensible. The question is whether each link in the chain holds.
The bear case does not require Tesla to fail. It requires something more mundane: that the company remains a strong electric vehicle manufacturer with above-average auto margins, but that autonomous driving and robotics do not contribute meaningful revenue within the valuation horizon.
Under those assumptions, the three scenario variables compress substantially: revenue growth of 6% to 12% annually, net margins of 8% to 14%, and exit multiples of 18x to 22x. At the current share price, those inputs produce negative projected returns across the range.
Goldman Sachs’ Mark Delaney carries a price target of $375 with a Neutral rating, flagging negative free cash flow and EV margin pressure as core concerns. His 2026 EPS estimate has been revised down to $1.60. At the other end, GLJ Research’s Gordon Johnson holds a target of approximately $25, characterising roughly 95% of the current valuation as tied to unproven technology.
The specific mechanisms driving the bear case deserve clear enumeration:
Tesla’s more than $25 billion annual capex programme exists within a broader AI infrastructure spending cycle that has pushed combined hyperscaler commitments into the $600-$805 billion range for 2026, a macro context that both validates the scale of investment being made across the autonomous systems landscape and raises questions about which companies in the cycle ultimately capture the returns.
Elon Musk’s historical pattern on timelines adds further context. In 2016, the company claimed hardware capable of full autonomy. In 2019, Musk projected one million Robotaxis by 2020. In 2021, Optimus was projected as deployment-ready by 2022. Each milestone ultimately arrived, or remains in progress, well after original schedules.
| Variable | Bull case | Bear case | Return direction |
|---|---|---|---|
| Revenue growth (annual) | 20%-35% | 6%-12% | Higher growth supports premium |
| Net profit margin | 20%-30% | 8%-14% | Wider margins amplify returns |
| Exit multiple (P/E) | 25x-35x | 18x-22x | Multiple compression erodes gains |
| Implied return at ~$428 | ~11%-35% annualised | Negative | Entry price is the determinant |
At approximately $375 per share, all projected return outcomes under the bear case were negative in the proprietary analysis referenced in available research. The question for investors is not whether the bear case is right or wrong; it is whether the data signals over the coming quarters confirm or refute the specific mechanisms listed above.
Being right about Tesla’s transformation is necessary but not sufficient for a good investment outcome. The return an investor earns depends heavily on the price paid to enter the position.
Consider the asymmetry: an investor who bought Tesla near $100 a few years ago can tolerate a partial-execution outcome, one where Robotaxi scales more slowly than planned and Optimus is delayed, and still earn a strong return. An investor buying near $428 today needs a much higher proportion of the bull case to materialise just to break even.
The bull case annualised return range of approximately 11% to 35% over 10 years is the reward ceiling at current prices, not the floor. Forward analyst EPS estimates project more than 5x growth from current levels, but that optimistic earnings path requires time and sustained execution before it validates today’s multiple.
One complementary technique for testing whether a current share price is reasonable is to work backward from the price to the implied earnings growth rate it demands, which translates a qualitative bull-or-bear view into a specific number that can be compared against the company’s historical growth and analyst projections.
The 43-analyst coverage split (28 Buy, 10 Hold, 5 Sell as of 8 May 2026) reinforces that the market has not resolved this debate. The distribution of views is genuinely wide, which is itself a signal about how much uncertainty the current price embeds.
A practical framework for evaluating entry price on any transformation story follows three steps:
Margin of safety is a concept borrowed from value investing but equally applicable to growth stories. It means paying below estimated intrinsic value so that execution slippage, delays, or a less favourable exit multiple do not destroy returns.
At $428, applying the three-step framework requires an honest assessment. If an investor assigns roughly 10% probability to the full bull case, 60% to a partial-execution base case, and 30% to the bear case, the probability-weighted value may sit below the current share price. That does not make Tesla uninvestable; it clarifies that the position size, holding period, and tolerance for drawdowns must reflect the premium being paid.
This is not a buy or sell recommendation. It is a demonstration of how to structure the thinking, applicable to any company whose share price has moved ahead of its operational proof points.
This article is for informational purposes only and should not be considered financial advice. Investors should conduct their own research and consult with financial professionals before making investment decisions. Past performance does not guarantee future results. Financial projections are subject to market conditions and various risk factors.
The Tesla case study illustrates three methodological lessons that apply well beyond a single stock. Scenario construction forces specificity: it is easy to say “I’m bullish” and far harder to list the four milestones that must materialise for that conviction to produce a positive return at the current price. Entry price is a primary determinant of return, not a secondary consideration after the thesis is formed. And the probability assigned to each scenario is the most personal and most consequential judgment an investor makes.
Most transformation stories resolve somewhere between the extremes. The most likely outcome for Tesla, according to the range of analyst coverage, involves ongoing Robotaxi and Optimus progress combined with the core automotive business continuing in parallel. The 12 analyst upgrades versus 5 downgrades following Q1 2026 earnings indicate the current consensus leans bullish, but the distribution remains wide enough to accommodate meaningful bear-case outcomes.
Before buying any company priced for transformation, a practical closing discipline applies: list the three or four milestones that must materialise to justify the current price, assign honest probabilities, and revisit those milestones quarterly. For Tesla, the near-term checkpoints are concrete:
Probability weighting is only useful if it is updated as new data arrives, which is why milestone monitoring as a thesis signal matters more for transitional companies than tracking quarterly EPS against consensus: a single permitting decision or production ramp confirmation can shift the probability distribution across scenarios more than several quarters of incremental results.
The framework outlined in this article turns a single stock debate into a repeatable investment discipline. The next time a company’s share price is pricing in a future that has not yet arrived, the same three-variable scaffold, the same entry-price logic, and the same milestone checklist apply. The specific numbers change. The process does not.
These statements are speculative and subject to change based on market developments and company performance.
Scenario-based stock valuation analysis is a structured approach that tests multiple sets of assumptions (bull, base, and bear cases) across three core variables: revenue growth rate, net profit margin, and exit multiple, to calculate the range of potential investor returns rather than relying on a single point forecast.
Entry price is a primary determinant of return, not a secondary consideration. An investor who bought Tesla near $100 can tolerate slower-than-expected execution and still earn strong returns, while an investor buying near $428 needs a much higher proportion of the bull case to materialise just to break even.
The three core variables are revenue growth rate (how fast the top line expands annually), net profit margin (what proportion of revenue converts to profit as the business matures), and exit multiple (the valuation multiple the market is likely to assign when the investor exits the position).
Tesla's forward P/E sits at roughly 185x to 217x as of May 2026, far above legacy automakers such as Ford and GM, which trade at approximately 6x EV/Sales, reflecting the market pricing in a transformation premium tied to Robotaxi and Optimus rather than core automotive earnings.
Investors should identify three or four specific operational milestones that must materialise to justify the current share price, assign honest probabilities to each, and revisit them quarterly, since a single permitting decision or production ramp confirmation can shift the probability distribution across scenarios more than several quarters of incremental earnings results.


