
How to Value a Stock Using Tesla’s $2,500 Analyst Spread
13 mins ago

Tesla trades at roughly 217 times forward earnings as of early May 2026, a multiple that can only make sense if something transformational is about to happen. The question for any investor is not whether to believe the story, but what to pay for the chance that it comes true.
Tesla’s Q1 2026 results beat consensus estimates on revenue, earnings per share, and gross margin. Yet the stock simultaneously embeds enormous assumptions about autonomous driving, humanoid robotics, and software-like profit margins that have not yet materialised. This tension between present fundamentals and future optionality is not unique to Tesla; it is the defining challenge of valuing any company in transition.
What follows uses Tesla’s current valuation as a live teaching case. The guide walks through the specific analytical steps investors should take when a stock’s price reflects a future still being built: scenario construction, multiple selection, entry price sensitivity, and what the spread between outcomes reveals about embedded risk.
Most investors reach for the price-to-earnings ratio first. For a company mid-transformation, that instinct leads directly to a misleading number.
Tesla’s trailing P/E sits at approximately 393x based on trailing twelve-month earnings per share of roughly $1.09. Its forward P/E, which uses analyst consensus estimates for the next twelve months, is approximately 217x. The P/E ratio, calculated as price per share divided by EPS, represents what investors pay per dollar of earnings. The same company looks radically different depending on which lens is applied.
Tesla’s trailing P/E of approximately 393x versus its forward P/E of approximately 217x illustrates how future earnings expectations already compress the multiple significantly. Forward-looking metrics are the appropriate starting point for any company in an active investment phase.
The trailing figure is distorted because Tesla guided approximately $25 billion in full-year 2026 capital expenditure, spending that directly suppresses near-term free cash flow and earnings. Heavy investment in autonomous vehicle infrastructure, robotics manufacturing, and energy storage capacity means current earnings reflect a company paying for growth it has not yet captured.
Three specific limitations make trailing P/E unreliable for high-growth transitional companies:
Investors who apply the wrong tool to a transitional company will reach confident but incorrect conclusions. Understanding which metrics to use, and why, is the prerequisite skill before any scenario analysis can be built.
Sum-of-the-parts (SOTP) valuation addresses the blending problem directly. The method values each business segment independently, then aggregates them to derive total firm value. For Tesla, this means separately valuing four distinct businesses sitting inside one stock price: core automotive, energy generation and storage, Full Self-Driving (FSD) and robotaxi services, and Optimus robotics.
Each of those segments sits at a radically different maturity level. Core automotive generates verifiable revenue and margins. Energy storage is scaling rapidly. FSD has logged miles and expanded to new Texas cities but does not yet operate at commercial scale. Optimus remains in factory deployment with low-volume production projected for summer 2026. A single blended valuation treats these as one business. SOTP treats them as four separate bets.
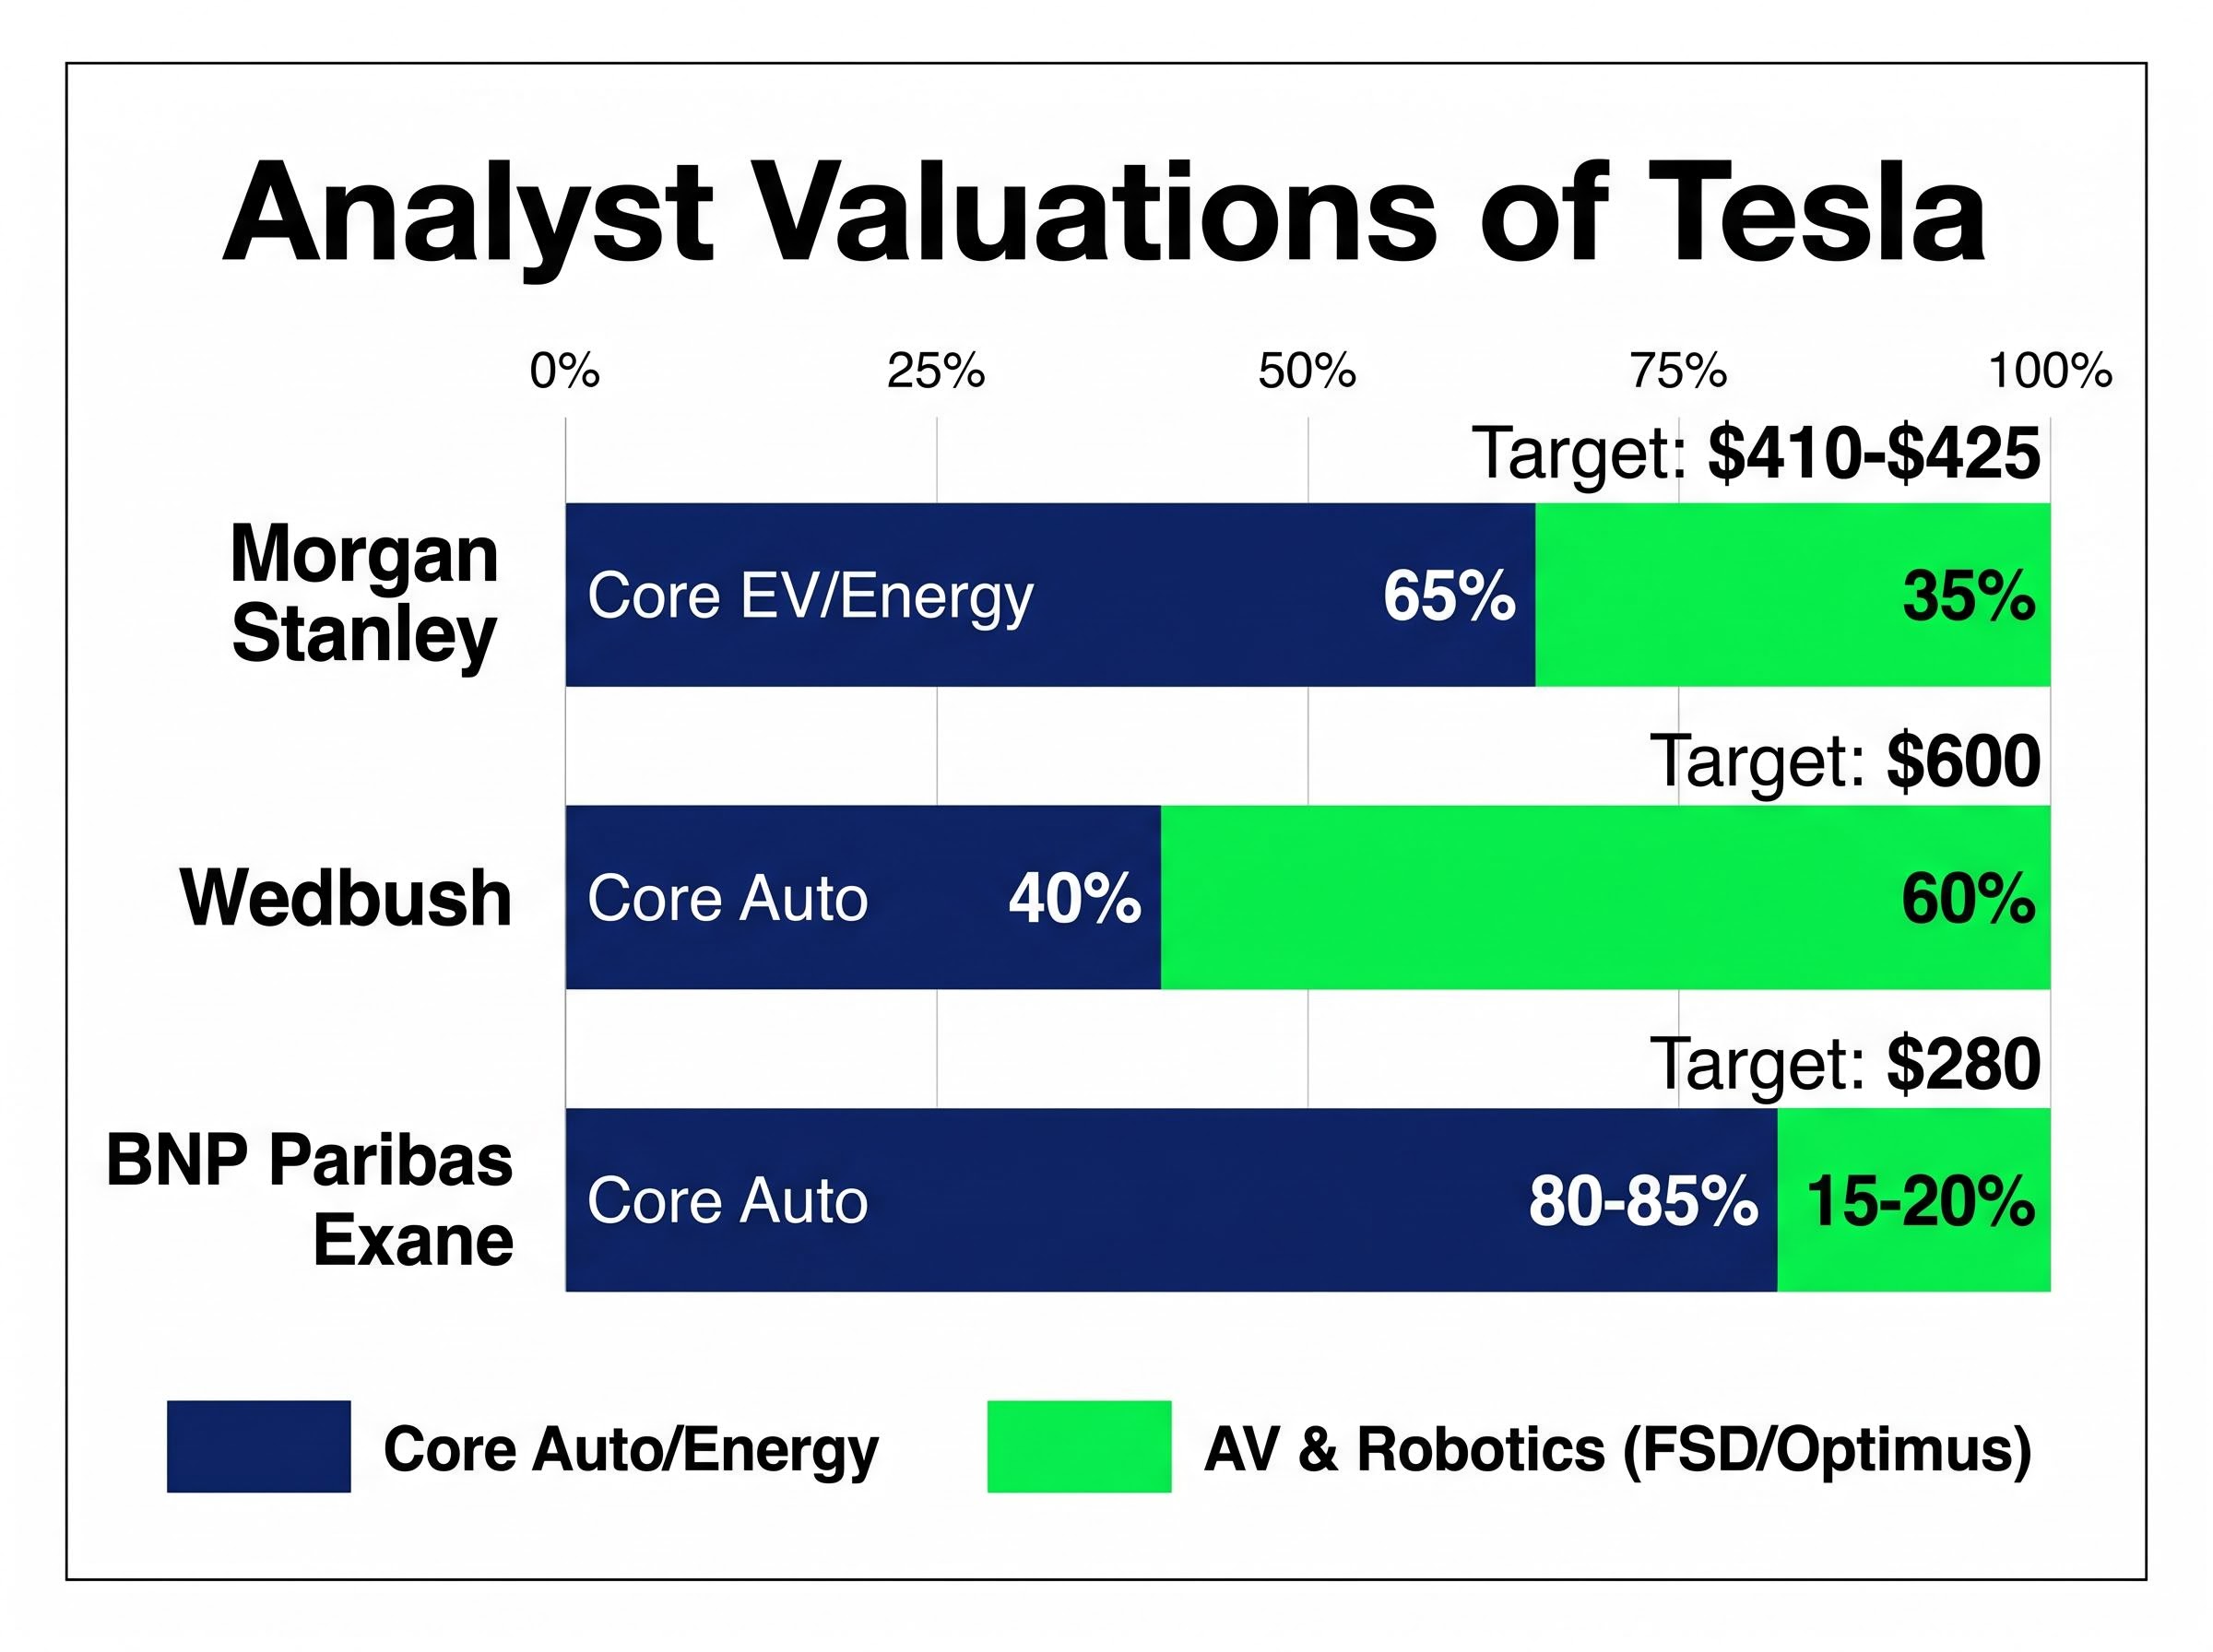
The analyst community reflects this structural disagreement precisely:
| Analyst | Core Auto Weight / Multiple | AV and Robotics Weight | Implied Fair Value | Price Target |
|---|---|---|---|---|
| Morgan Stanley | 65% (core EV and energy, ~22% margins) | 35% (25% FSD, 10% robotics) | ~$400 | $410-$425 range |
| Wedbush (Dan Ives) | ~40% (~20x P/E) | 60%+ (40% FSD, ~20% Optimus) | $500-$600+ | $600 |
| BNP Paribas Exane | 80-85% (12-15x P/E, ~18% margins) | 15-20% | $200-$250 | $280 |
The spread between Wedbush’s $600 target and BNP Paribas’s $280 target is not a disagreement about Tesla’s cars. It is a disagreement about how much value to assign to businesses that do not yet generate verifiable revenue at scale.
Optimus and robotaxi valuations in any analyst model are probability-weighted estimates, not appraisals of existing cash flow. Wedbush assigns 40%+ of Tesla’s value to FSD and robotaxi services, projecting $100 billion+ in revenue by 2030 at approximately 80% gross margins. That projection rests on regulatory approvals, consumer adoption rates, and competitive dynamics that remain unresolved.
A Wall Street Journal op-ed published 6 May 2026 recommended anchoring SOTP analysis to verifiable segments first, then treating speculative segments as options with explicit probability assignments rather than firm valuations. Until FSD achieves clear regulatory wins and Optimus generates commercial revenue, the speculative segments function as call options embedded in the stock price, not established businesses.
Discounted cash flow (DCF) analysis, which estimates the present value of a company’s expected future cash flows, becomes most useful when built across multiple scenarios rather than a single projection. Three-scenario DCF forces investors to state assumptions precisely rather than letting narrative carry the number.
Tesla’s Q1 2026 results provide the anchoring data. Revenue reached $22.4 billion (+16% year on year), gross margin came in at 21.7% versus 17% consensus, and adjusted EPS of approximately $0.40 beat the $0.35 estimate. These figures improve the base case but leave the question of future trajectory wide open.
Each scenario is defined by three inputs: revenue growth, net profit margins, and the valuation multiple applied to resulting earnings.
| Scenario | Revenue Growth | Net Margin | Multiple | Projected 10-Year Return |
|---|---|---|---|---|
| Bear | 6-12% (midpoint ~9%) | 8-14% | 18-22x | Negative at ~$375-$428 entry |
| Base | ~15% core auto, ~20% FSD probability | Moderate expansion | FCF range $10-$15B (2026) | Modest positive |
| Bull | 20-35% (midpoint ~27%) | 20-30% | 25-35x | ~11-35% annualised |
Under bear case assumptions, all projected 10-year return outcomes are negative at an entry price of approximately $375-$428. This finding directly illustrates the premium embedded in Tesla’s current share price; the margin of safety against the downside scenario has been fully consumed.
The standard probability weighting framework, as described by Professor Aswath Damodaran’s general valuation methodology, assigns 50% to the base case, 30% to the bull case, and 20% to the bear case. Applying these weights produces a probability-weighted average that is more defensible than any single-point estimate.
Probability calibration, the process of assigning defensible percentage weights to each scenario rather than leaving them implicit, is where most investor analysis breaks down: shifting a robotaxi scenario from a 30% to a 10% probability weight moves the blended fair value estimate by more than adjusting the revenue growth assumption within that scenario.
The bull case projects annualised returns of 11-35% but carries an estimated 5-10% probability of full materialisation. Morgan Stanley uses Monte Carlo simulations (running thousands of iterations across variables like CapEx, gross margins, and FSD adoption rates) to produce a 2026 free cash flow range of $10-$15 billion for the base case. The width of that range, even within a single scenario, underscores how sensitive the output is to assumption inputs.
Most valuation exercises start with fundamentals and project forward to a price. Reverse DCF inverts the process: it takes the current market price as given and back-solves for the implied revenue growth rate required to justify that price.
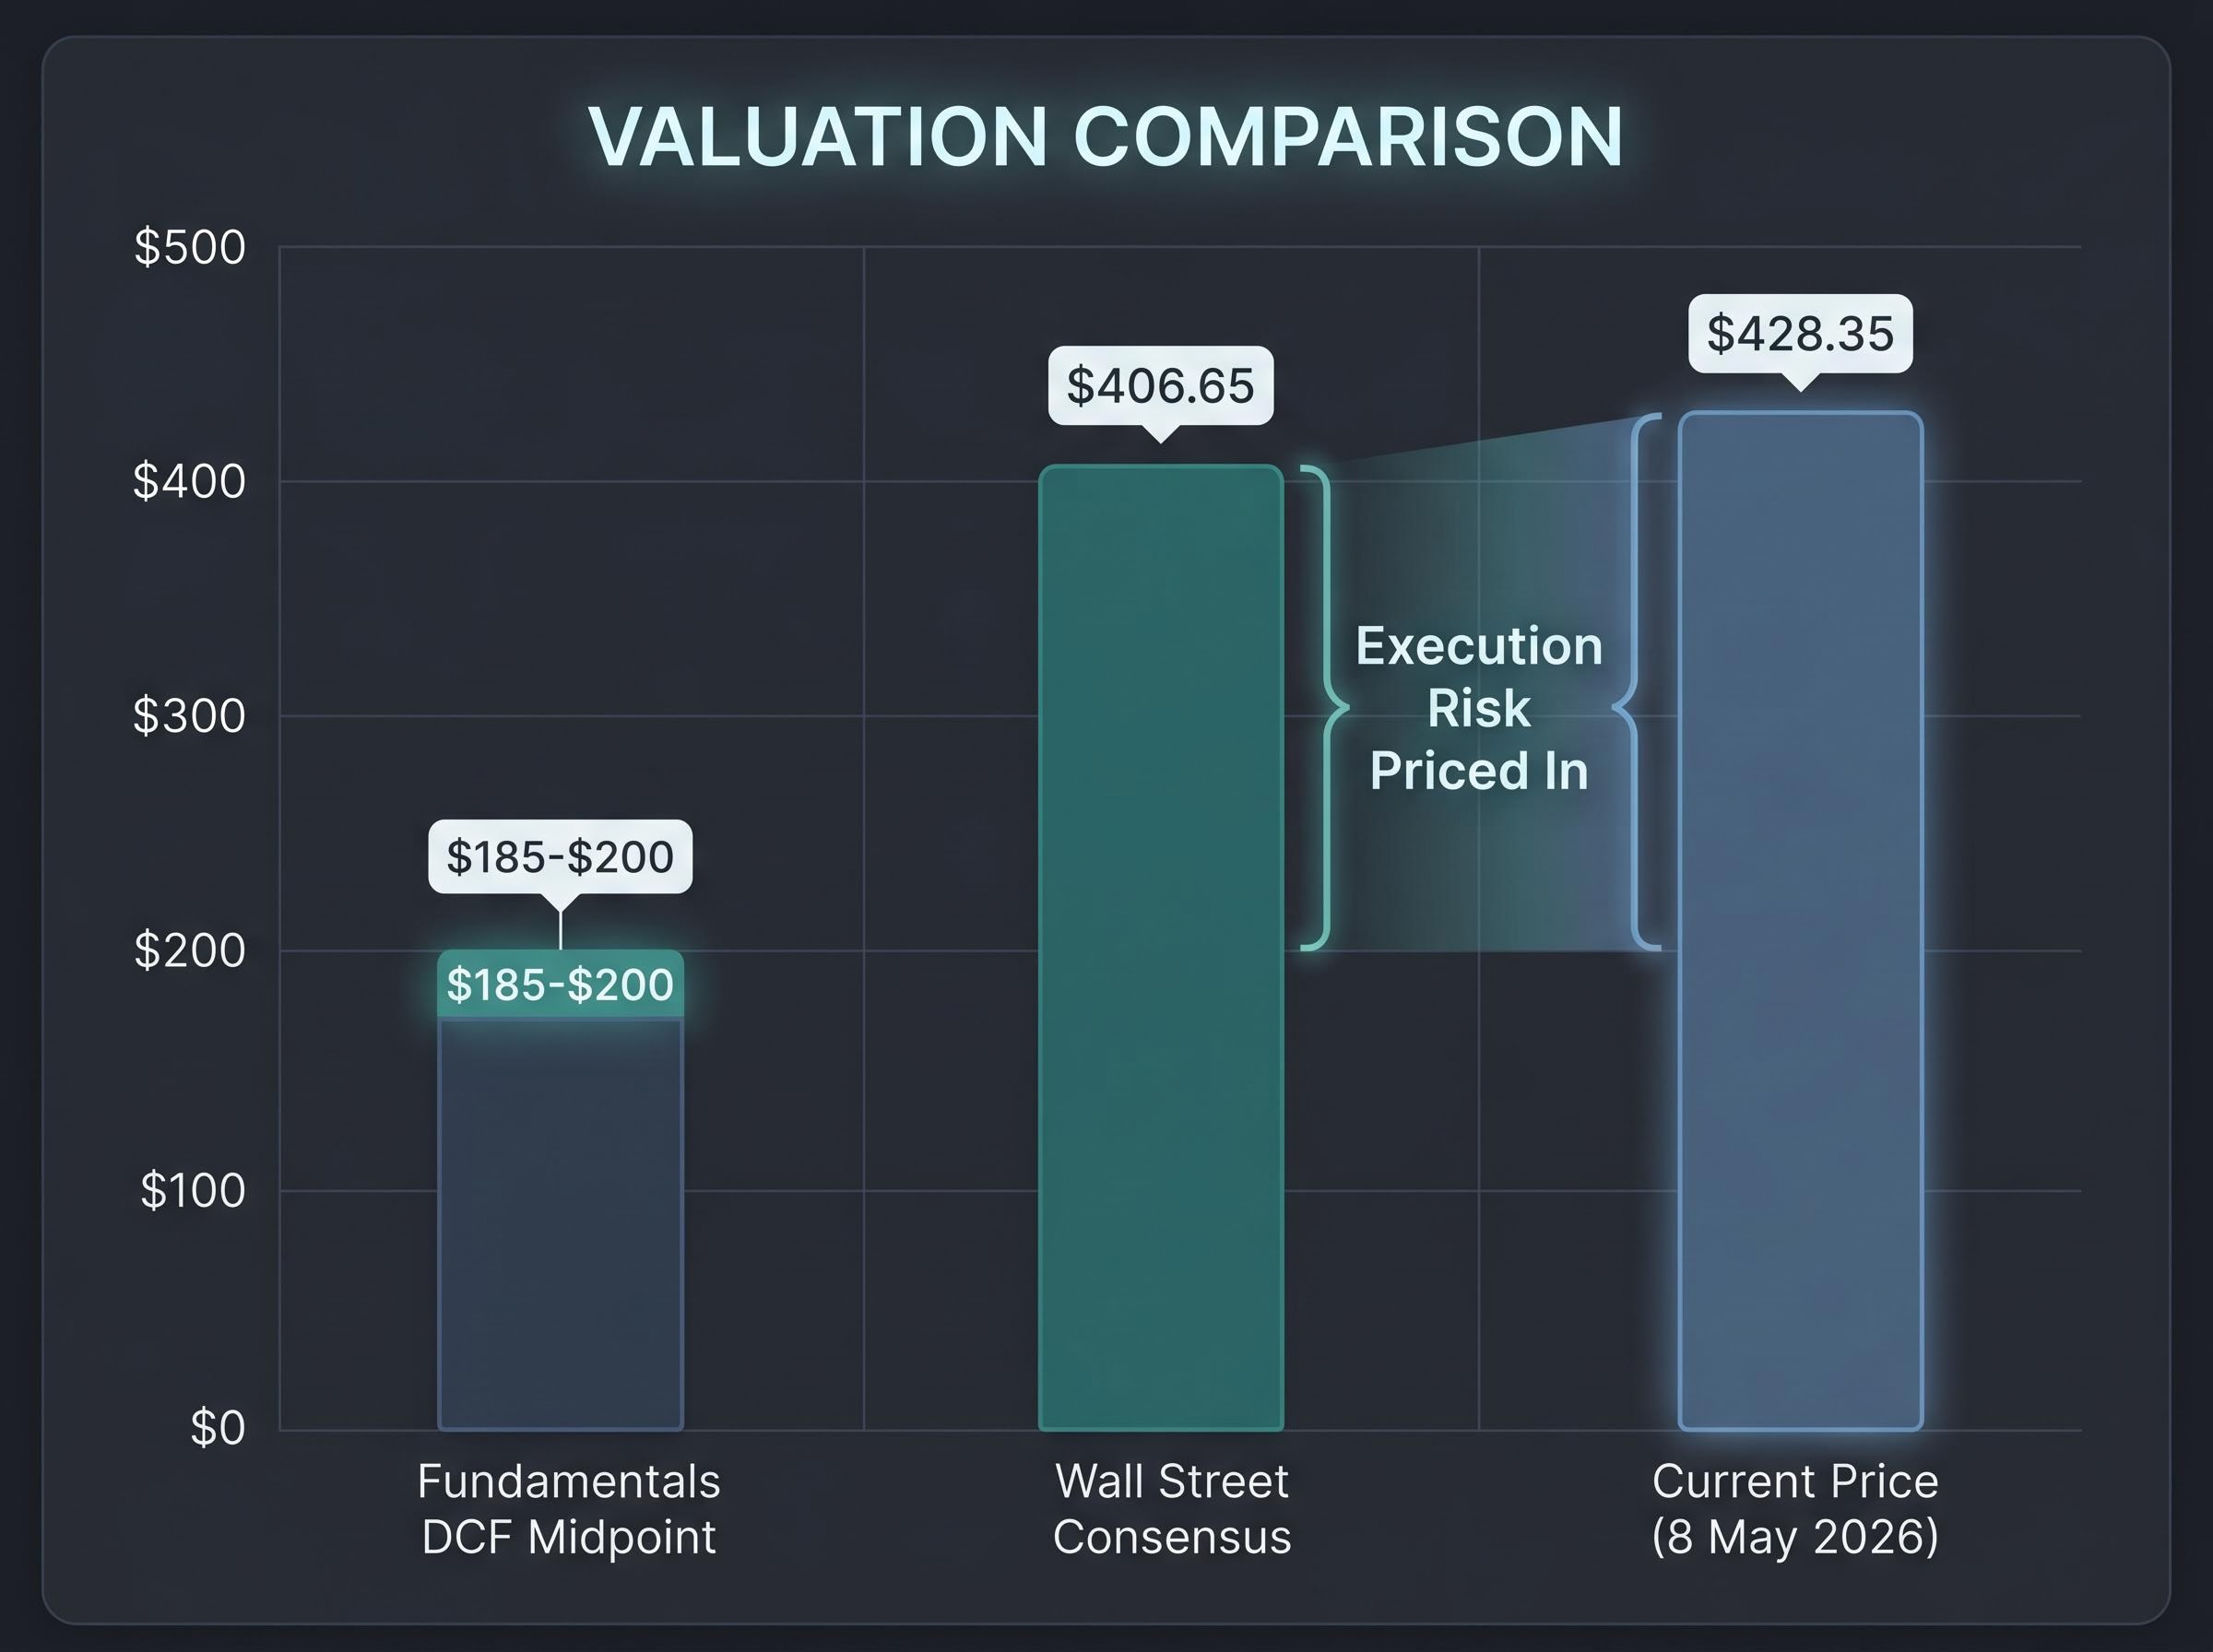
For Tesla at $428.35 (as of 8 May 2026), this reframes the question entirely. Instead of asking whether Tesla is worth buying, the investor asks: what does Tesla have to achieve to be worth what the market is charging today?
The four-step reverse DCF process works as follows:
Wall Street consensus sits at approximately $406.65, with Wedbush at $600 and BNP Paribas at $280. Fundamentals-based DCF tools point to a midpoint range of approximately $185-$200, though these figures should be treated as directional rather than precise. The gap between that range and the current price quantifies exactly how much execution on future business lines the market has already priced in.
Elon Musk’s timeline record is a documented variable in this calculation, not an anecdote. Musk projected one million robotaxis by end of 2020 (stated 2019, not achieved). Optimus was described as deployment-ready by 2022 (stated 2021, not achieved). Full autonomy hardware was claimed present in all vehicles in 2016. The robotaxi public launch has been rescheduled to October 2026. Each delayed milestone extends the timeline over which the implied growth rate must compound.
Waymo provides a competitive benchmark for the market Tesla is targeting. Waymo surpassed 500,000 paid rides per week in Q1 2026 across San Francisco, Phoenix, and Los Angeles, and carries a $126 billion valuation. That figure demonstrates the scale that autonomous mobility can command, but also sets a high execution bar for Tesla’s entry into the commercial robotaxi market.
Waymo’s 500,000 weekly paid rides milestone across San Francisco, Phoenix, and Los Angeles in Q1 2026 establishes a concrete commercial benchmark against which Tesla’s robotaxi entry timeline and projected revenue scale can be evaluated.
An investor who purchased Tesla shares at approximately $100 in prior years and an investor buying at $428 today are not making the same investment, even though they own the same company. The difference in future returns across every scenario is almost entirely explained by that single variable.
Under the bear case assumptions outlined above, all projected 10-year outcomes are negative at an entry price of approximately $375-$428. The identical bear case, applied to a $100 entry, would still produce positive returns. The underlying company performance is the same in both calculations. Only the price paid changes.
This sensitivity compounds at the bull end as well. Analyst estimates project EPS growing more than 5x from current levels, incorporating expected contributions from autonomy and FSD. Yet Tesla analyst EPS estimates declined more than 90% from their peak before recovering in forward projections, illustrating how volatile the earnings base underlying any entry price calculation can be.
Three practical entry-price discipline principles follow from this analysis:
Investors considering the staged entry approach recommended above will find our full explainer on staged entry strategies covers the empirical return data comparing lump sum deployment against phased accumulation, including the 68-73% of historical periods where lump sum has outperformed and the specific market conditions where staged entry closes that gap.
Wider scenario spreads, meaning the distance between bull and bear projected returns, directly imply smaller position sizes as prudent risk management. For Tesla specifically, the bear case producing negative returns at current prices is the clearest quantitative argument for limiting exposure, regardless of conviction on the bull case.
An investor who believes strongly in the FSD bull case but sizes the position at 5% of the portfolio acknowledges both the upside potential and the entry price risk. An investor who sizes at 25% is making a concentrated bet that the bull case materialises within their time horizon, at a price that already embeds significant optimism.
Tesla served as the case study, but the analytical sequence demonstrated here applies to any company whose stock price reflects a future still being built. The five steps form a transferable toolkit:
The methodology is most valuable precisely when a company’s story is most compelling, because narrative pull is when investors are most likely to skip the structural steps.
Four observable risk variables most frequently break transition-stage bull cases: regulatory delay on autonomous vehicle approvals, execution risk on capital-intensive manufacturing programmes, multiple compression as growth rates normalise, and management timeline slippage of the kind Tesla’s own history documents.
The gap between Tesla’s fundamentals-only valuation (approximately $185-$200 on DCF-based approaches) and its current market price of $428.35 is not evidence the market is irrational. It is a precise measure of how much execution risk investors are accepting, whether they have quantified it or not. The Wall Street analyst consensus of approximately $406.65 versus DCF tool midpoints of $185-$200 is the clearest illustration of this methodology-driven divergence.
Tesla’s Q1 2026 beats (revenue $22.4 billion, gross margin 21.7%, EPS $0.40) improve the base case but do not close the gap to the current price on fundamentals alone. Investors who work through this sequence for any company in transition will understand what they are actually buying: not a business at its current value, but a weighted probability bet on which future the company will inhabit, at a price that already reflects some version of the optimistic scenario.
This article is for informational purposes only and should not be considered financial advice. Investors should conduct their own research and consult with financial professionals before making investment decisions. Past performance does not guarantee future results. Financial projections are subject to market conditions and various risk factors.
Sum-of-the-parts (SOTP) valuation assigns separate values to each distinct business segment within a company, then aggregates them to derive total firm value. It matters because blending mature and speculative segments into a single metric obscures the fundamentally different risk profiles and appropriate multiples each segment deserves.
Reverse DCF takes the current market price as given and back-solves for the implied revenue growth rate the company must achieve to justify that price. Investors use it to quantify exactly how much future execution is already embedded in a stock's valuation, rather than projecting forward from fundamentals.
Trailing P/E ignores growth potential, is distorted by investment-phase earnings suppression where heavy CapEx reduces near-term profitability, and blends incommensurable business segments into a single number. Forward P/E, which uses analyst consensus estimates for the next twelve months, is a more appropriate starting point for companies in an active investment phase.
Investors should build three explicit scenarios (bear, base, and bull) with defined revenue growth, net margin, and valuation multiple assumptions, then assign probability weights to each. A common framework assigns 50% to the base case, 30% to the bull case, and 20% to the bear case, producing a probability-weighted fair value more defensible than any single-point estimate.
Entry price is the single variable most responsible for the difference in future returns across every scenario, because a bear case that produces deeply negative returns at a high entry price can still generate positive returns at a much lower entry price even with identical underlying company performance. Running the bear case return calculation at the actual intended entry price before buying is a critical step in quantifying downside risk.


