
Why AI Is Splitting Semiconductor Stocks From the Rest of Tech
2 hrs ago

Five U.S. companies now control roughly 30% of the entire American equity market, a concentration level that surpasses every prior reading in recorded history, including the peaks of the 1960s conglomerate era and the late-1990s dot-com boom. That finding, published by Wolfe Research analyst Chris Senyek in a client note on 8 May 2026, lands on a day when the S&P 500 is trading near 7,230, well above its March low of 6,343, and when the dominant market narrative is a powerful AI-driven recovery. That recovery, it turns out, is the story behind the story: the rebound from the March lows has been disproportionately led by AI-exposed mega-caps, widening the concentration gap rather than closing it. What follows is an examination of what the data actually shows, why it matters more than previous concentration warnings, what it means specifically for the millions of Americans who hold passive S&P 500 index funds, and what conditions might change the picture.
The five companies at the centre of the concentration are familiar names: Microsoft, Nvidia, Apple, Amazon, and Alphabet. Together, according to Wolfe Research, they account for approximately 30% of total U.S. equity market capitalisation as of 8 May 2026. Expand the lens to the top 25 companies and the figure rises to roughly 53%.
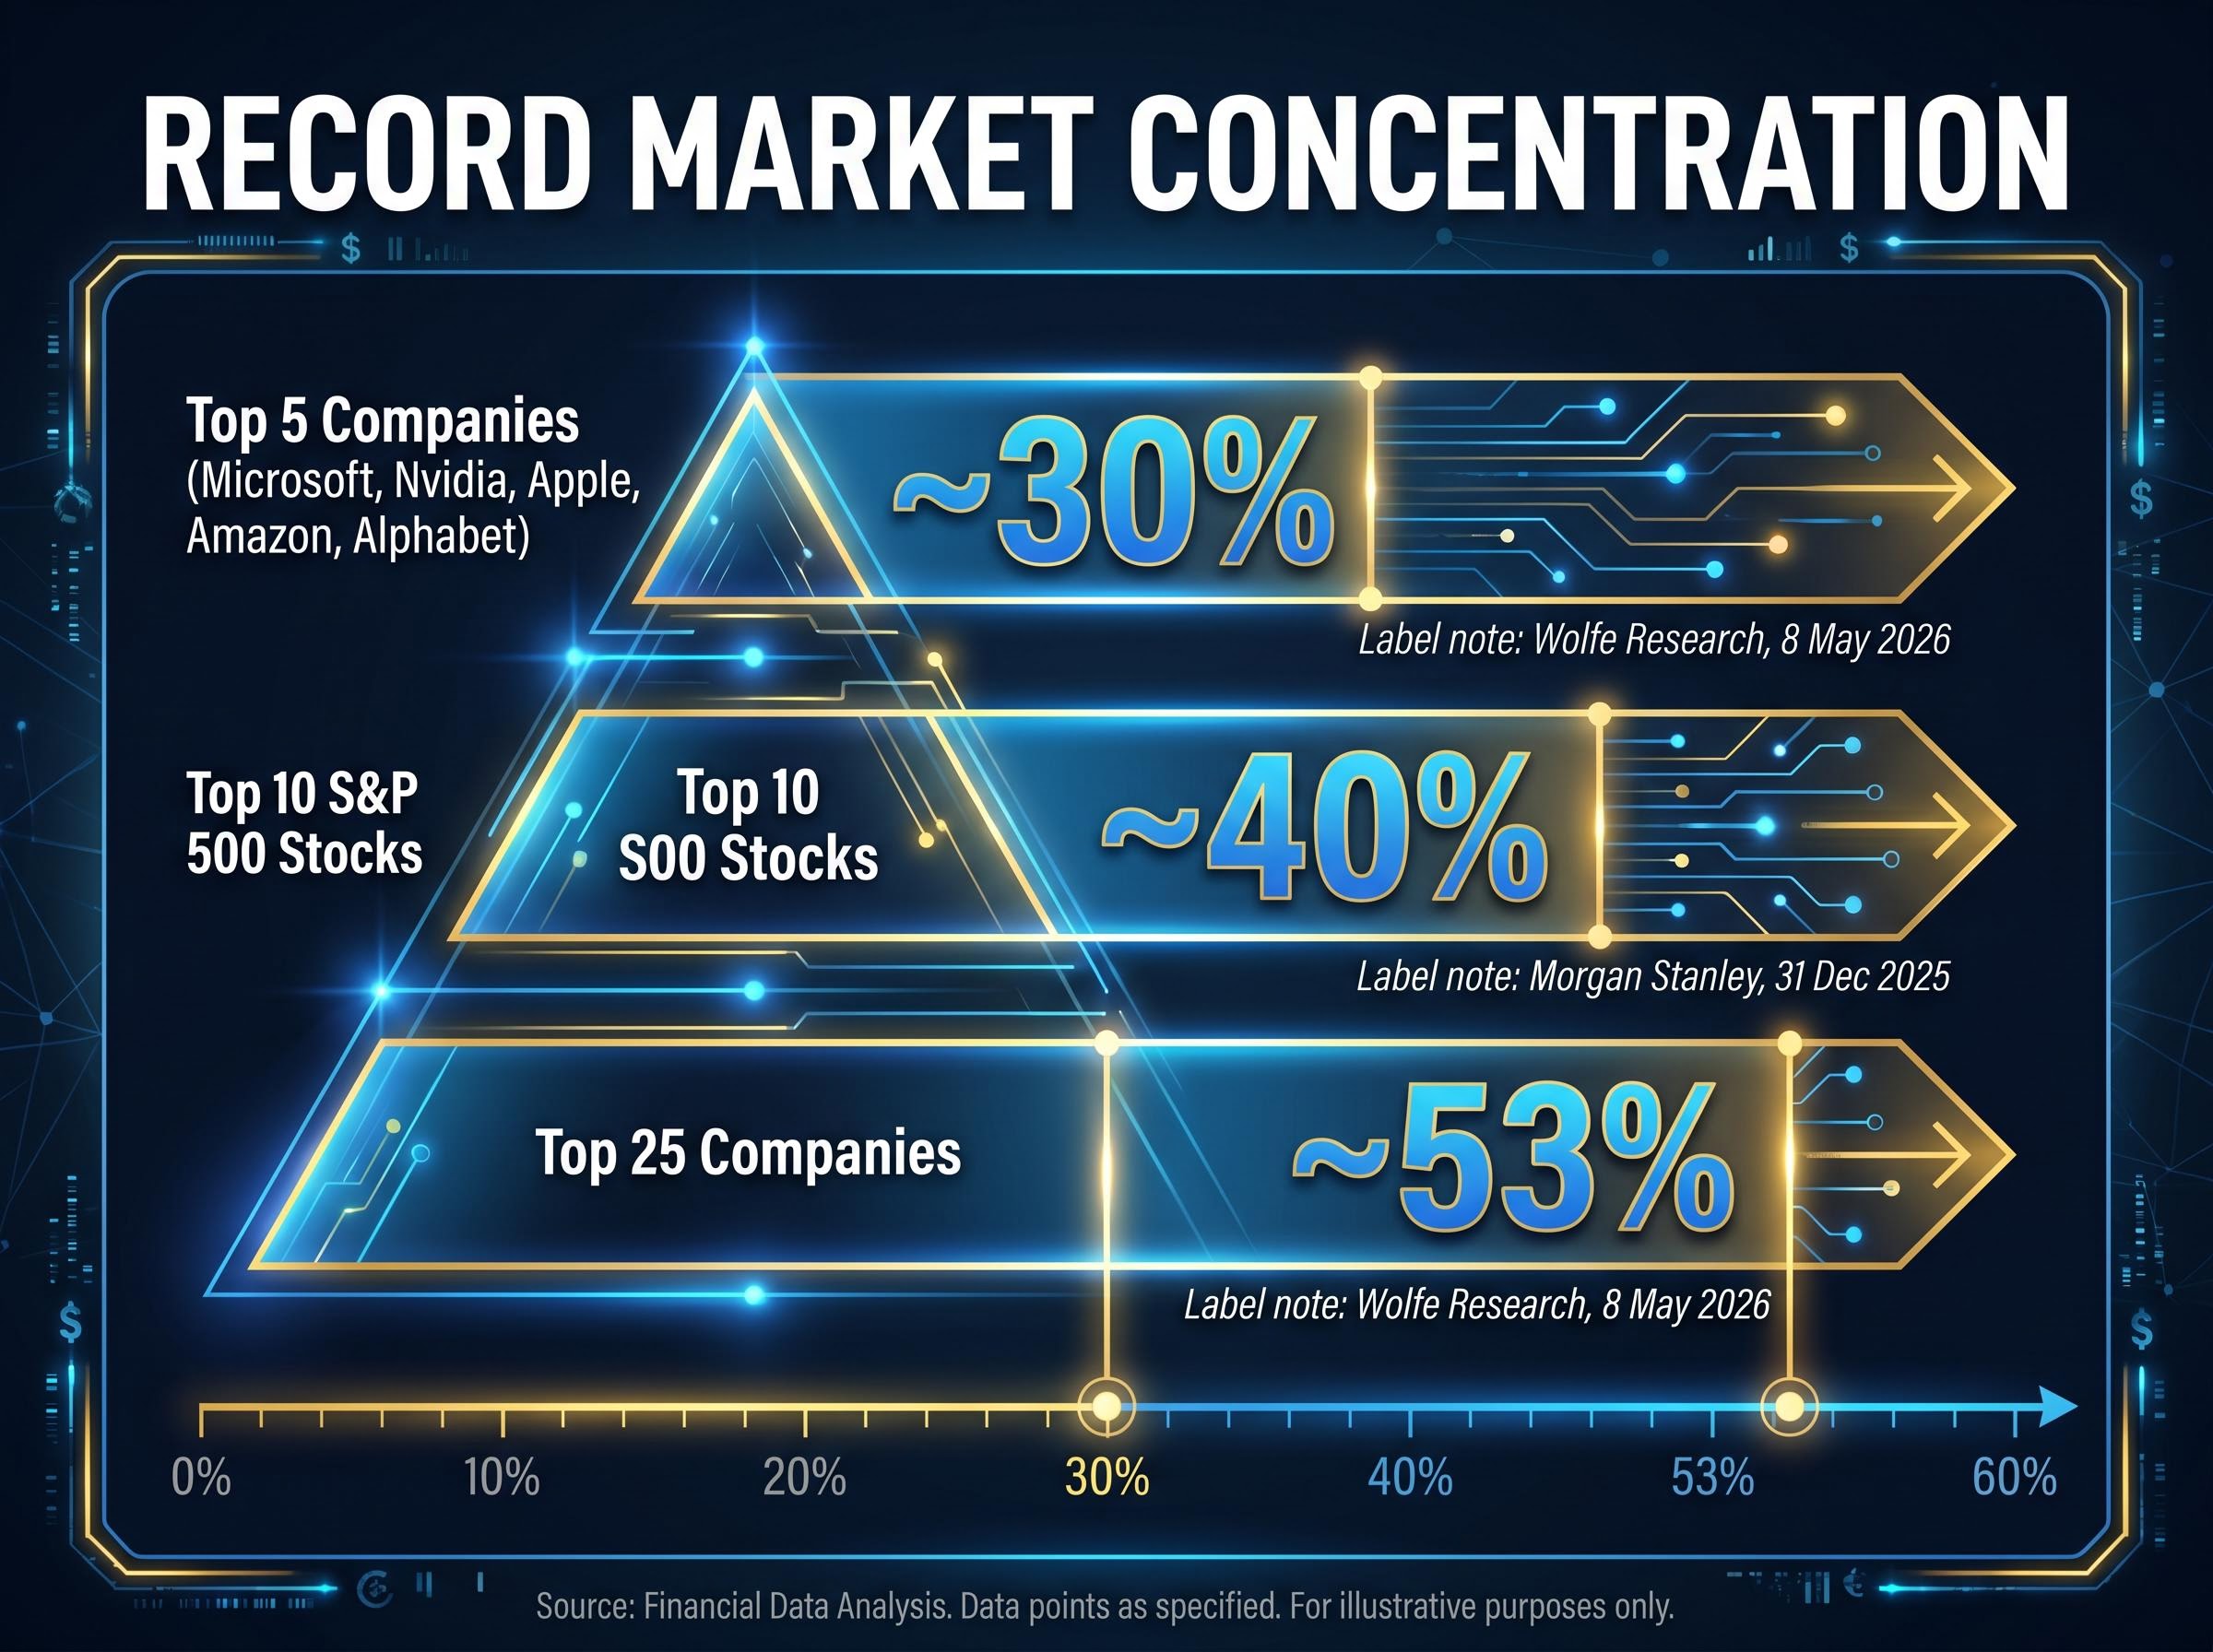
These are not high readings within a normal range. They are all-time highs that exceed every prior benchmark in the available dataset. Senyek published the findings in a client note on 8 May, characterising AI-linked names as having returned to a position of structural market dominance.
Wolfe Research’s Chris Senyek described AI-linked equities as having returned to a position of outright market dominance, with concentration levels surpassing every historical precedent in the firm’s dataset.
Separate institutional data reinforces the picture. Morgan Stanley reported the top 10 S&P 500 stocks at approximately 40% of index weight as of 31 December 2025. Goldman Sachs described market breadth as the narrowest “not seen since the dot-com era.”
| Cohort | Share of Total Market | Source | Date |
|---|---|---|---|
| Top 5 companies | ~30% | Wolfe Research | 8 May 2026 |
| Top 25 companies | ~53% | Wolfe Research | 8 May 2026 |
| Top 10 S&P 500 stocks | ~40% of S&P 500 | Morgan Stanley | 31 Dec 2025 |
Most readers would expect the dot-com era to hold the record. It does not. Goldman Sachs identified current breadth as the narrowest since that period, but Wolfe Research pushed the comparison further back, finding that today’s readings exceed even the elevated concentration observed during the 1960s.
Market breadth readings from April 2026 add a sharper edge to the concentration story: just 23% of S&P 500 constituents outperformed the benchmark in a month when the index itself posted a 98th-percentile return, the fourth-lowest breadth figure in nearly four decades of data.
That matters because the 1960s represented a structurally different economy. Conglomerate empires drove concentration then, as industrial giants rolled up diverse businesses under single corporate umbrellas. The late 1990s produced a different mechanism: speculative capital flooded into technology names whose revenue models had not yet been proven at scale.
The current episode combines elements of both, but with a distinction. AI mega-caps are generating real earnings at a pace that justifies investor attention, even as the scale of their dominance narrows the index to an extent that has no modern playbook.
Prior concentration peaks, in context:
The S&P 500’s recovery from 6,343 in March to approximately 7,230 by early May added roughly 14%, with mega-cap technology names accounting for a disproportionate share of that gain. Morgan Stanley frames the top-10 weight at ~40% as an extreme relative to recent decades.
A potential U.S.-Iran resolution would provide genuine relief. Wolfe Research acknowledges the transmission channels: lower energy prices (with WTI crude currently in the $99-$106 per barrel range) and falling bond yields would temporarily benefit underperforming sectors. Breadth would widen.
The firm does not expect it to last. Senyek’s assessment is that any geopolitically driven broadening would prove brief rather than structural.
Wolfe Research expects AI-linked equities to reassert structural market dominance even following any geopolitical resolution, as their earnings growth trajectory and relative valuations remain more compelling than the sectors that would benefit from easing.
J.P. Morgan’s May 2026 commentary reinforces the complexity, questioning why stocks are trading near record highs without resolution of the Iran situation, and flagging geopolitical uncertainty as an unresolved risk factor the market has partially, but not fully, priced in.
The two channels Wolfe Research identifies as temporary broadening mechanisms:
A cap-weighted S&P 500 index fund is marketed as broad diversification across 500 companies. At current concentration levels, that description requires revision. When five stocks represent 30% of the market and the top 25 account for 53%, a standard index fund functions more like a Magnificent 7 ETF with a long tail of smaller positions appended.
The cap-weighted structure that makes S&P 500 funds so cost-efficient also makes them structurally susceptible to index fund concentration risk, a dynamic that has accelerated sharply since 2024 as the same five names that dominate the market also dominate every passive vehicle tracking it.
This is not a niche concern. Morgan Stanley reported in January 2026 that passive indexers collectively hold approximately 50% of S&P 500 exposure via ETFs. That means roughly half of all index-linked equity capital in the United States carries a concentration profile that most holders did not actively choose.
Morgan Stanley described current valuations as offering a “thin margin for error,” warning that passive indexers face amplified drawdown risk if the Magnificent 7 core corrects.
Goldman Sachs identified a structural feedback loop: new passive inflows mechanically increase the weight of already-dominant names, compounding the concentration problem with every dollar of fresh capital. The firm, along with financial advisors, has flagged several alternatives:
The concentration is not arbitrary. Goldman Sachs reports that AI-linked mega-caps are generating approximately 40% EPS growth, a genuine earnings premium that rational investors have pursued. Nvidia closed at approximately $215.51 on 8 May 2026, carrying a year-to-date gain of roughly +8.58%. The company remains one of the largest index constituents by market capitalisation.
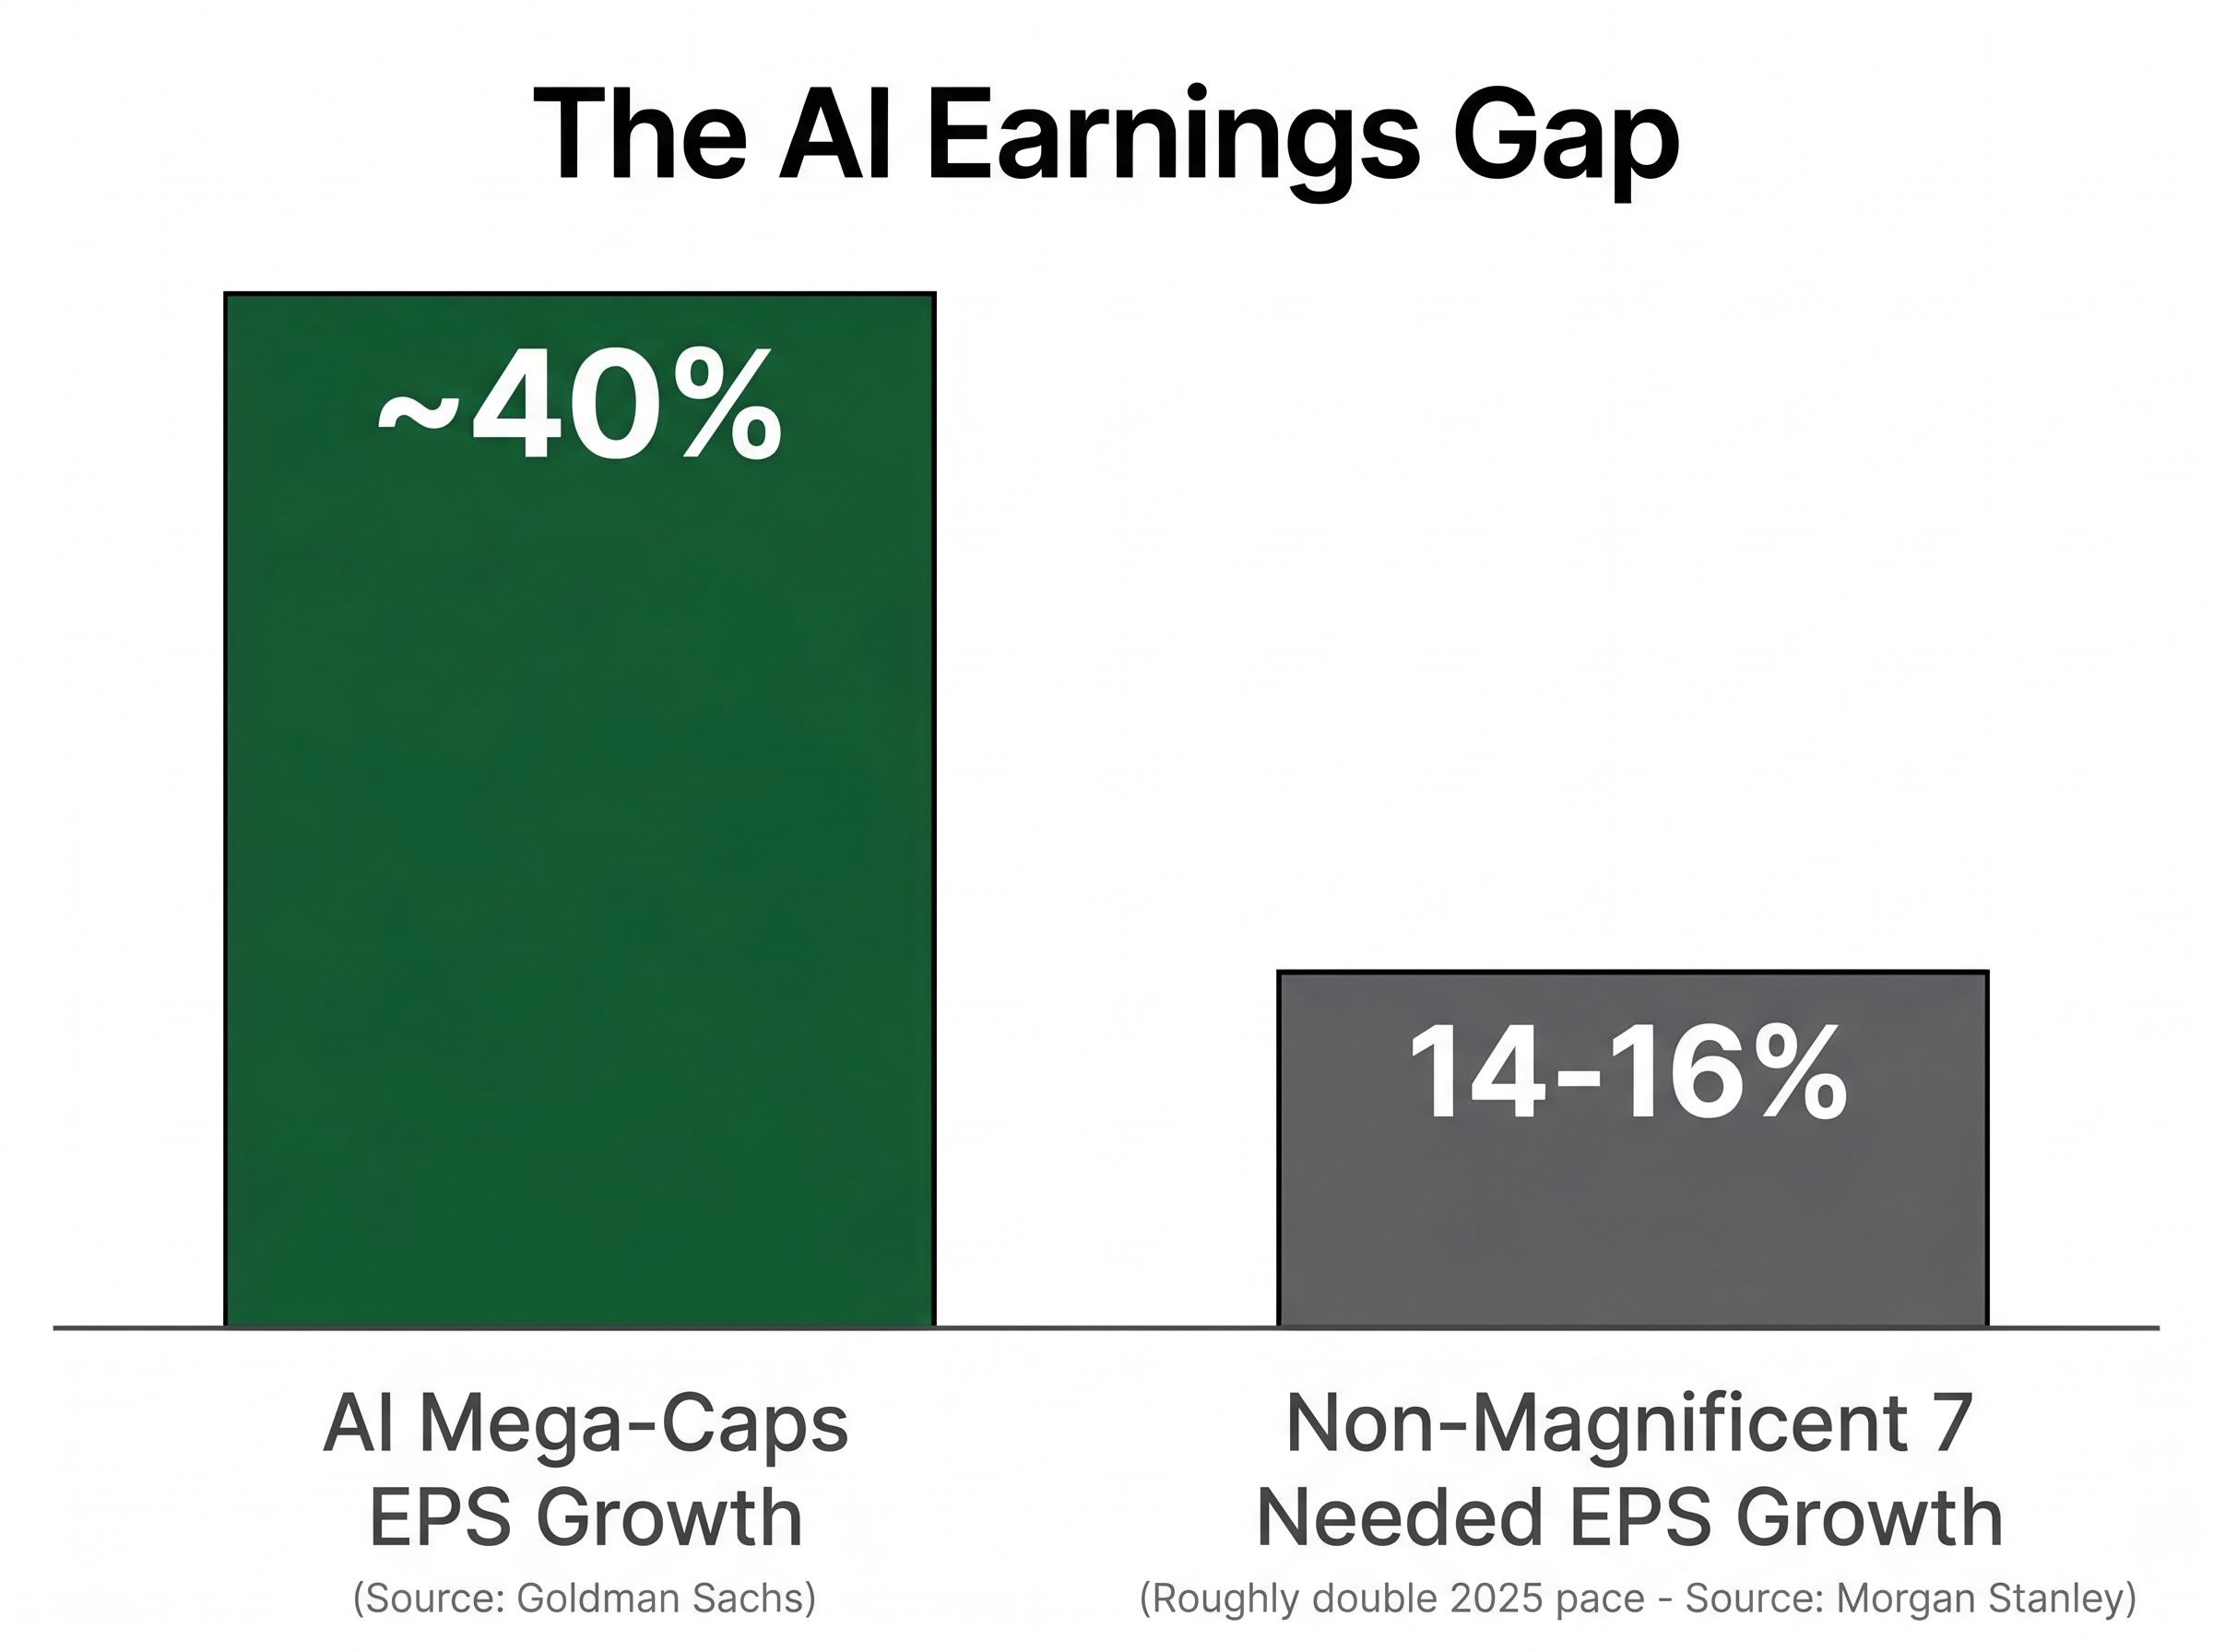
The burden this creates for the rest of the market is where the fragility emerges. Morgan Stanley calculates that non-Magnificent 7 companies need to sustain 14-16% EPS growth to justify current index valuations, roughly double their 2025 pace.
| Company Group | EPS Growth Rate | Key Condition |
|---|---|---|
| AI mega-caps | ~40% | Hyperscaler capex ROI must materialise |
| Non-Magnificent 7 | 14-16% needed | Roughly double 2025 pace |
Approximately $725 billion in hyperscaler capital expenditure is projected for 2026 across the major AI infrastructure builders. Investor tolerance for that spending is not unconditional. Goldman Sachs noted that Meta and Microsoft were penalised by investors for elevated capex, while Alphabet was rewarded, illustrating that the market is already discriminating between companies that can demonstrate AI return on investment and those that cannot yet show it.
AI capex return on investment has become the dividing line between mega-caps that receive investor credit for their spending and those that face scepticism: Goldman Sachs revised its 2026 hyperscaler capex projection upward by $80 billion in a single quarter, to $751 billion, while simultaneously flagging that companies unable to demonstrate AI revenue conversion are being discounted by the market.
Goldman Sachs projects a year-end S&P 500 target of 7,600, published on 29 April 2026, implying continued upside. That target is contingent on narrow mega-cap leadership sustaining its earnings trajectory.
Supporting data points reinforce near-term momentum. Crestwood Advisors reports Q1 2026 S&P 500 profit margins at 13.4%, the highest since 2009. J.P. Morgan noted a 13-day Nasdaq winning streak in early May 2026. The earnings engine, for now, is delivering.
Morgan Stanley warns that a political or geopolitical shock combined with non-Magnificent 7 earnings disappointment could trigger a 20%+ index-level correction, amplified by the concentration that makes the index dependent on a small cluster of companies for its aggregate earnings growth.
Investors and advisors are responding. Capital has begun rotating toward alternatives that performed well in April 2026:
The small-cap rotation that gained momentum through April 2026 reflects investor unease with exactly this concentration dynamic: the Russell 2000 returned approximately 12.21% year-to-date through May 1, more than double the S&P 500’s 5.62%, as institutional flows began actively seeking earnings exposure outside the mega-cap cluster.
The Wolfe Research finding is the closing anchor: the top 5 U.S. companies at roughly 30% of total equity market capitalisation, and the top 25 at approximately 53%, represent a concentration level without historical precedent. The AI earnings premium is the mechanism sustaining it. Geopolitical shifts may temporarily widen breadth, but the structural dominance of a small cluster of companies is expected to reassert itself.
For any investor whose equity exposure runs primarily through a cap-weighted S&P 500 index fund, the implication is specific. With passive indexers holding approximately 50% of S&P 500 exposure via ETFs, according to Morgan Stanley, most holders carry a concentration profile they did not deliberately choose. Both the upside scenario (Goldman Sachs’ 7,600 target) and the downside scenario (Morgan Stanley’s 20%+ correction risk) hinge on the same small group of companies.
The question for investors is whether their current allocation reflects a deliberate choice to be concentrated in AI mega-caps, or a passive default they have not revisited.
This article is for informational purposes only and should not be considered financial advice. Investors should conduct their own research and consult with financial professionals before making investment decisions. Past performance does not guarantee future results. Financial projections are subject to market conditions and various risk factors.
Stock market concentration refers to the degree to which a small number of companies account for a disproportionately large share of total market capitalisation. It matters because when concentration is extreme, the performance of the entire market becomes heavily dependent on just a handful of companies, amplifying both upside and downside risk for investors.
According to Wolfe Research, the five companies at the centre of current concentration are Microsoft, Nvidia, Apple, Amazon, and Alphabet, which together account for approximately 30% of total U.S. equity market capitalisation as of May 2026.
At current concentration levels, a standard cap-weighted S&P 500 index fund functions more like a Magnificent 7 ETF with a long tail of smaller positions, meaning passive investors carry significant exposure to a small cluster of mega-cap names without necessarily having made that choice deliberately.
Today's concentration actually exceeds the dot-com peak, according to Wolfe Research, with the top five companies controlling roughly 30% of the market and the top 25 controlling approximately 53%, levels that surpass every prior reading in the firm's historical dataset including the 1960s conglomerate era.
Investors and advisors have flagged several alternatives, including equal-weight S&P 500 ETFs that assign identical allocations regardless of market cap, international diversification such as MSCI Emerging Markets (which returned approximately 14.7% in April 2026), and traditional 60/40 rebalancing strategies that mechanically trim equity overexposure during periods of market strength.


