
How to Value a Transition-Stage Stock Using Tesla as a Case Study
17 mins ago

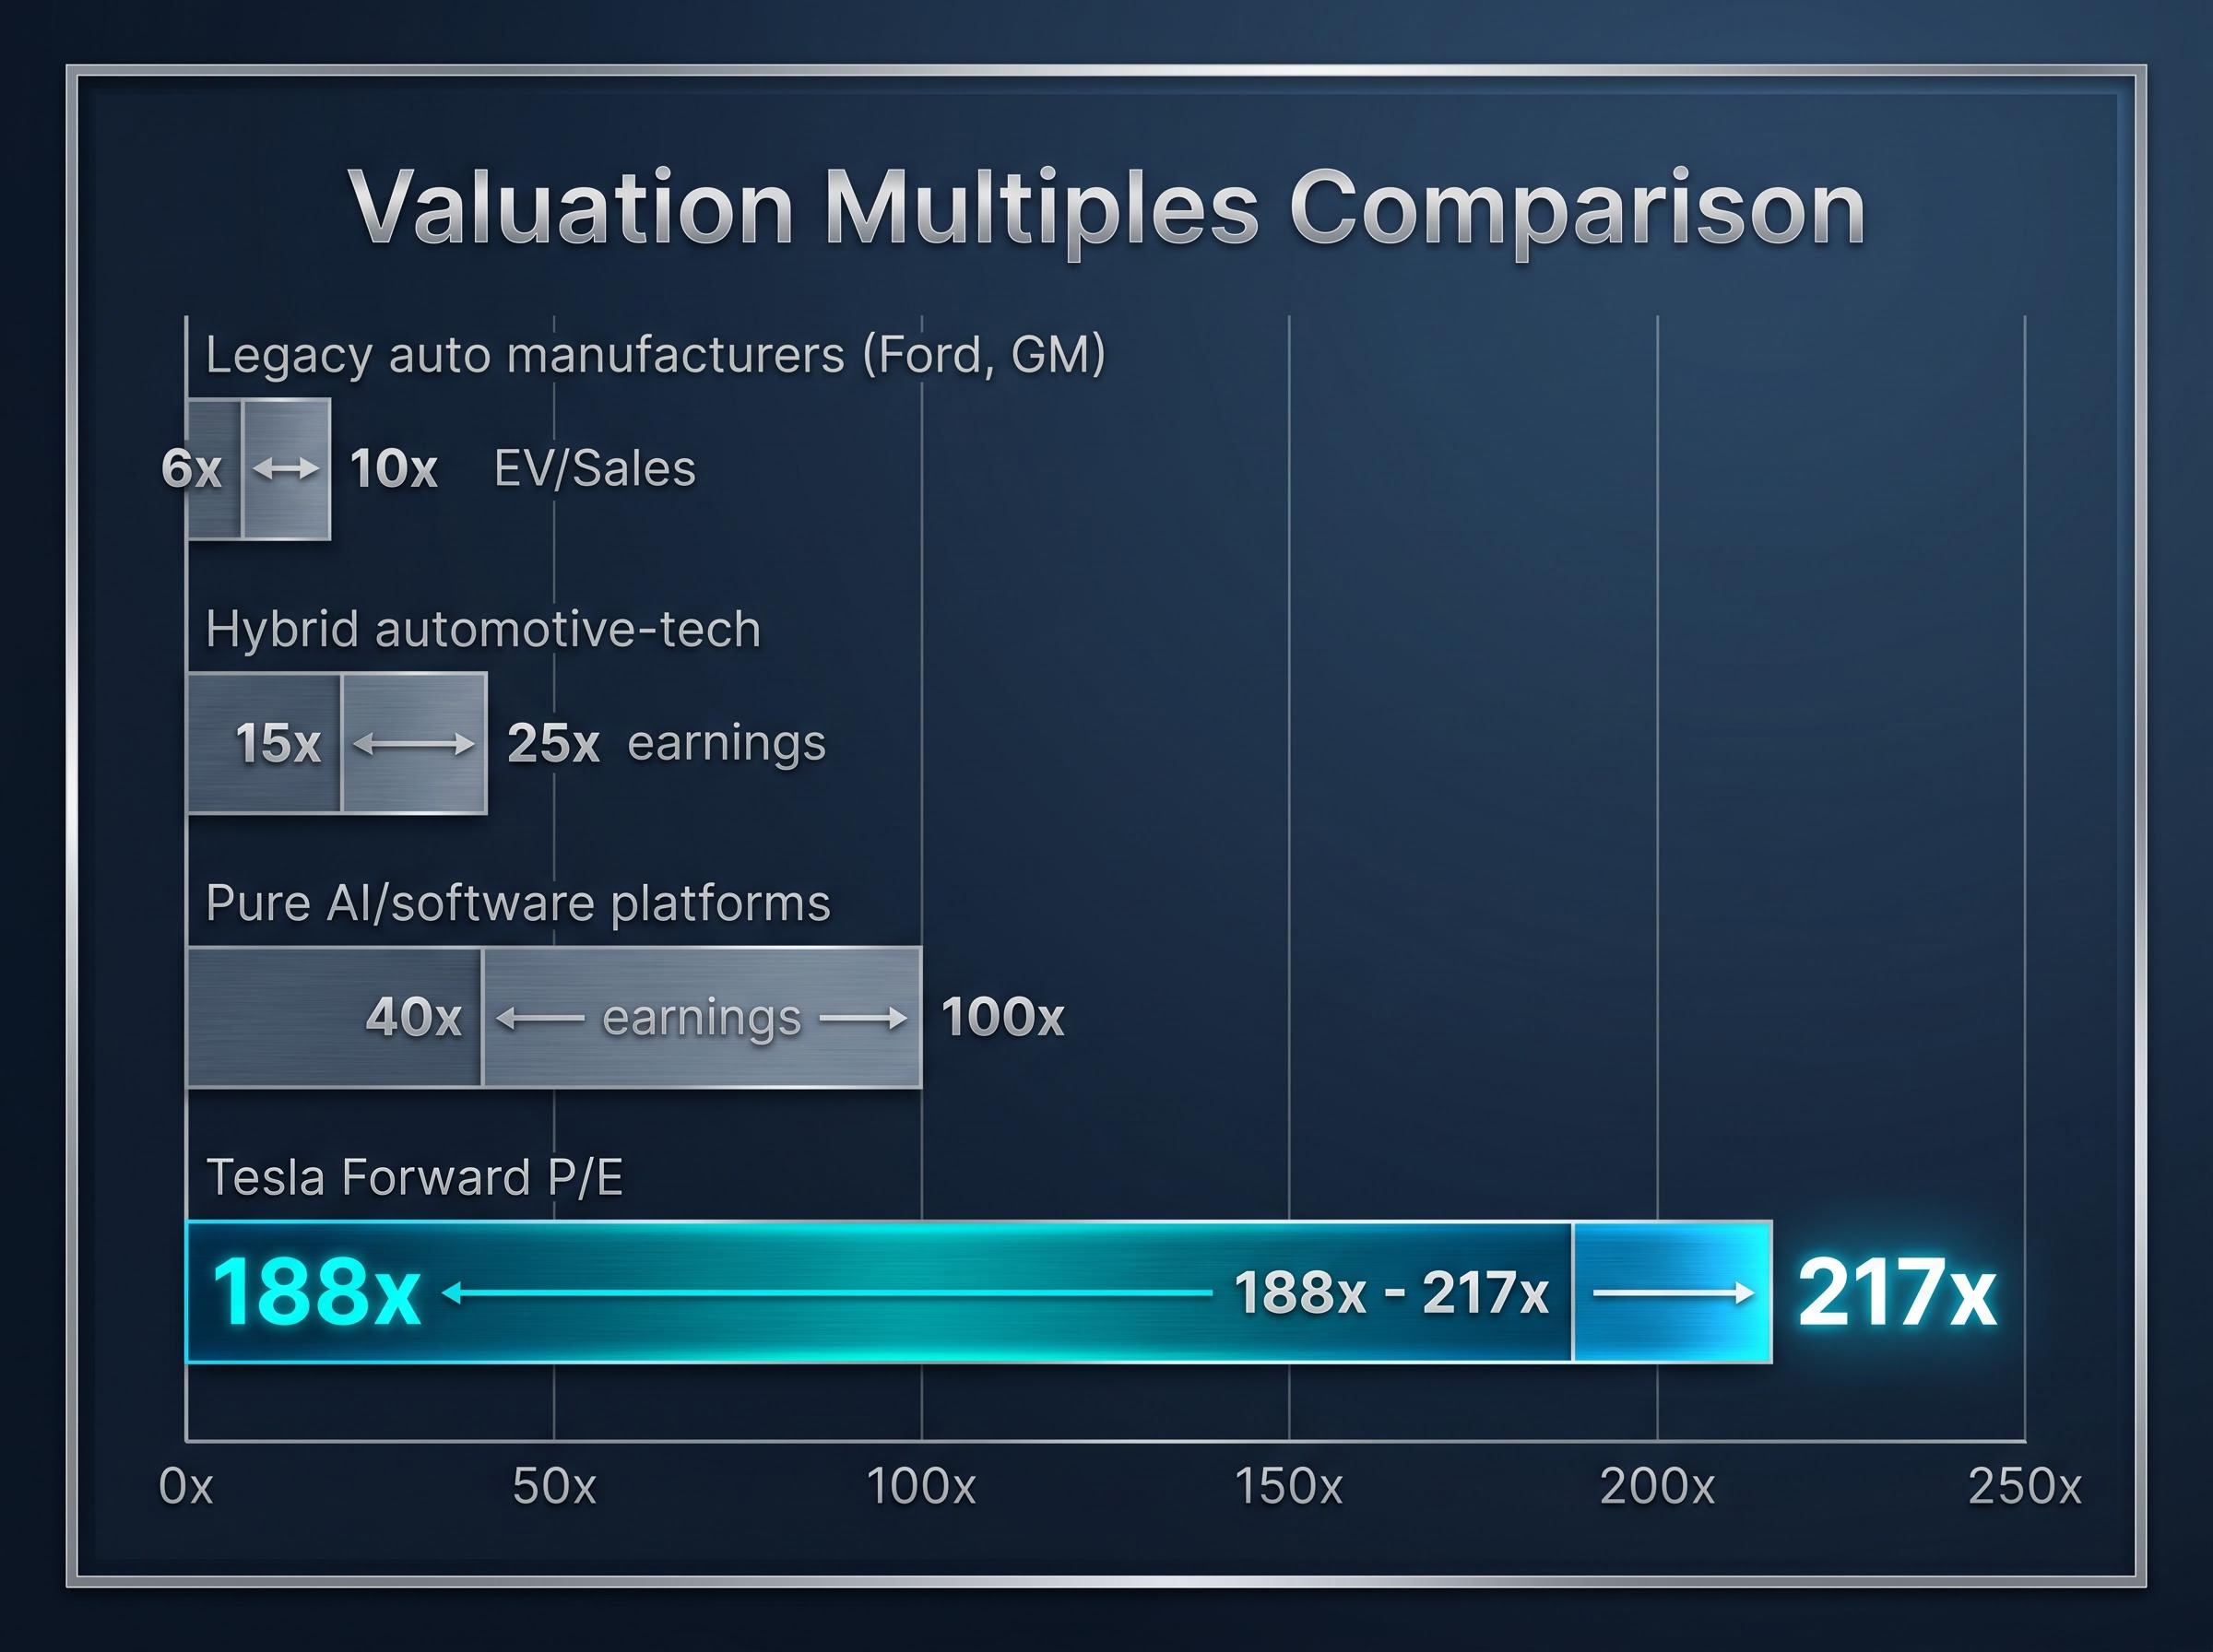
At roughly $426 per share, Tesla trades at a forward P/E of approximately 188x to 217x. The average Wall Street analyst, across 42 tracked ratings, holds a 12-month price target of $312.50, implying the stock already sits 27% above consensus. One analyst has a $600 target. Another has a $25 target. That $575-per-share spread is not a disagreement about Tesla. It is a disagreement about which company Tesla is going to become.
Tesla’s Q1 2026 results confirmed the core automotive business is stabilising: revenue of $22.4 billion, gross margin of 21.7%, both ahead of estimates. But the stock price is not primarily a bet on cars. It is a bet on Cyber Cab robo-taxis, the Optimus humanoid robot, and Full Self-Driving (FSD) monetisation at scale. When a company’s current valuation prices in a transformation that has not yet happened, standard valuation tools break down, and investors need a different framework.
This guide uses Tesla’s current bull-and-bear valuation spread as a live case study to teach a repeatable methodology for evaluating any transition-stage company. It covers how to build scenario models, assign probabilities, understand what the entry price actually buys, and recognise where a single assumption drives the entire outcome.
A competent analyst pulls up Tesla’s forward P/E, sees 188x to 217x, and compares it to Ford and GM trading at 6-10x EV/Sales. The conclusion writes itself: the stock is absurdly overvalued. But then a second analyst runs a sum-of-parts model, applies a software-like multiple to the autonomy segment, and reaches $600. Both analysts used legitimate tools. Neither made an error. The tool itself is the problem.
A P/E multiple is a shortcut. It works when a company’s earnings power at maturity is roughly visible from where it stands today. For a mature manufacturer with stable margins, the multiple reflects an extrapolable future. For a company whose current earnings represent a fraction of the business the market is actually pricing, the multiple captures a transformation that does not yet exist in the financials.
A P/E ratio is implicitly a claim about what earnings power looks like at maturity, not today. Working backwards from Tesla’s current 188-217x forward P/E, the stock requires the company to reach revenue and margin levels consistent with a 25-30x exit multiple in roughly a decade, levels that presuppose successful autonomy monetisation, not automotive growth alone.
The challenge sharpens when considering what peer group applies. Three categories of comparable companies each produce radically different “fair” multiples:
Peer benchmarking for high-multiple stocks requires assembling at least three distinct comparable sets simultaneously, legacy operators, hybrid platforms, and pure software companies, because applying any single peer group to a company straddling multiple business identities produces a false precision that obscures the range of legitimate valuation outcomes.
At 188-217x forward P/E, the market is not treating Tesla as a car company. It is pricing the stock closer to the third category, a bet on a business that does not yet generate the margins or revenue to justify it.
Professor Aswath Damodaran of NYU Stern, in his “Valuing Firms in Transition” framework (updated January 2026), argues that the correct approach is to blend current-state multiples with target-state multiples using probability weighting, rather than applying a single static multiple to a company straddling two identities.
The productive question, then, is not “what is the right P/E for Tesla?” It is: what probability does the current price assign to each future state?
The bull case for Tesla is not a single number. It is a sum-of-parts model where three distinct business segments receive distinct multiples reflecting their individual economics.
| Segment | Multiple Applied | Estimated Value Range |
|---|---|---|
| EV/Auto | 15-20x EBITDA | ~$300 billion |
| Energy (storage + solar) | ~40x earnings/EBITDA | ~$150 billion |
| Autonomy/FSD + Optimus | 50-100x (software-like) | $1 trillion+ (bull case) |
The autonomy segment carries a software-like multiple because, if realised, robo-taxi and FSD licensing revenue would operate at gross margins of 80% or higher, a fundamentally different profit structure than building and shipping physical vehicles. This is why Dan Ives at Wedbush assigns a $600 price target: robo-taxi margins above 20% by 2028 would justify a technology-platform valuation on that segment alone.
Morgan Stanley’s Adam Jonas frames Optimus as contributing up to 50% of Tesla’s equity value in the bull case, treating it as a call option on labour market disruption. The unit economics foundation rests on the Cyber Cab’s targeted unit cost below $30,000, compared to Waymo’s significantly more expensive hardware platform, suggesting a cost-competitive path to scale if the technology performs.
The revenue and margin assumptions behind this scenario are specific. Bull case models project revenue growth of 20-35% annually (midpoint approximately 27%), with net profit margins expanding from Tesla’s current 7-10% range to 20-30% as software revenue scales. At 25-35x earnings, these inputs produce estimated annualised returns of approximately 11-35% over a 10-year horizon.
For those returns to materialise, four assumptions must hold simultaneously:
Each assumption connects to the next. Without FSD, the Cyber Cab is a vehicle without a driver. Without Cyber Cab scale, robo-taxi margins remain theoretical. Without margin expansion, the software multiple collapses back to an automotive one.
Suppose Tesla executes well on its core automotive business, maintains above-average margins relative to legacy peers, and grows revenue steadily. Under this scenario, with revenue growth of 6-12% annually (midpoint 9%), net profit margins of 8-14%, and valuation multiples of 18-22x earnings, every projected return outcome is negative at an entry price near $426.
This is not pessimism. It is arithmetic. If autonomy, robo-taxis, and Optimus deliver zero incremental value, then the entire premium above what an automotive multiple would justify represents capital at risk.
The bear-case analyst targets quantify the downside. Gordon Johnson at GLJ Research applies a 15x automotive multiple with zero autonomy value and reaches a $25 target, implying 94% downside. Colin Langan at Wells Fargo caps the forward P/E at 25x and arrives at $125, implying 71% downside from current levels.
At $25, GLJ Research implies 94% downside. At $125, Wells Fargo implies 71% downside. Both targets assume the current price is paying for a transformation that will not arrive on any investable timeline.
The burden of proof sits entirely with the unproven segments. Four risk factors anchor the bear case:
The California DMV autonomous vehicle permitting rules, updated in April 2026, define the specific conditions under which manufacturers must obtain commercial deployment authorisation, setting the regulatory bar that any robo-taxi fleet operator must clear before generating meaningful fare revenue in the state.
None of these factors prove the bull case wrong. They calibrate the probability that it arrives on time. And in a stock priced for on-time arrival, calibration matters.
Competitive and regulatory evidence serves as the most objective input for calibrating scenario probabilities, because Waymo’s weekly ride counts, California permitting decisions, and NHTSA audit status each represent observable data points that update the probability dial without requiring investors to take a position on the technology’s ultimate feasibility.
The disagreement between a $25 price target and a $600 price target is not resolvable by picking the “right” analyst. It is resolvable by assigning probabilities to each scenario and computing a weighted outcome. This is the methodological core of transition-company valuation.
Damodaran’s framework structures the analysis into three scenarios, each with a probability weight and a fair value range:
| Scenario | Probability Weight | Fair Value Estimate | Key Assumption |
|---|---|---|---|
| Bear | 30% | $100-$150 | Tesla remains primarily an auto manufacturer; autonomy fails to commercialise |
| Base | 45% | $250-$350 | Partial autonomy success with moderate robo-taxi and energy scaling |
| Bull | 25% | $800-$1,200 | Full transition to AI/robotics platform with $200B+ revenue by 2030 |
The probability-weighted fair value across these scenarios comes to approximately $300-$400. The stock trades near $426. That gap means the market is pricing in slightly above base-case outcomes, leaning toward partial bull-case success without requiring full transformation.
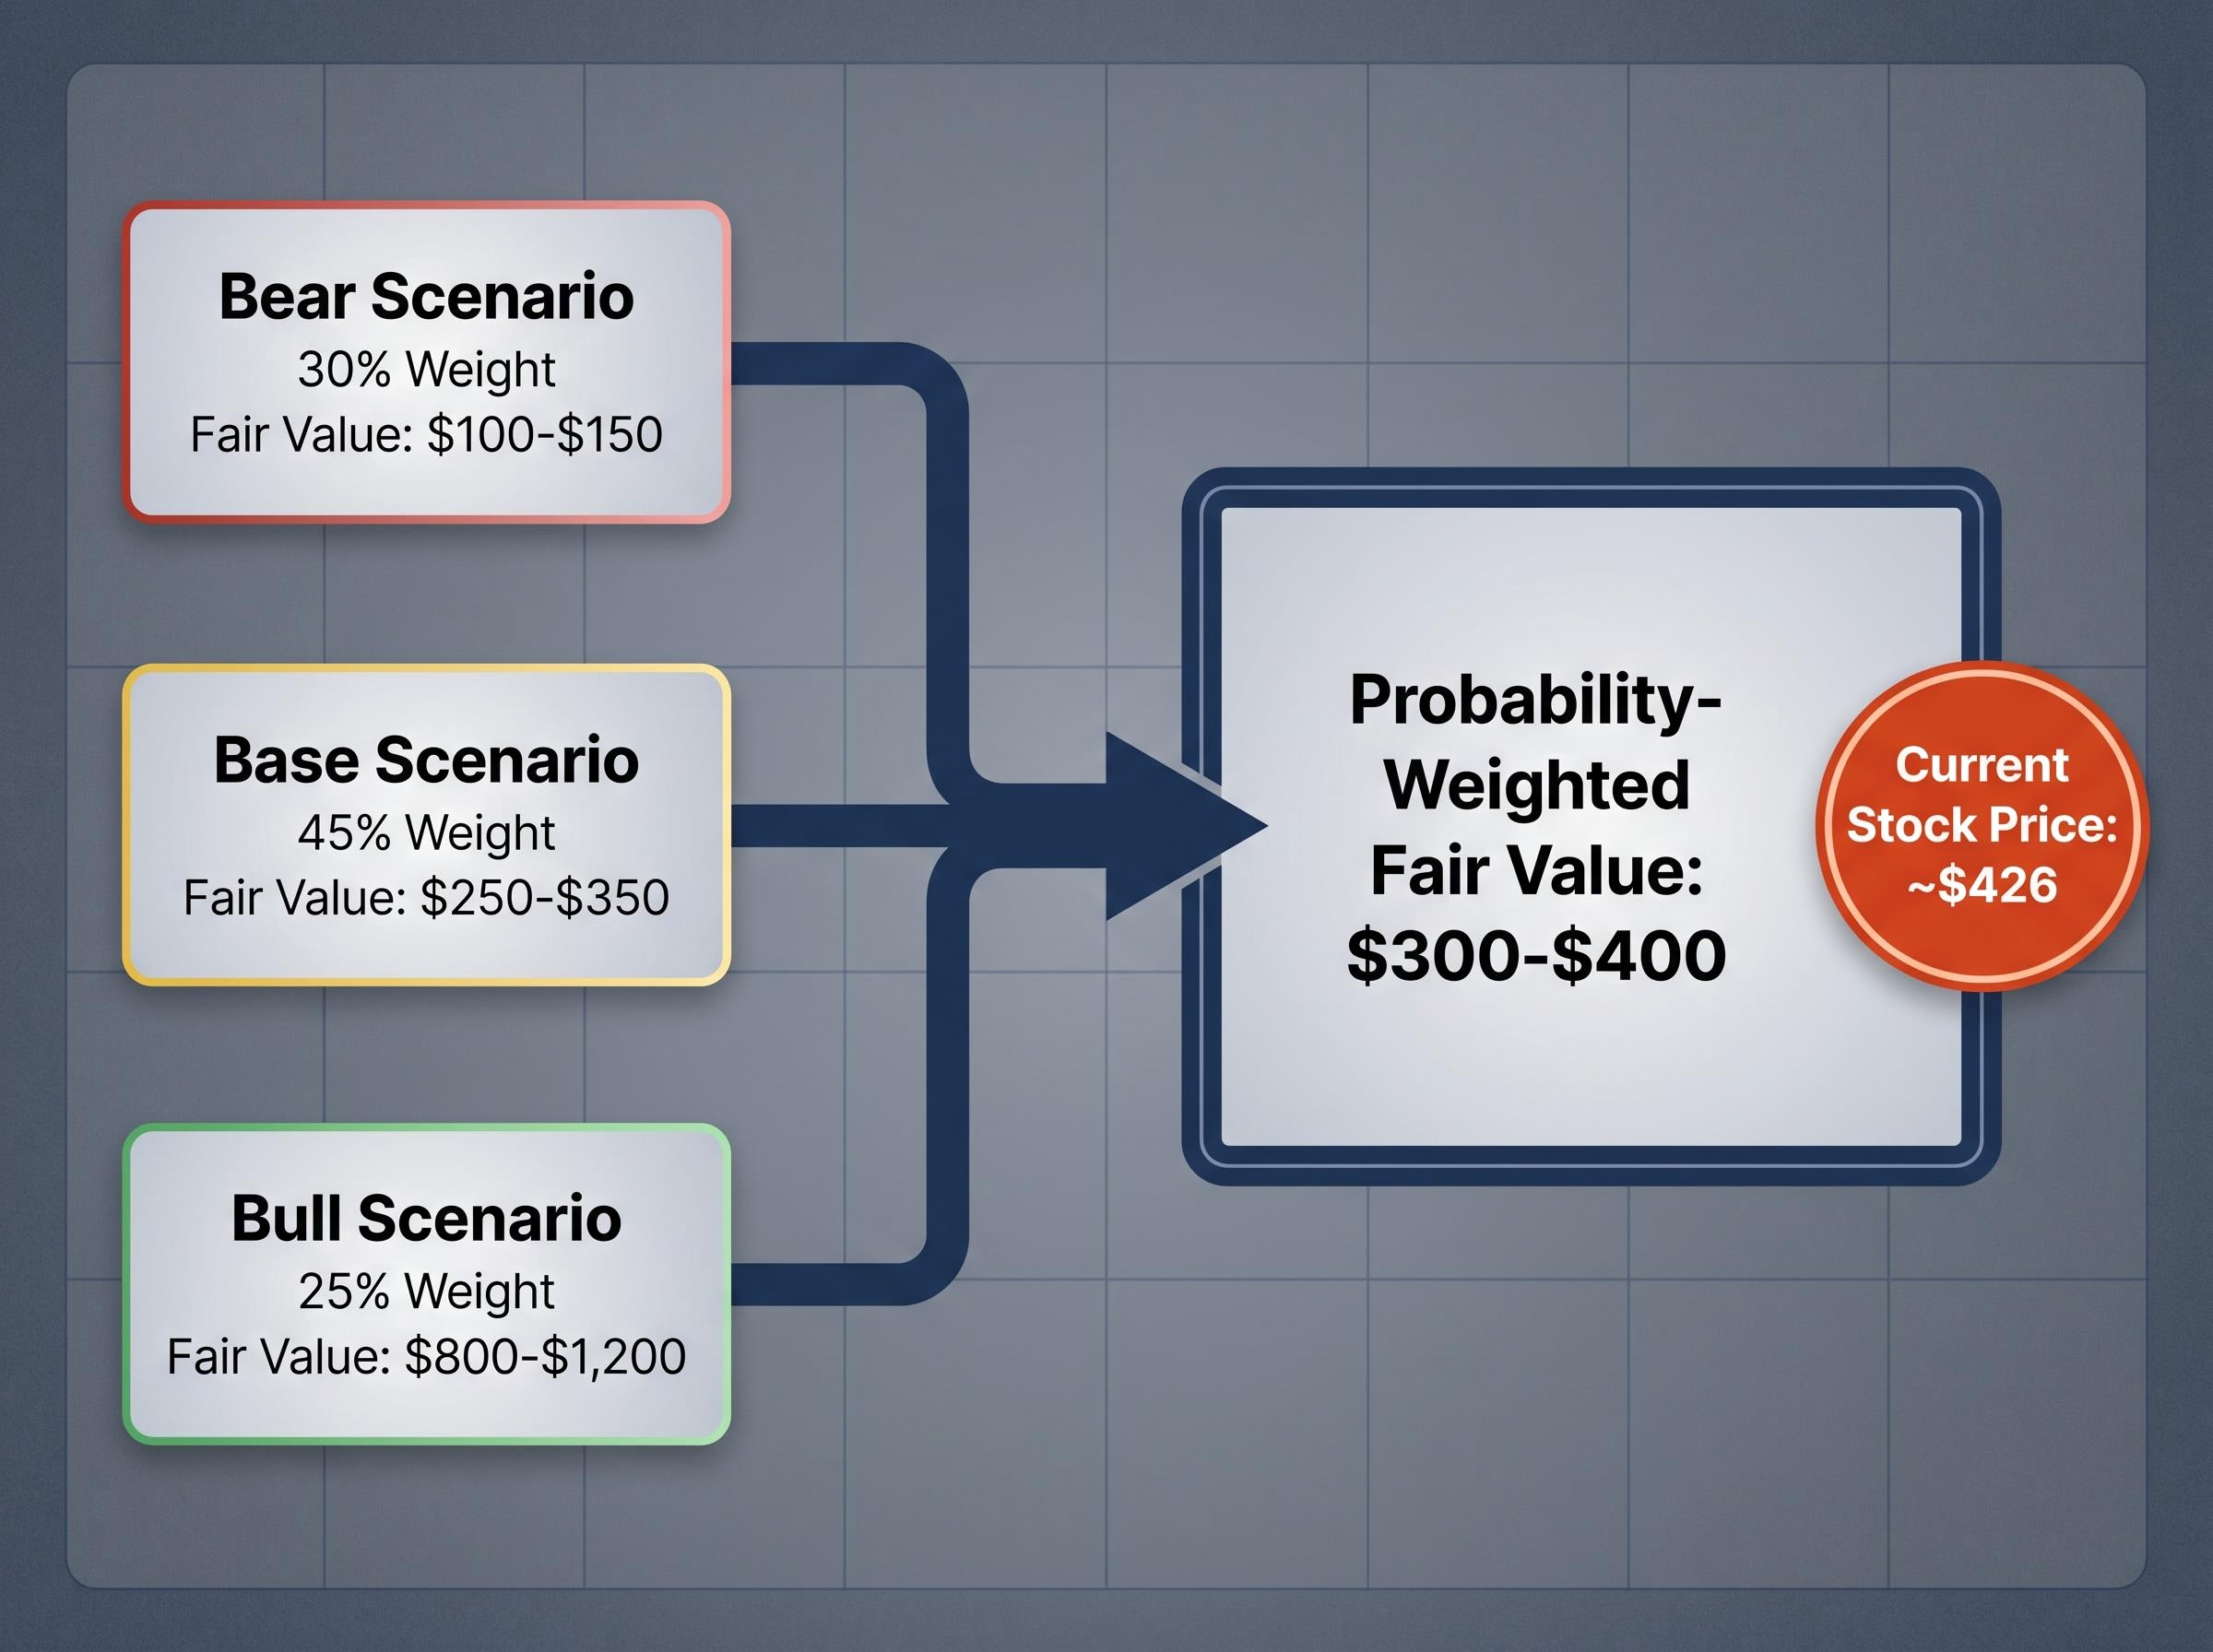
More than 70% of Tesla’s current market value resides in unproven future states. This is the defining characteristic of a transition-stage valuation: the majority of the price tag is a probability estimate, not an earnings reflection.
McKinsey’s Q1 2026 real options framework reinforces this approach. It treats FSD and Optimus as call options with defined strike prices (the capital required to commercialise), expiry dates (the timeline before the market loses patience), and volatility (the range of outcomes). Standard discounted cash flow analysis understates the value of these segments because it cannot capture asymmetric upside; real options pricing corrects for this.
For investors wanting to apply the three-tool ensemble in more depth, our dedicated guide to sum-of-parts valuation for platform transitions walks through how professionals combine discounted cash flow, sum-of-parts, and probability-weighted scenario modelling for companies where the speculative segments carry materially different risk profiles from the mature ones, including worked examples of how shifting a robotaxi scenario from 30% to 10% probability moves the blended intrinsic value estimate.
A 10-percentage-point shift in bull scenario probability, from 25% to 35%, moves the probability-weighted fair value by approximately $80-$120 per share. This single sensitivity explains why Tesla is among the most volatile large-cap stocks in the market.
Every Cyber Cab deployment report, every FSD miles update, every Optimus production milestone functions as a probability update in the market’s model. It is not just news. It is a recalibration of the weighting that determines whether $426 is cheap or expensive. When Waymo reports 500,000 paid rides per week, that data point shifts the competitive probability. When Tesla begins Cyber Cab production at Giga Texas, that shifts the execution probability. The stock price moves because the weights are moving.
Operational signals as scenario reality-checks become most valuable at the quarterly earnings cycle, when delivery volumes, energy storage trends, inventory levels, and capex guidance either confirm or erode the specific assumptions embedded in each scenario, giving investors a structured basis for updating probability weights rather than reacting to the headline earnings beat or miss.
An investor who bought Tesla near $100 a few years prior and an investor who bought near $426 this month may hold identical views on robo-taxis, Optimus, and FSD. They hold fundamentally different risk profiles.
At $100, the bear case (fair value $100-$150) still produced flat to positive returns. The base case delivered substantial upside. Even a partial miss on autonomy timelines left the investor whole. At $426, the arithmetic reverses. The bear case produces losses of 71% or worse. The base case (fair value $250-$350) requires near-perfect execution just to approach breakeven. The margin for error has been consumed by the entry price.
This asymmetry is the most underappreciated variable in transition-company investing. Analyst forward EPS estimates for Tesla are projected to grow more than 5x from current levels, incorporating autonomy assumptions. But those same estimates declined more than 90% from their peak before recovering, illustrating the earnings volatility that makes entry price so consequential. The consensus target of $312.50 implies approximately 27% downside from $426, even before reaching bear-case territory.
Calculating what return is already “priced in” at a given entry price follows three steps:
A correct long-term thesis produces poor returns if the entry price already prices in full scenario success. The price paid is not a transaction detail; it is the most important analytical input.
Tesla’s $575-per-share analyst spread is extreme, but the methodology it demands applies to any company whose current price is pricing in a future that has not yet been earned. Four transferable lessons emerge from this case study:
The analyst consensus of $312.50 signals that even mainstream institutional analysis sees the current price as pricing in above-base-case outcomes. Waymo’s 500,000 paid rides per week and $350-$355 million in annualised revenue provide the competitive baseline that Tesla’s robo-taxi projections must be measured against. More than 70% of Tesla’s market value resides in unproven future states, the threshold at which a transition-company framework becomes necessary rather than optional.
Sacra’s Waymo revenue and ride volume analysis, published May 2026, puts the company at 500,000 weekly rides across 11 commercial markets and approximately $355 million in annualised revenue as of early 2026, figures that represent the competitive baseline any robo-taxi entrant must displace to capture meaningful market share.
Before entering any transition-stage position, three questions warrant direct answers:
The Tesla bull/bear debate is not primarily a debate about electric vehicles or robots. It is a demonstration of how entry price and scenario probability interact to determine investment outcomes. The base case, partial execution on autonomy while the core automotive business continues, remains the most probable single scenario for most investors to anchor on. The probability-weighted fair value range of $300-$400 sits below the current price near $426, which means today’s buyer is implicitly betting on above-average execution.
The methodology laid out in this guide applies well beyond a single stock. From AI infrastructure plays to biotech platforms to legacy industrials pivoting to software, any company where the current price embeds a transformation that has not yet happened demands the same framework: scenarios with explicit assumptions, honest probability weights, and a bear-case stress test at the proposed entry price.
The price paid is not a transaction detail. It is the most important analytical input in any transition-company investment.
This article is for informational purposes only and should not be considered financial advice. Investors should conduct their own research and consult with financial professionals before making investment decisions. Financial projections referenced in this article are subject to market conditions and various risk factors. Past performance does not guarantee future results.
Scenario-based stock valuation analysis assigns explicit probability weights to multiple future outcomes (bear, base, and bull cases), then calculates a weighted average fair value across those scenarios rather than relying on a single price target or multiple.
P/E multiples assume a company's current earnings are representative of its future earnings power, but for transition-stage companies like Tesla, most of the market value resides in unproven future business segments that do not yet appear in the financials.
You assign a fair value estimate and a probability weight to each scenario (for example, 30% bear at $100-$150, 45% base at $250-$350, and 25% bull at $800-$1,200), then sum the weighted values to arrive at a blended intrinsic value estimate.
The entry price determines how much of the valuation is already priced in: a higher entry price means the bear case produces larger losses and the base case may only break even, leaving little margin for error if key assumptions fail to materialise.
Investors can track Cyber Cab deployment reports, FSD miles accumulated, Optimus production milestones, California DMV commercial permits, and competitive metrics like Waymo's weekly paid ride volume to recalibrate the probability weights in their scenario models.


