
How to Value a Transition-Stage Stock Using Tesla as a Case Study
17 mins ago

At roughly $425 per share in May 2026, Tesla is priced for a future that has not yet arrived. The gap between what the stock costs today and what the company has actually delivered is the tension every serious investor must learn to evaluate.
Tesla’s Q1 2026 earnings renewed a debate that has defined the stock for years: is this an automaker trading at a technology premium, or a technology platform company that still happens to make cars? With full-year 2025 deliveries at 1.64 million vehicles (well short of aggressive bull case assumptions) and a stock price that embeds robotaxi, Optimus humanoid robot, and AI platform revenue streams that remain speculative, the company offers an unusually transparent window into how markets price transformation risk. This guide uses Tesla’s current valuation as a live case study to teach a broadly applicable framework: how to build and stress-test bull and bear scenarios for any company in transition, how to quantify the range of return outcomes, and why the price paid at entry may be one of the single most consequential variables in any investment decision.
Most valuation shortcuts work well for stable businesses. They fail when a company sits between two identities.
Tesla closed at approximately $425.38 on 8 May 2026. Whether that figure represents a bargain or a burden depends entirely on which version of Tesla an investor believes they are buying. The company’s current net profit margins of 7-10% sit far below the 20-30% margins the bull case requires. That gap is not a rounding error; it is the distance between what Tesla earns today and what the stock price already assumes it will earn in the future.
Standard valuation methods struggle with this kind of company for three specific reasons:
The NYU Stern DCF valuation framework developed by Aswath Damodaran identifies terminal value sensitivity as the central challenge when pricing high-growth companies, precisely because small changes in long-run growth assumptions produce outsized swings in present value when most of the implied worth sits beyond a seven-year horizon.
When a stock price embeds a future that has not materialised, investors are not buying a company’s present. They are buying a probability-weighted version of its future. The appropriate analytical response is scenario construction: building distinct bull and bear cases, stress-testing the assumptions that support each, and quantifying the range of returns those scenarios produce.
Q1 2026 offered one data point worth anchoring to. Tesla’s gross margin of 21.7% beat the 17% analyst consensus, evidence that the core business is not collapsing even as transformation risk persists. The question is whether that margin trajectory leads toward the 20-30% net margins the bull case demands, or stabilises well short of them.
The Tesla Q1 2026 earnings release provided the raw data points underpinning this analysis: a 21.7% gross margin against a 17% analyst consensus, adjusted EPS of $0.41 against $0.35 expected, and CFO guidance confirming more than $25 billion in planned 2026 capital expenditure that is expected to produce negative free cash flow.
Three analytical pillars determine whether a platform transition thesis holds. They work for Tesla, and they work for any company claiming to become something fundamentally different from what it is today. A legacy media company pivoting to streaming, a retailer building logistics infrastructure, an energy company moving into renewables: each faces the same three questions in different forms.
The framework’s power lies in forcing investors to stress-test each pillar independently. A single pillar failure can invalidate an entire bull case.
| Pillar | Bull Assumption | Bear Risk | Current Tesla Evidence |
|---|---|---|---|
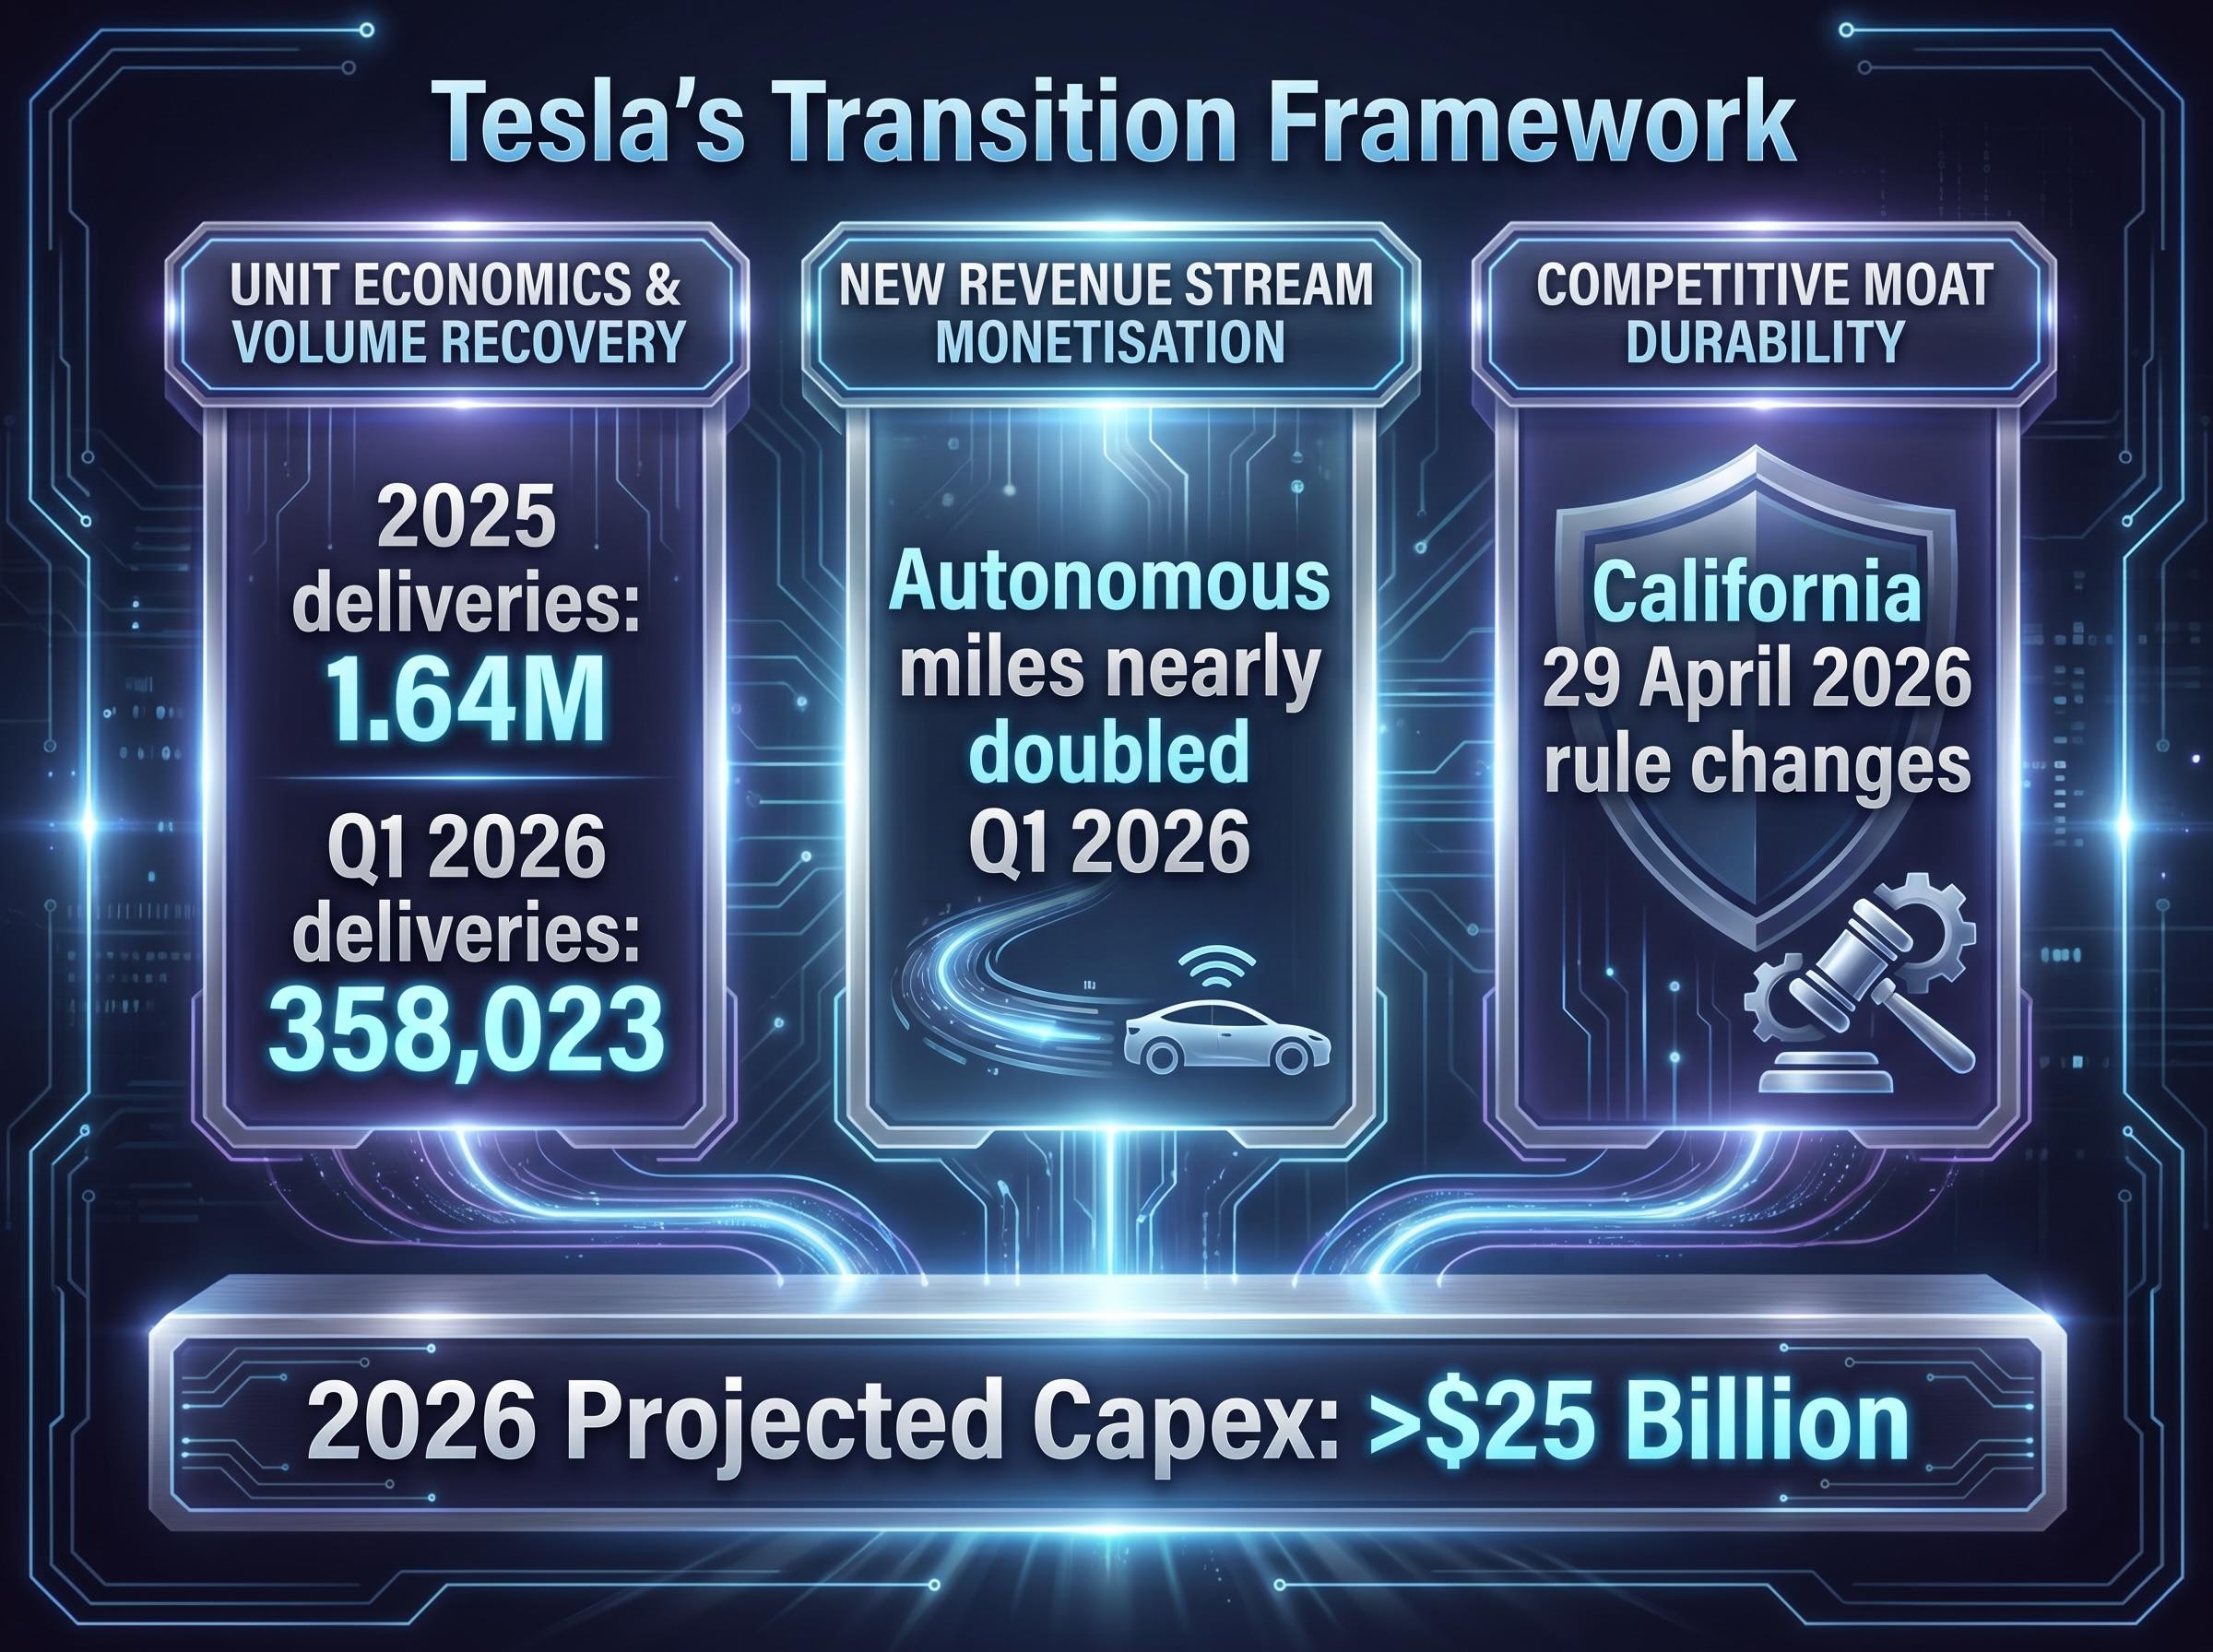
| Unit Economics & Volume Recovery | Meaningful volume recovery with maintained or expanding margins | EV price wars compress margins; delivery volumes stagnate | 2025 deliveries of 1.64 million; Q1 2026 deliveries of 358,023 units, below aggressive growth assumptions |
| New Revenue Stream Monetisation | Software, AI, and energy segments become material contributors | Monetisation fails; streams remain speculative and pre-revenue | Autonomous vehicle miles nearly doubled in Q1 2026, but commercial robotaxi revenue remains minimal |
| Competitive Moat Durability | First-mover advantage in robotaxi and humanoid robotics | Waymo executes better; commoditisation accelerates across EV market | California’s 29 April 2026 rule changes added noncompliance notices for autonomous vehicles |
As of Q1 2026, actual delivery data is already testing the first pillar. The second pillar remains largely speculative. And the third faces active regulatory and competitive headwinds.
Tesla’s CFO has projected more than $25 billion in capital expenditure for 2026, a figure that reflects the scale of investment the company is making across all three pillars simultaneously. That commitment is real and present-tense, even as the revenue streams it is meant to unlock remain future-tense.
Evaluate each pillar with the same question: what specific, verifiable evidence would confirm or disconfirm this assumption within the next twelve months? If the answer is “none,” the pillar is speculative, and the weight assigned to it in any valuation model should reflect that.
Translating a scenario framework into an ongoing investment discipline requires pre-defined monitoring triggers established before purchase: specific, measurable thresholds such as auto gross margin targets, robotaxi regulatory milestones, and capex efficiency ratios that allow probability weights to be updated each quarter based on evidence rather than narrative.
The bull case for Tesla is not a single optimistic number. It is a conditional chain, and each link depends on the one before it.
Three conditions must hold simultaneously for the bull scenario to materialise:
The numbers behind the chain: bull case revenue growth of 20-35% annually (midpoint approximately 27%), projected net profit margins of 20-30% (compared to the current 7-10%), and valuation multiples of 25x-35x earnings. Under full realisation, estimated 10-year annualised returns range from approximately 11% to 35%.
The probability of simultaneous execution across all three conditions is estimated at 5-10%. Not because the technology is impossible, but because no company has achieved simultaneous commercial-scale execution across autonomous vehicles, humanoid robotics, and core automotive manufacturing.
There is a genuine bull data point: autonomous vehicle miles driven nearly doubled in Q1 2026 compared to the prior period. The technology is progressing. The question is pace and scale.
Elon Musk’s track record on timelines is a risk factor independent of whether the long-term vision is correct. In 2016, Tesla claimed all vehicles had “full self-driving hardware.” In 2019, Musk projected one million robotaxis by 2020. In 2021, Optimus deployment was claimed for 2022. The core technologies have often moved forward, but later and at lesser initial scale than announced.
The distinction between “the vision is wrong” and “the timeline is wrong” matters enormously, because they produce very different investment outcomes depending on entry price. Delayed timelines extend the period during which capital is deployed into a company still investing heavily ahead of returns, increasing the effective cost of holding the position.
The bear scenario treats Tesla as a premium electric vehicle company and assigns no value to autonomous driving or robotics. It does not assume failure. It assumes those businesses simply do not contribute meaningfully to earnings within the analysis horizon.
Bear case inputs: revenue growth of 6-12% annually (midpoint 9%), net profit margins of 8-14%, and valuation multiples of 18x-22x earnings. Even these assumptions are generous relative to traditional automakers like Ford or GM; this is not a worst-case scenario but a “no-transformation-credit” scenario.
Analyst price target divergence of this magnitude (the gap between Tesla’s highest and lowest published targets spans more than $575) is not a symptom of analytical failure; it is a direct reflection of competing assumptions about which company is being modelled, making the range itself a diagnostic tool for identifying which scenario inputs drive the most valuation sensitivity.
| Scenario | Revenue Growth | Net Profit Margin | Valuation Multiple | 10-Year Return Estimate |
|---|---|---|---|---|
| Bull Case | 20-35% annually | 20-30% | 25x-35x earnings | ~11-35% annualised |
| Bear Case | 6-12% annually | 8-14% | 18x-22x earnings | Negative at ~$375/share |
At approximately $375 per share, close to current levels, all projected return outcomes under the bear case were negative.
The arithmetic delivers the implication without editorialising: at today’s price, Tesla buyers are implicitly paying for at least partial realisation of the transformation thesis. The bear case floor sits below the current stock price.
Competitive threats make this scenario a live possibility. BYD has surpassed Tesla as the world’s largest EV producer by volume. Waymo maintains an operational advantage in U.S. robotaxi deployment, with broader city coverage and higher ride volumes than Tesla’s service. If Microsoft, Google, and Amazon intensify their robotics investment, the competitive moat pillar faces additional pressure from companies with substantial capital resources.
The same stock can be a sound investment at one price and a poor one at another, even if the long-term business outcome is identical. This is not opinion; it is arithmetic.
Consider two investors holding the same asset. One purchased Tesla shares at approximately $100 a few years prior. The other purchased near $450. Both own the same company with the same technology, the same management, and the same competitive position. Their return outcomes, however, are fundamentally different, because the margin between cost basis and any future exit price determines the entire investment result.
Forward analyst earnings-per-share estimates project more than 5x growth from current levels, illustrating that sell-side consensus already incorporates substantial AI and autonomy contributions. Year-to-date performance of -13.42% as of early May 2026 signals that even investors who believe in the long-term thesis face short-term mark-to-market risk at these prices. Technical analysis shows support around $382.60 and a resistance cluster of $423-$455.
The concept underlying this is margin of safety: buying below a conservative estimate of a company’s value creates a cushion against being wrong about some assumptions. Translate the scenario analysis into a price decision with four steps:
At approximately $425, Tesla is trading at or above the bear case threshold where all projected returns are negative. Buyers at this price are implicitly betting on at least partial bull case realisation, meaning some combination of robotaxi revenue, Optimus commercialisation, or margin expansion beyond what the core auto business alone can deliver.
This is not a buy or sell recommendation. It is a demonstration of what the entry price decision actually means in quantitative terms. The methodology identifies the bet embedded in the price; whether to take that bet remains the individual investor’s decision.
Tesla’s case is unusual in its transparency but not unusual in its structure. Any company claiming a transformation presents the same analytical challenge. The methodology demonstrated here is the reusable output:
The most valuable output of a bull and bear analysis is not picking a winner between the two scenarios. It is understanding what the current market price already assumes. That understanding determines whether an investment is cheap or expensive relative to risk.
For investors wanting to apply more advanced tools to the scenario framework introduced here, our dedicated guide to sum-of-parts valuation walks through how professionals separately value Tesla’s mature automotive segment, its speculative robotaxi and Optimus lines, and its energy business, then combine the pieces using probability-weighted scenario modelling to produce a blended intrinsic value estimate.
The gap between Tesla’s current margins (7-10%) and bull case targets (20-30%) quantifies how much transformation the market is pricing in. The $25 billion-plus capital expenditure commitment is a reminder that transformation carries a direct, present-tense cost that appears in cash flow statements before any transformation revenue appears in income statements.
Investors who internalise this methodology will apply it instinctively to every high-multiple, transformation-narrative stock they encounter.
In any company-in-transition investment, the stock price is not just a number. It is a statement of which scenario the market currently believes is most likely. The investor’s task is to decide whether they agree with that implied bet, and whether the price offers sufficient compensation for the risk of being wrong.
The practical next step: build a scenario model using this framework for a company already in the portfolio or under research. Start with the three pillars. Quantify the bull and bear return ranges. Identify what the current price implies. Then determine whether entry price discipline supports the position.
Tesla’s outcome remains genuinely uncertain, and that uncertainty is the point. It is exactly the kind of situation where valuation discipline separates informed risk-taking from speculation. The framework does not eliminate uncertainty. It makes the uncertainty visible, measurable, and actionable.
This article is for informational purposes only and should not be considered financial advice. Investors should conduct their own research and consult with financial professionals before making investment decisions. Past performance does not guarantee future results. Financial projections are subject to market conditions and various risk factors.
Stock valuation analysis for a company in transition involves building distinct bull and bear scenarios, stress-testing the assumptions behind each, and quantifying the range of return outcomes rather than relying on standard peer comparisons or simple price-to-earnings ratios.
You identify three pillars: unit economics and volume recovery, new revenue stream monetisation, and competitive moat durability, then assign specific revenue growth rates, profit margin targets, and valuation multiples to each scenario to produce a range of estimated returns.
The price paid at entry determines the entire return outcome because it sets the gap between cost basis and any future exit price; two investors holding the same stock with the same long-term outcome can produce very different returns depending solely on what they originally paid.
A margin of safety means buying below a conservative estimate of a company's intrinsic value, creating a cushion against errors in your assumptions; in practice, investors calculate a probability-weighted midpoint across scenarios and then apply a discount to that figure before setting a target price range.
Tesla's Q1 2026 gross margin of 21.7% beat the 17% analyst consensus, showing the core business is not collapsing, but it still falls well short of the 20-30% net margins the bull case requires, meaning significant transformation must still occur to justify the current share price.


