
Why AI Is Splitting Semiconductor Stocks From the Rest of Tech
2 hrs ago
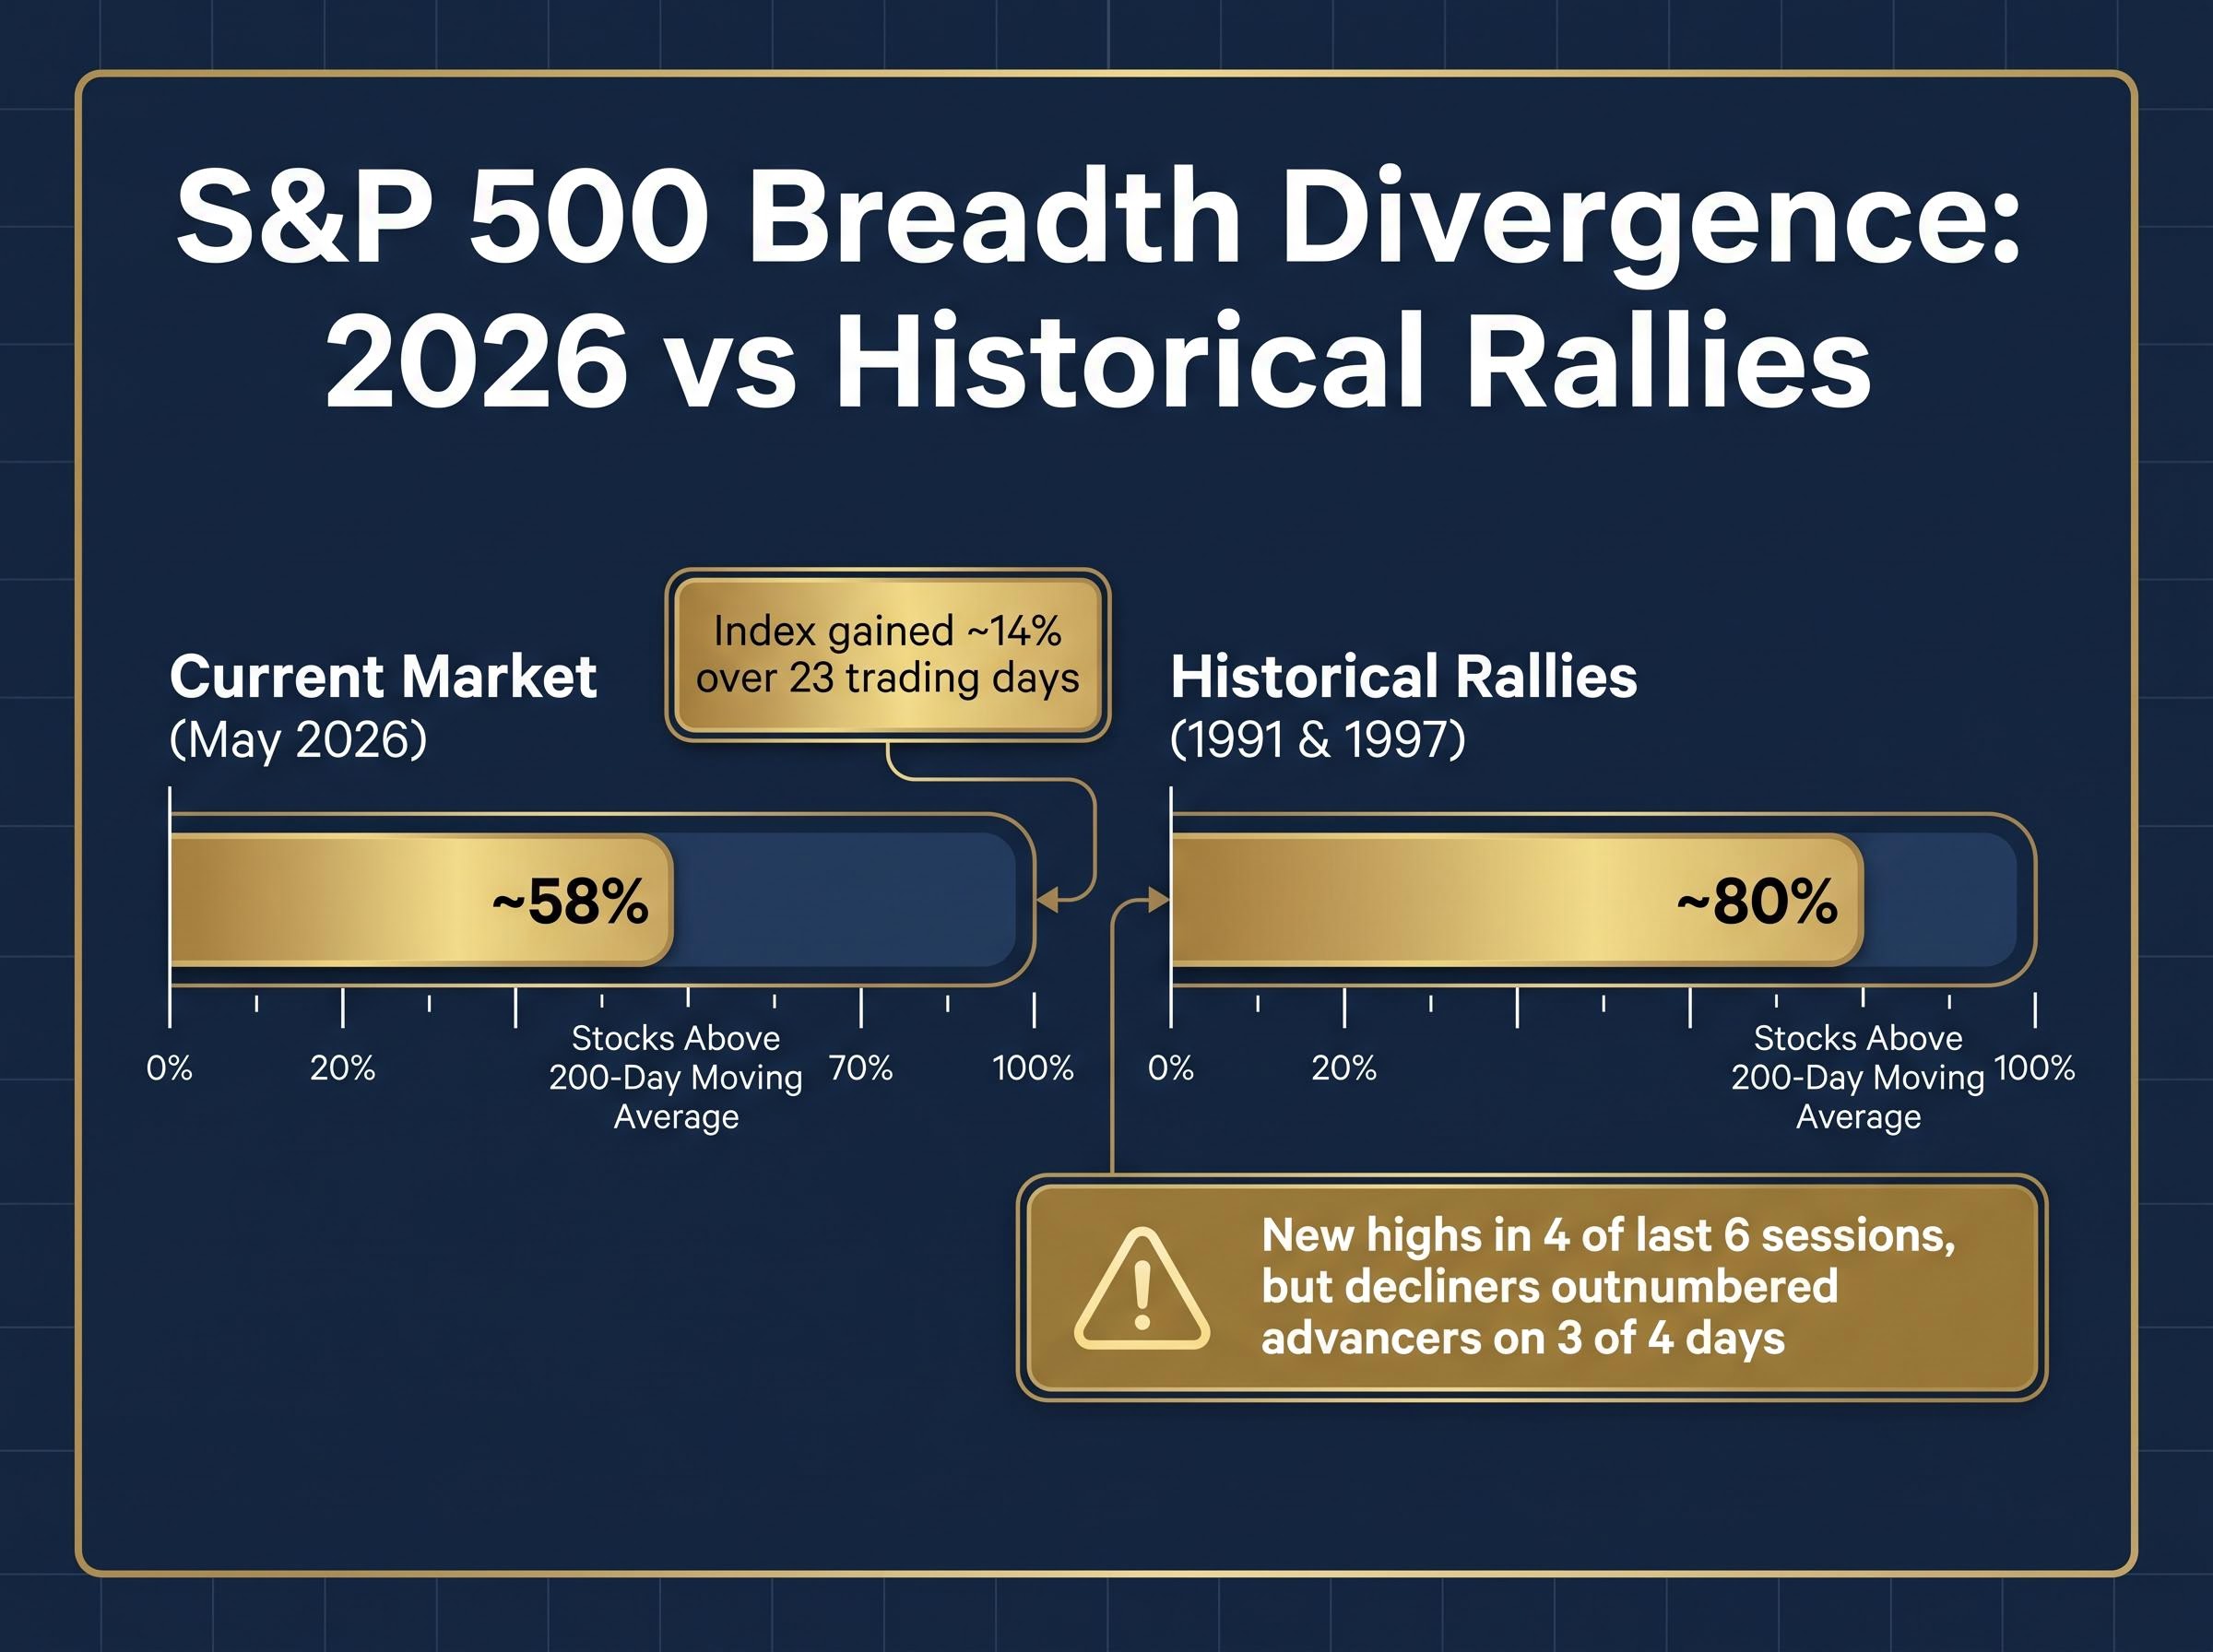
The S&P 500 has set new highs in four of the last six trading sessions, yet declining stocks outnumbered advancing stocks on three of those four days. That kind of divergence has a name: it is a breadth problem, and it is exactly the condition that makes leadership rotations worth watching closely.
Large-cap concentration has been the defining market story for several years. But as of early May 2026, two quieter signals are emerging simultaneously: the Russell 2000 breaking to all-time highs with improving internal breadth, and Chinese equity ETFs such as KWEB showing early signs of a bottoming process. These are not headline trades. They are the kind of rotations that reward investors who spot them before consensus forms.
What follows is an analysis of what the current breadth data actually signals, why the small-cap rotation has fundamental support beyond a simple rate-cut story, what the China ETF setup looks like with honest acknowledgment of its risks, and how investors can think about positioning across both themes.
The index number says one thing. The internals say something different, and the gap between them is widening.
Consider the specifics:
April 2026 produced one of the narrowest breadth readings in four decades, with only 23% of S&P 500 constituents outperforming the benchmark they compose, a data point that reinforces why the gap between cap-weighted index performance and equal-weighted internal participation has become the more meaningful signal for investors evaluating market health.
The current reading of approximately 58% of stocks above their 200-day moving average, compared to the 80% that supported prior broad rallies, is the clearest measure of how narrow the foundation beneath this index-level performance has become.
BTIG noted the S&P 500 advanced approximately 7% following a bullish technical signal, exceeding the historical four-week median of 6%. The index is doing its job. The concern is how few of its constituents are doing theirs.
Understanding breadth weakness does not require a bearish call on the market. It requires a more precise one. Index-level performance is masking a complicated internal picture, and that picture is where the opportunity sits.
The most common version of the small-cap thesis goes something like this: rates are coming down, small-caps carry more floating-rate debt, lower rates help, buy the Russell 2000. The problem is that the Federal Reserve held rates steady in April 2026, market expectations have shifted toward no cuts for the remainder of the year, and the Russell 2000 is outperforming anyway.
The Federal Reserve’s April 2026 FOMC statement confirmed the decision to hold the federal funds rate target at 3-1/2 to 3-3/4 percent, with the accompanying guidance offering no clear signal of imminent cuts, which is precisely why a small-cap thesis dependent on rate relief carries structural fragility.
The rate-cut narrative does not explain what is happening. Three other factors do.
First, valuation. Small-caps are trading at approximately 18x earnings versus the S&P 500 at approximately 22x. Second, earnings breadth is improving beyond the narrow group of mega-cap technology stocks that dominated 2024 and 2025 returns. Third, domestic revenue exposure gives smaller companies a partial insulator from the trade disruptions that are pressuring multinationals with significant China-linked supply chains.
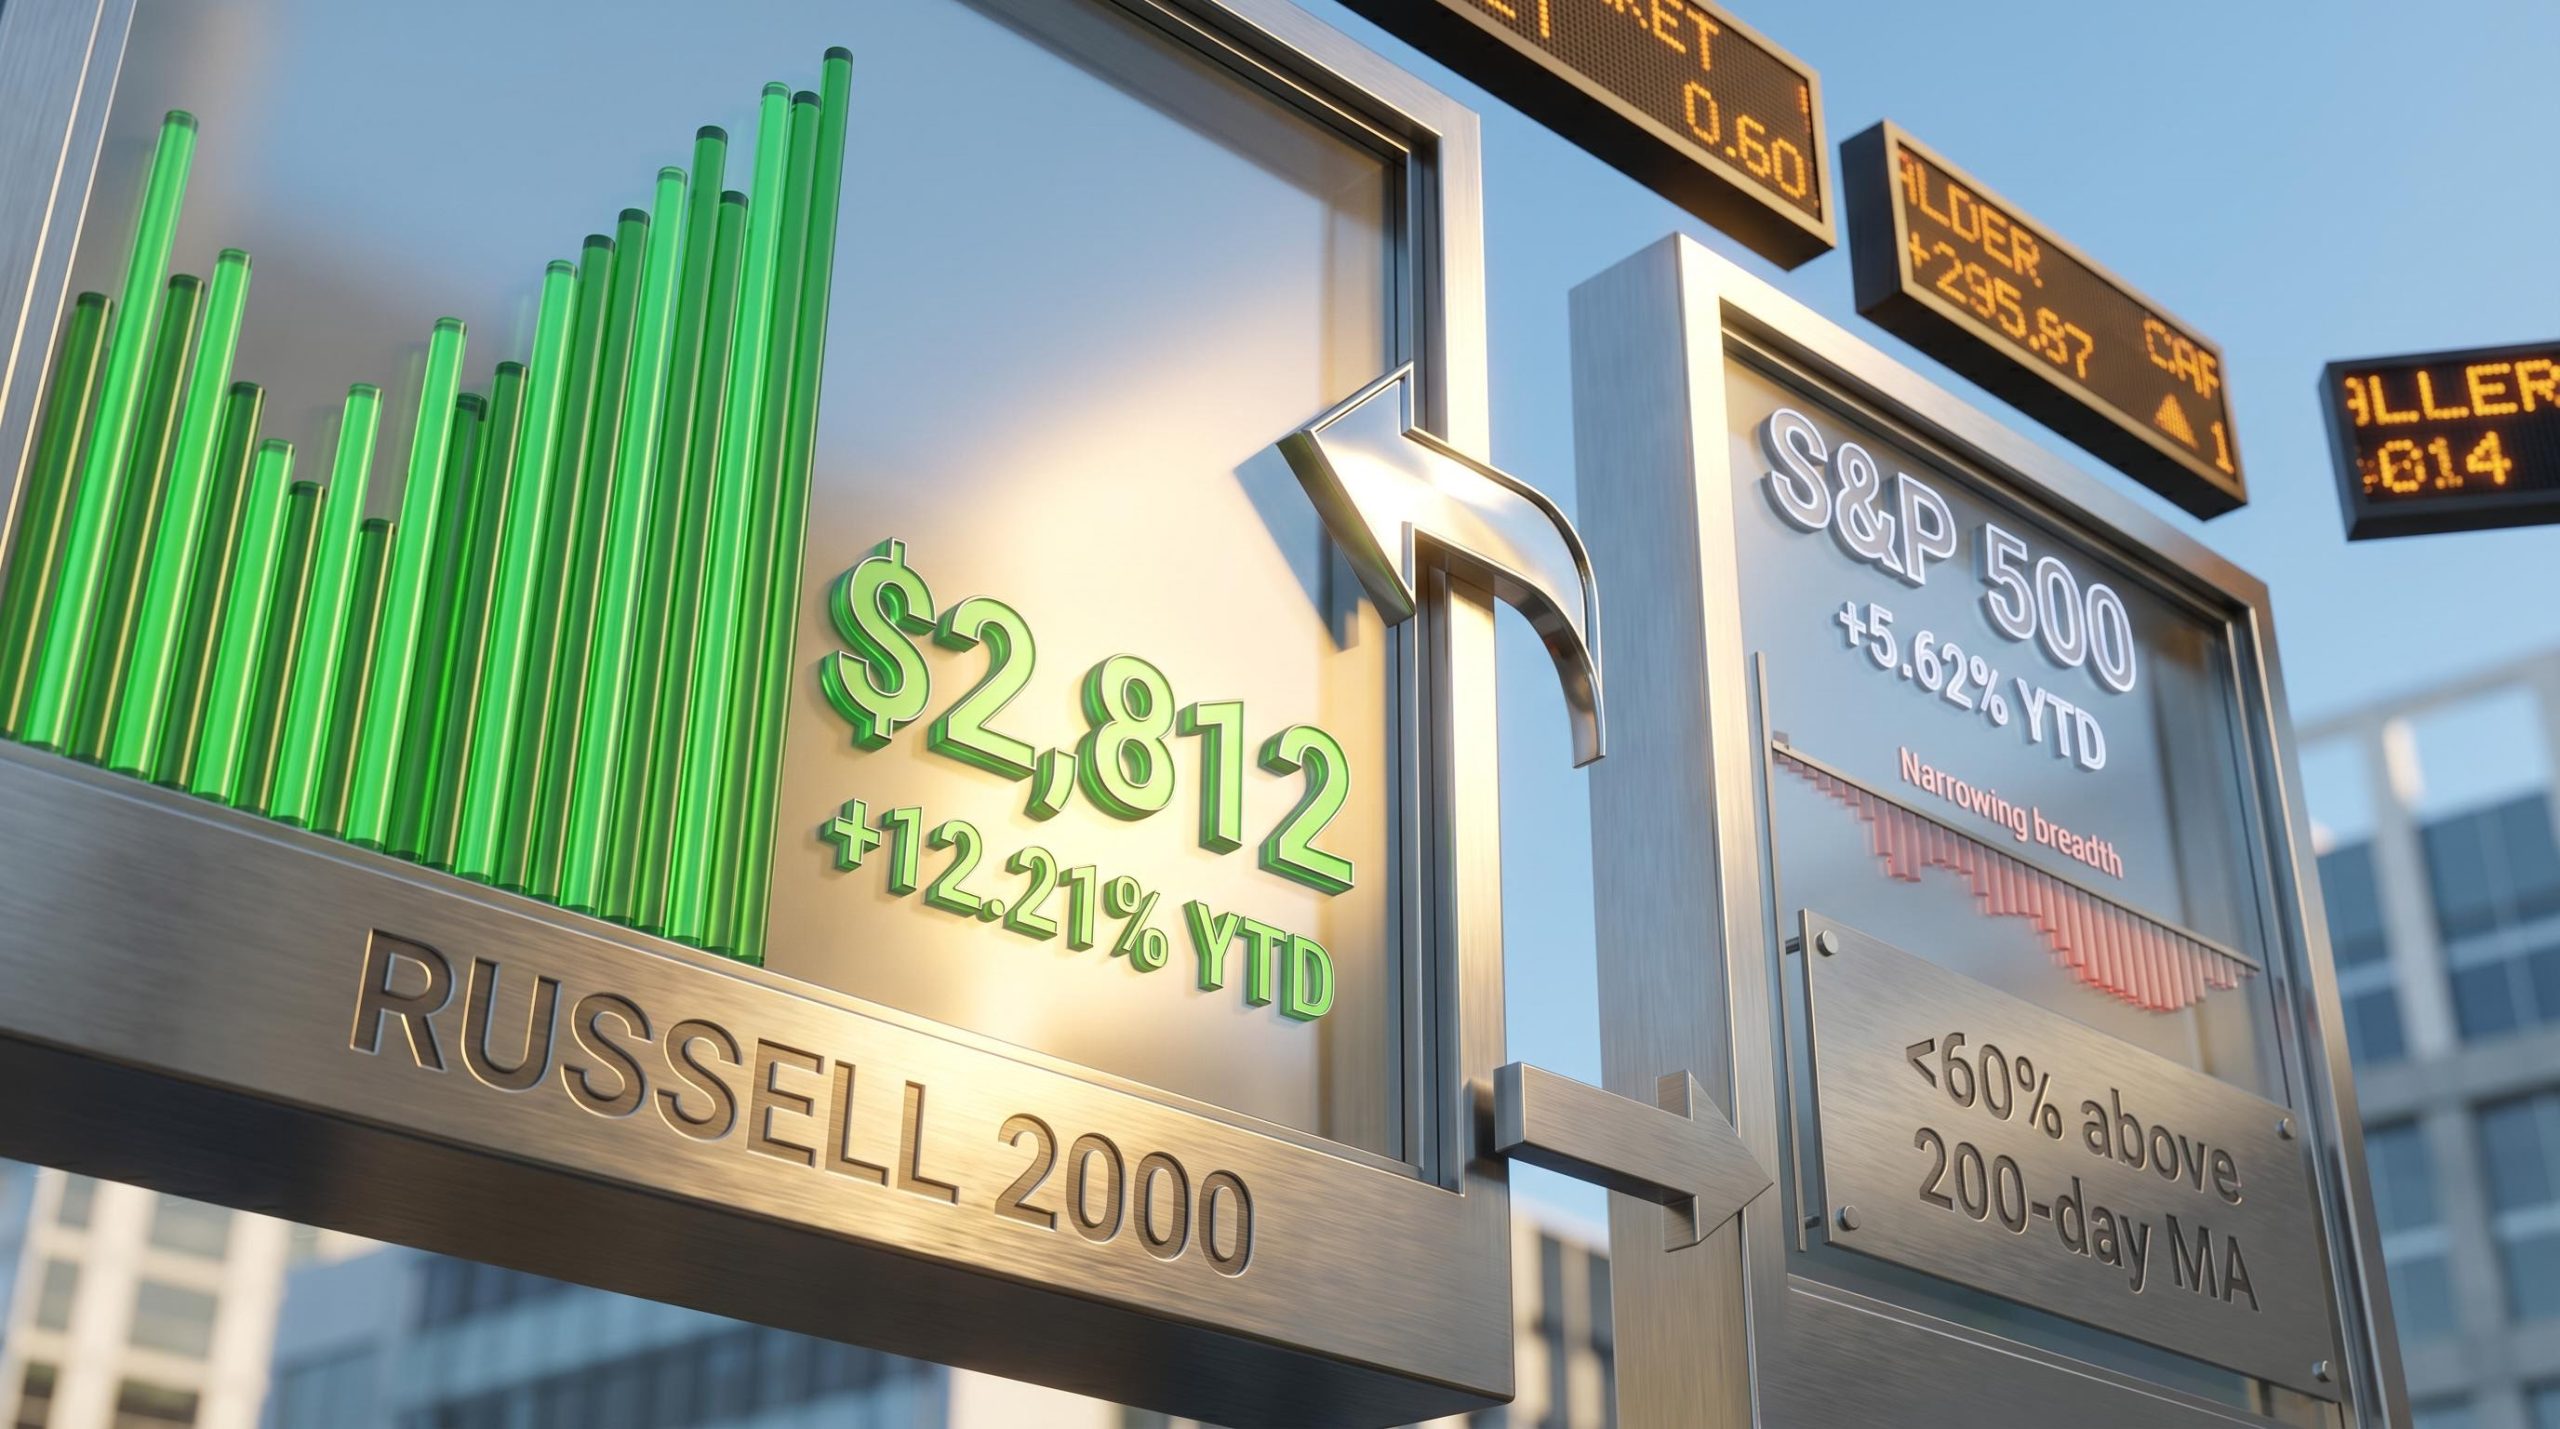
The performance gap is not marginal. Through 1 May 2026, the Russell 2000 returned approximately +12.21% year to date, compared to the S&P 500’s approximately +5.62%. The Russell 2000 closed near 2,812, trading at all-time highs.
| Metric | Russell 2000 | S&P 500 |
|---|---|---|
| YTD performance (through 1 May) | +12.21% | +5.62% |
| P/E ratio | ~18x | ~22x |
| Share of equity inflows YTD | ~25% | Remainder of flows |
The RUT-to-equal-weight-S&P-500 ratio has broken out, a technical signal BTIG analysts cited as consistent with a potential multi-year leadership shift, not merely a short-term tactical trade.
Professional money is already moving. The Bank of America Fund Manager Survey shows approximately 62% of respondents overweight small-caps. Major banks including Goldman Sachs, Morgan Stanley, JPMorgan, and BofA have recommended 10-15% portfolio shifts toward small-caps.
The Bank of America Fund Manager Survey and the associated Sell Side Indicator, sitting at 55.6% in April 2026 just 1.9 percentage points below the historical sell signal threshold, capture a market where institutional sentiment is bullish enough to support flows into small-caps while remaining sufficiently below consensus euphoria to sustain a contrarian allocation argument.
These are directional signals of where institutional capital is rotating, not buy signals on their own. Vanguard has been relatively more cautious, citing valuation grounds, a reminder that even well-supported theses carry dissent from credible voices.
The distinction matters practically. A thesis built on rate cuts collapses if the Fed holds longer than expected. A thesis built on valuation discount, earnings breadth, and domestic revenue exposure is structurally more durable and worth sizing differently.
A leadership rotation is the process by which capital migrates from an overbought, overowned segment of the market toward a neglected segment with improving fundamentals. It does not happen overnight. It shows up in a sequence of observable signals, and understanding that sequence gives investors a framework for evaluating any rotation claim, including this one.
The signals arrive in a roughly predictable order:
The ratio breakout is typically the first signal to appear, and it is the most technically precise. Years of small-cap underperformance created the conditions; the breakout confirmed the rotation had begun.
Each of these signals is visible in the current small-cap setup. That does not guarantee the rotation persists, but it does mean the setup meets the criteria that have preceded sustained leadership changes historically.
The opportunity in China ETFs is real, but so are the complications. Treating it otherwise does investors a disservice.
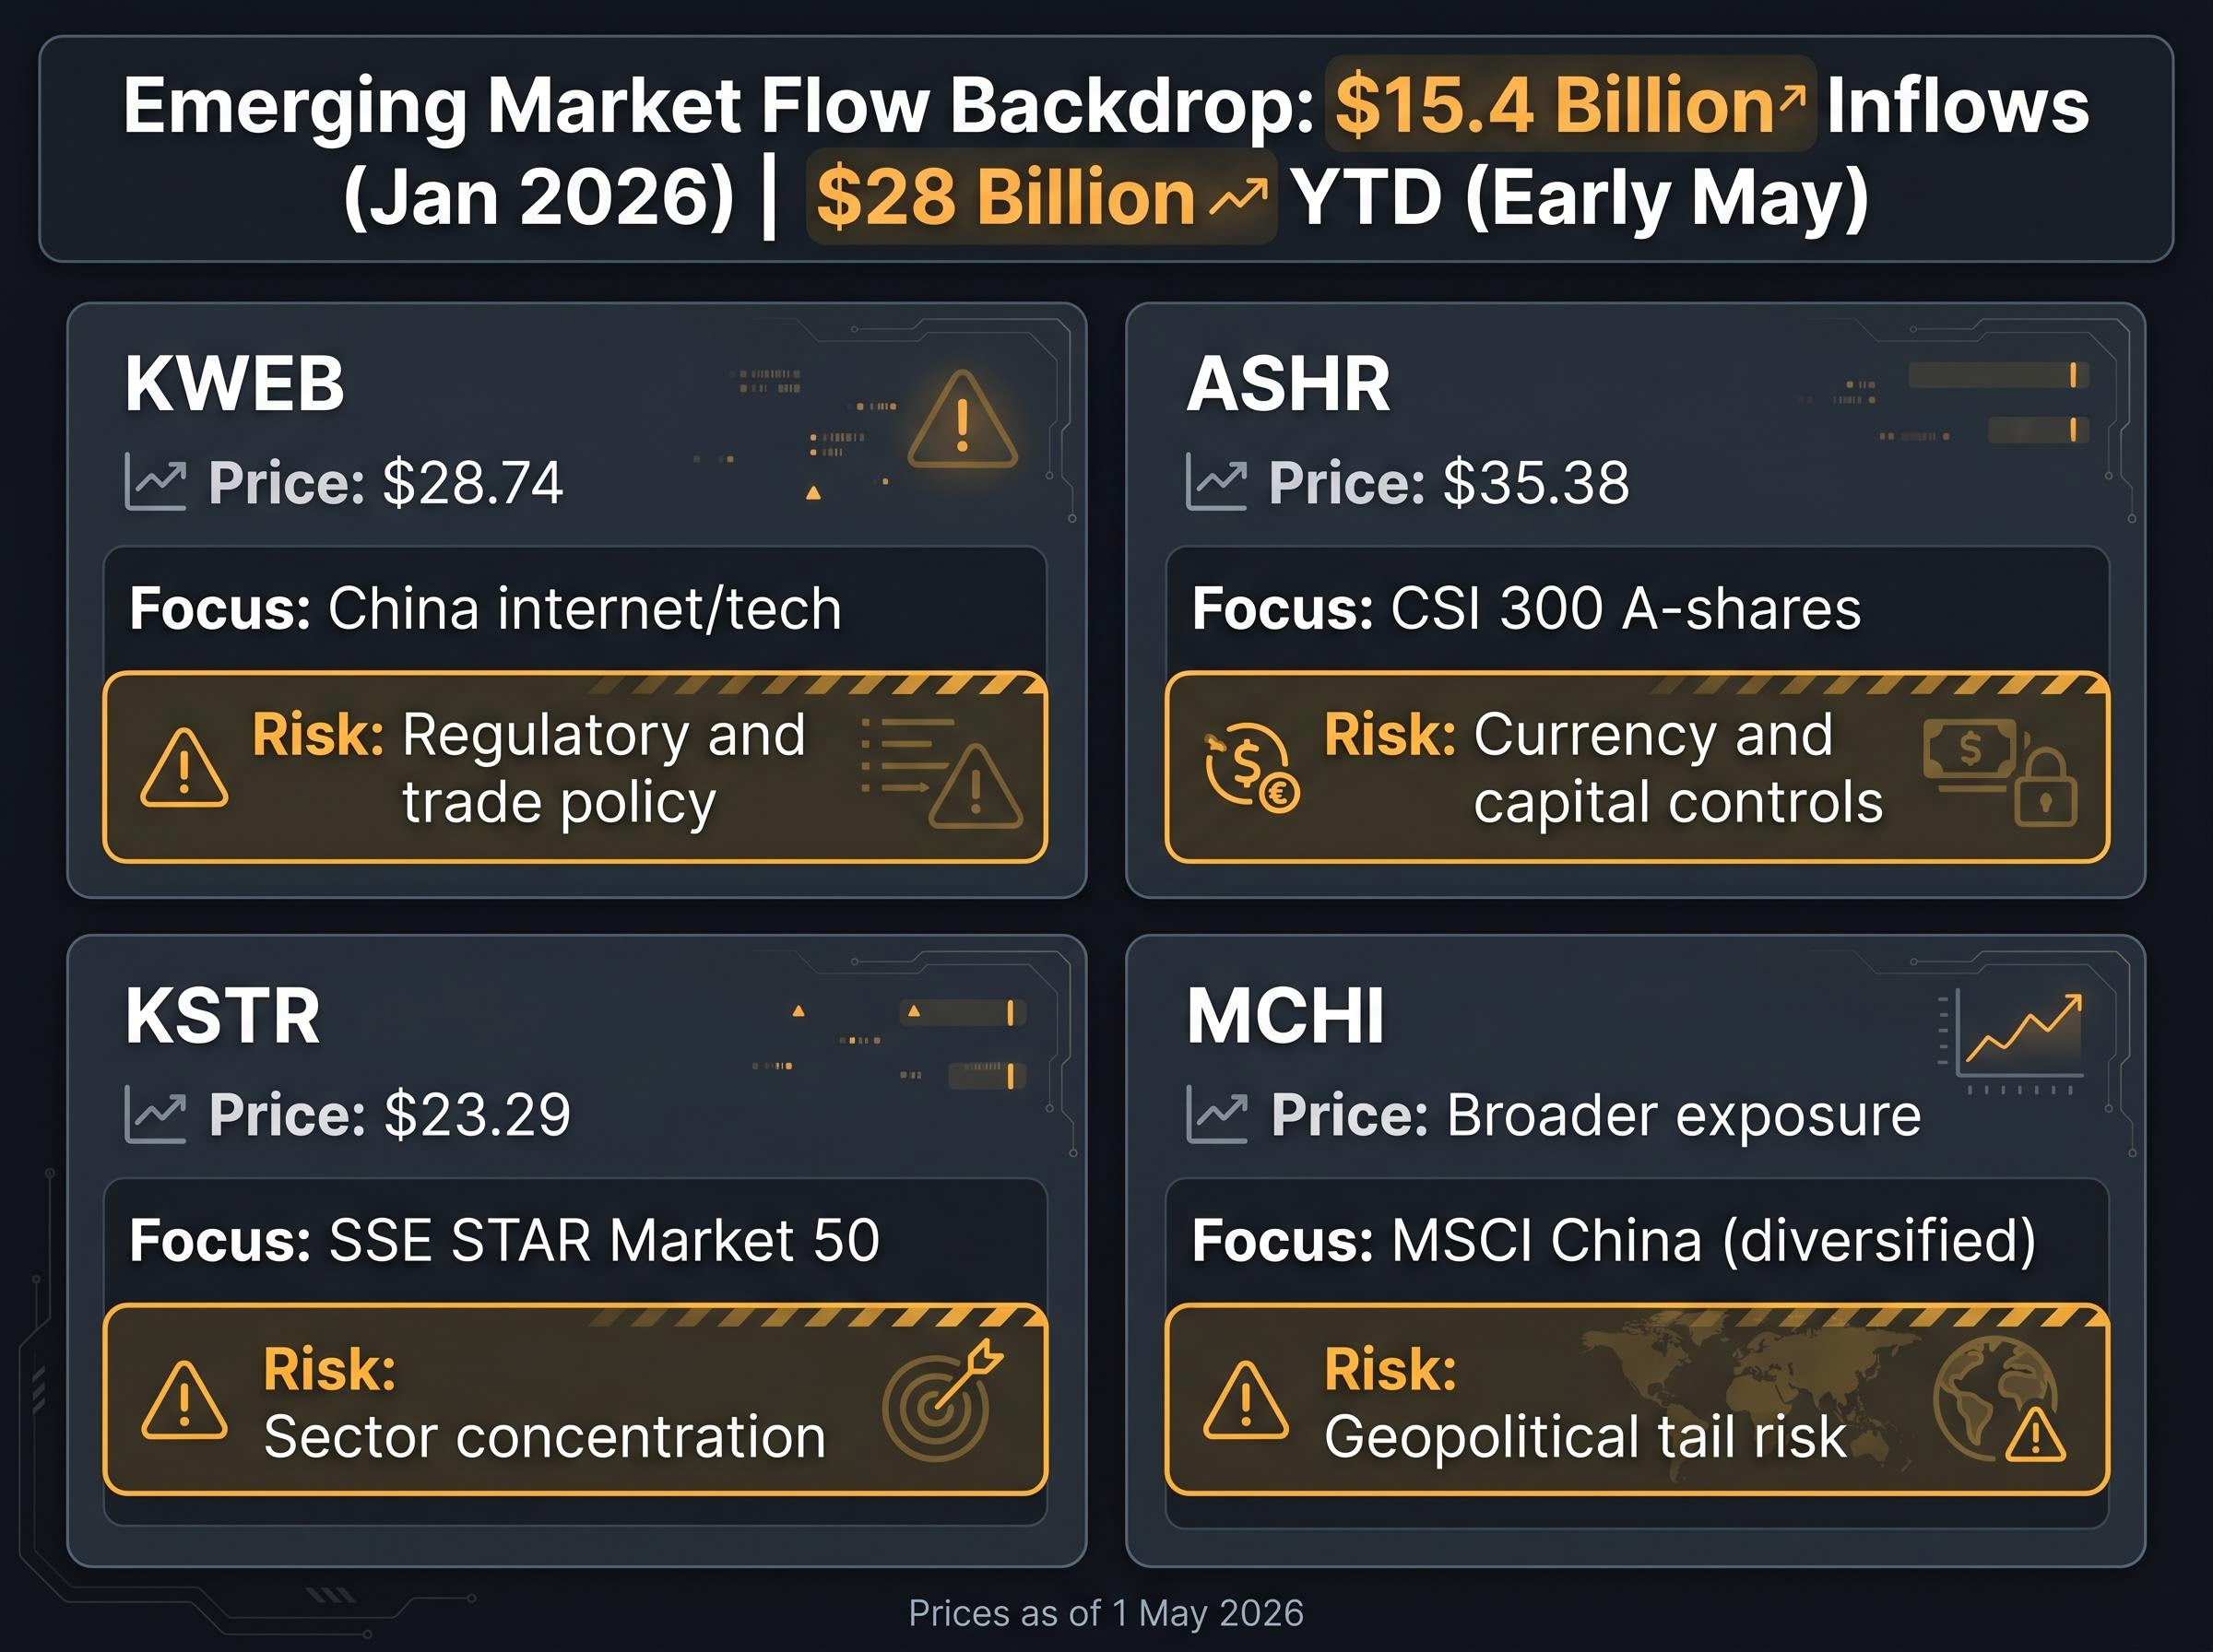
KWEB (KraneShares CSI China Internet) was trading at approximately $28.74 as of 1 May 2026. Chinese equities have shown some recovery from their 2024-2025 lows, consistent with broader emerging market inflow trends. EPFR Global data shows $15.4 billion flowing into EM funds in January 2026 alone, with year-to-date EM inflows reaching $28 billion through early May. Google Trends data showed significant spikes in KWEB searches in late April and early May, indicating rising retail interest.
| ETF | Approx. price (1 May) | Index focus | Key risk factor |
|---|---|---|---|
| KWEB | $28.74 | China internet/tech | Regulatory and trade policy |
| ASHR | $35.38 | CSI 300 A-shares | Currency and capital controls |
| KSTR | $23.29 | SSE STAR Market 50 | Sector concentration |
| MCHI | Broader exposure | MSCI China (diversified) | Geopolitical tail risk |
The catalyst environment requires honest characterisation. Several claims circulated in early research need correction:
What is supported: depressed valuations relative to historical averages, some earnings stabilisation, and a general shift from deeply bearish institutional sentiment in 2024 toward cautious neutrality. This is a call on stabilisation and mean reversion, not a structural growth reallocation.
Most rotation theses fail not because the fundamental case was wrong but because investors did not size positions appropriately for the risk profile. The risks across these two themes are different in character and require different approaches.
Structural governance risk sits beneath every China ETF position regardless of the vehicle: Chinese companies are legally required to prioritise central government directives over shareholder interests, a constraint with no direct equivalent in OECD markets that does not appear in standard fund fact sheets and that historical regulatory cycles, including the 2021-2022 internet crackdown, have periodically converted from theoretical to realised loss.
The 10 May 2026 US CPI release is the most immediate macro catalyst to monitor across both themes. A hot print could reset rate expectations and pressure risk assets broadly.
The evidence supports different conviction levels for each theme, and sizing should reflect that distinction.
The small-cap rotation carries documented support across performance data, valuation differentials, and institutional positioning. For investors considering implementation, several ETF vehicles offer different approaches to the same thesis:
| Fund | Index tracked | Differentiating feature |
|---|---|---|
| IWM | Russell 2000 | Broadest small-cap exposure, highest liquidity |
| VTWO | Russell 2000 | Vanguard cost structure |
| SLY | S&P 600 | Quality screen (profitability requirement) |
| IJR | S&P Small-Cap 600 | iShares platform, quality-filtered |
China ETFs warrant smaller tactical sizing given the higher risk profile and unverified catalyst environment. Broader EM alternatives such as VWO and EEM offer diluted China exposure for investors who want emerging market participation without concentrated single-country risk. Tax-advantaged accounts (IRA, 401k) may be preferable vehicles for the China ETF position, given its higher expected turnover and less predictable distribution profile.
Institutional strategist guidance of 10-15% portfolio shifts toward small-caps and approximately 5% tactical China exposure represents a directional reference, not a prescription. Individual risk tolerance and existing portfolio construction should drive actual allocations.
Confirmation signals worth monitoring, in order of priority:
The small-cap rotation has documented support in performance data, valuation differentials, and institutional positioning. The Russell 2000’s +12.21% year-to-date return against the S&P 500’s +5.62% is not noise. The fund flow shift from 8% of equity inflows in 2025 to 25% in 2026 is not noise. But much of the early discovery premium has been captured, and execution now matters more than it did at the start of the year.
The China ETF thesis is a different proposition entirely: higher risk, lower conviction, and dependent on stabilisation in a policy environment that remains genuinely unpredictable. It is a risk-aware tactical addition for investors who understand what they are buying, not a symmetric opportunity to the small-cap trade.
For investors wanting to stress-test the rotation thesis against its most challenging alternative, our full explainer on the S&P 500 melt-up scenario examines the BCA Research case for a further 27% rally to 9,200, the conditions under which latent institutional capital continues chasing large-cap momentum rather than rotating, and the specific triggers, including AI earnings guidance and Federal Reserve signalling, that separate the melt-up path from the rotation path.
The breadth data and ratio signals outlined above are worth monitoring actively. Rotations accelerate, and they also reverse. The difference between the two often shows up in the same technical signals that flagged the rotation beginning. The ETF alternatives table and confirmation signals list above serve as practical starting points for evaluating current positioning.
This article is for informational purposes only and should not be considered financial advice. Investors should conduct their own research and consult with financial professionals before making investment decisions. Past performance does not guarantee future results. Financial projections are subject to market conditions and various risk factors.
Small cap investing involves buying shares in companies with relatively low market capitalisations, typically tracked by the Russell 2000 index. In 2026, the strategy has gained renewed attention because the Russell 2000 is trading at all-time highs with a valuation discount of approximately 18x earnings versus the S&P 500 at 22x, while delivering roughly double the year-to-date return.
The Russell 2000's outperformance is driven by three factors beyond the simple rate-cut narrative: a meaningful valuation discount to large-caps, improving earnings breadth beyond mega-cap technology names, and greater domestic revenue exposure that partially insulates smaller companies from trade disruptions affecting multinationals.
A leadership rotation typically shows up in a predictable sequence: a ratio breakout in the lagging segment's relative performance line, a fund flow inflection toward that segment, improving internal breadth, and gradual valuation convergence. For small-caps in 2026, all four signals are currently visible, including the RUT-to-equal-weight-S&P-500 ratio breakout cited by BTIG analysts.
The primary risks include rate environment sensitivity, since small-caps carry more floating-rate debt and a hawkish Fed surprise could disproportionately pressure the segment; higher drawdown volatility during risk-off periods; and earnings execution risk, as the thesis depends on sustained improvement beyond large-cap growth names.
KWEB offers tactical exposure to Chinese internet and technology companies at depressed valuations relative to historical averages, but it carries material risks including geopolitical tail risk, domestic regulatory unpredictability, currency exposure, and a policy environment under the Trump administration that remains difficult to model. The article characterises it as a risk-aware tactical addition rather than a high-conviction trade.


