Is Fiserv at $47 a Value Trap or a Deep-Value Opportunity?
1 hr ago
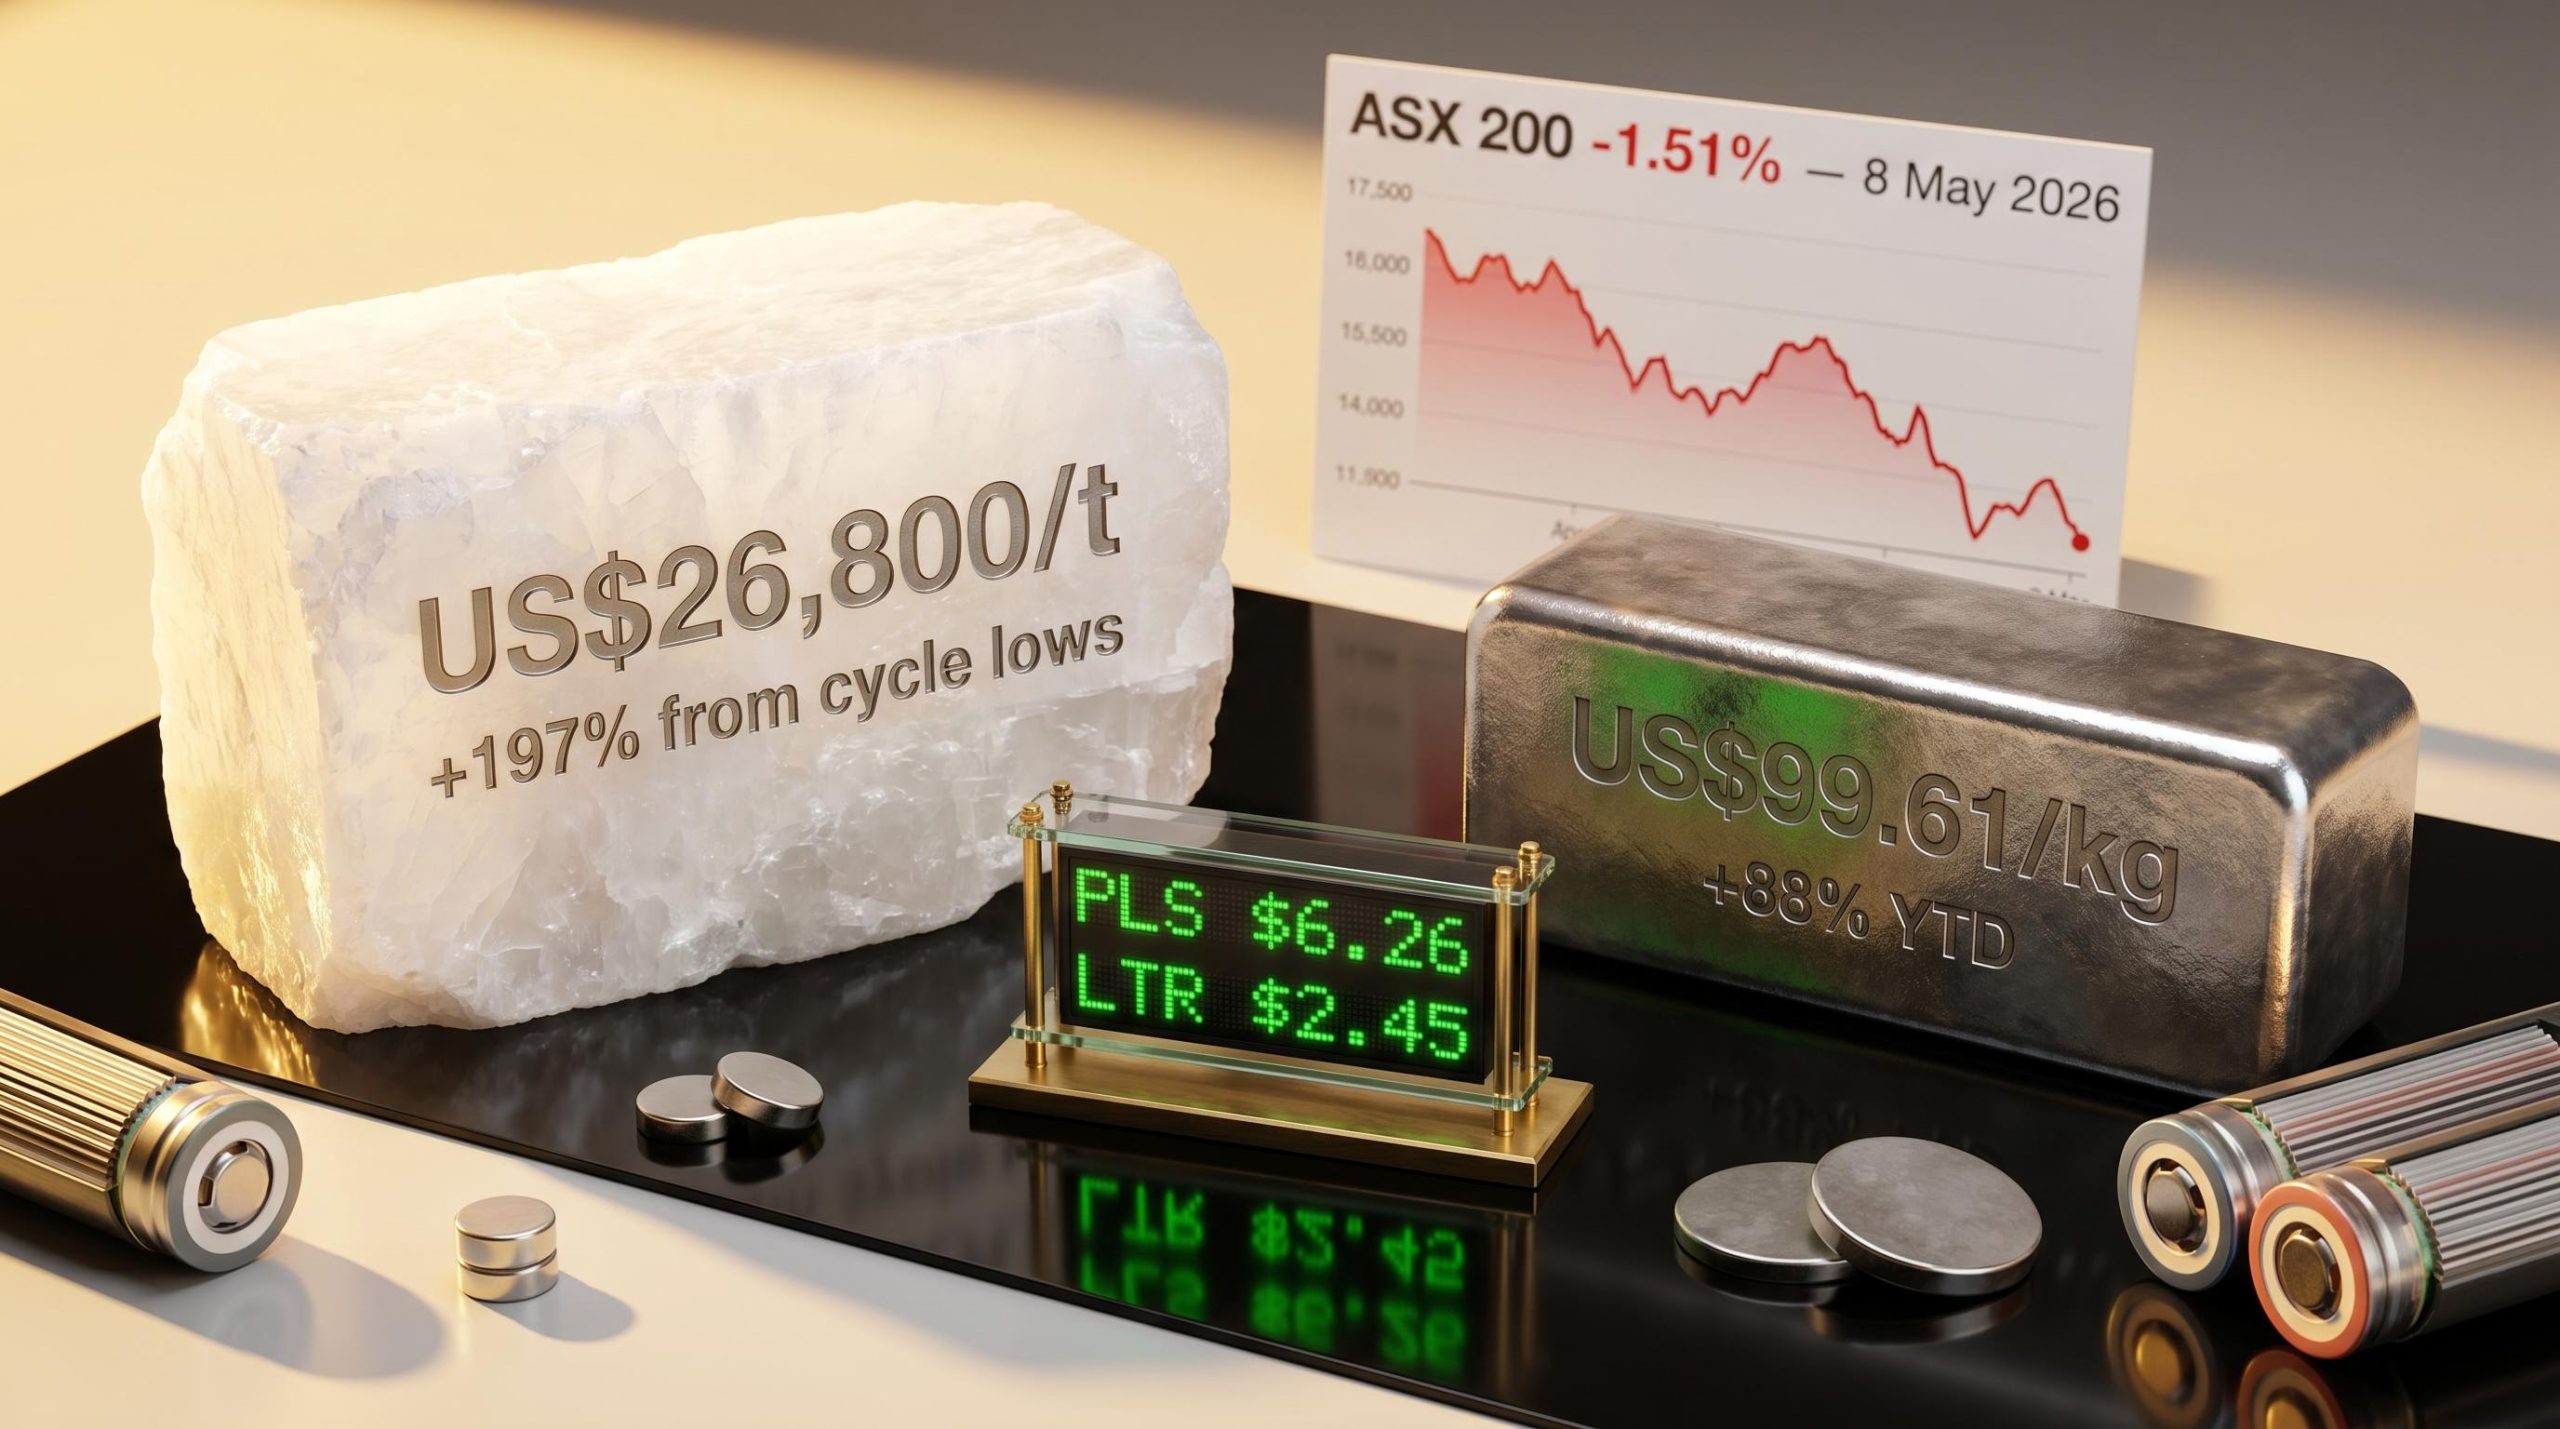
Lithium carbonate at approximately US$26,800 per tonne represents a roughly 197% recovery from its recent cycle lows. NdPr oxide, the rare earth pricing benchmark for permanent magnets, has rallied approximately 88% year-to-date to US$99.61 per kilogram as of early May 2026. Yet on 8 May, the ASX 200 fell 1.51%, dragging ASX lithium stocks and rare earths names lower in a session that had little to do with commodity fundamentals. The gap between recovering commodity prices and a cautious equity market is where the real investor question lives: is this a durable inflection for the sector, or a rally that broader market gravity will pull back down? What follows maps the commodity price recovery against the technical signals now appearing in key ASX names, explains what those signals mean in practical terms, and frames the decision between participation and patience.
The lithium bear market of 2023-2025 stripped value from nearly every producer and developer on the ASX. Lithium carbonate fell from above US$80,000 per tonne to cycle lows that few analysts had modelled. The recovery from those lows has not been modest.
Lithium carbonate has recovered approximately 197% from its cycle trough to approximately US$26,800 per tonne as of 8 May 2026, according to Trading Economics.
Lithium hydroxide, the other major lithium chemical used in battery cathode production, sits at approximately US$22,310 per tonne (LME/Fastmarkets, May 2026). That both compounds are moving higher in tandem confirms a broad-based lithium complex recovery, not a single-product anomaly.
The IEA Global EV Outlook 2025 documents the structural demand growth in EV battery deployment that underpins the lithium price recovery, noting that supply surplus conditions from 2023-2025 are gradually being absorbed as battery manufacturing capacity scales to meet projected vehicle adoption.
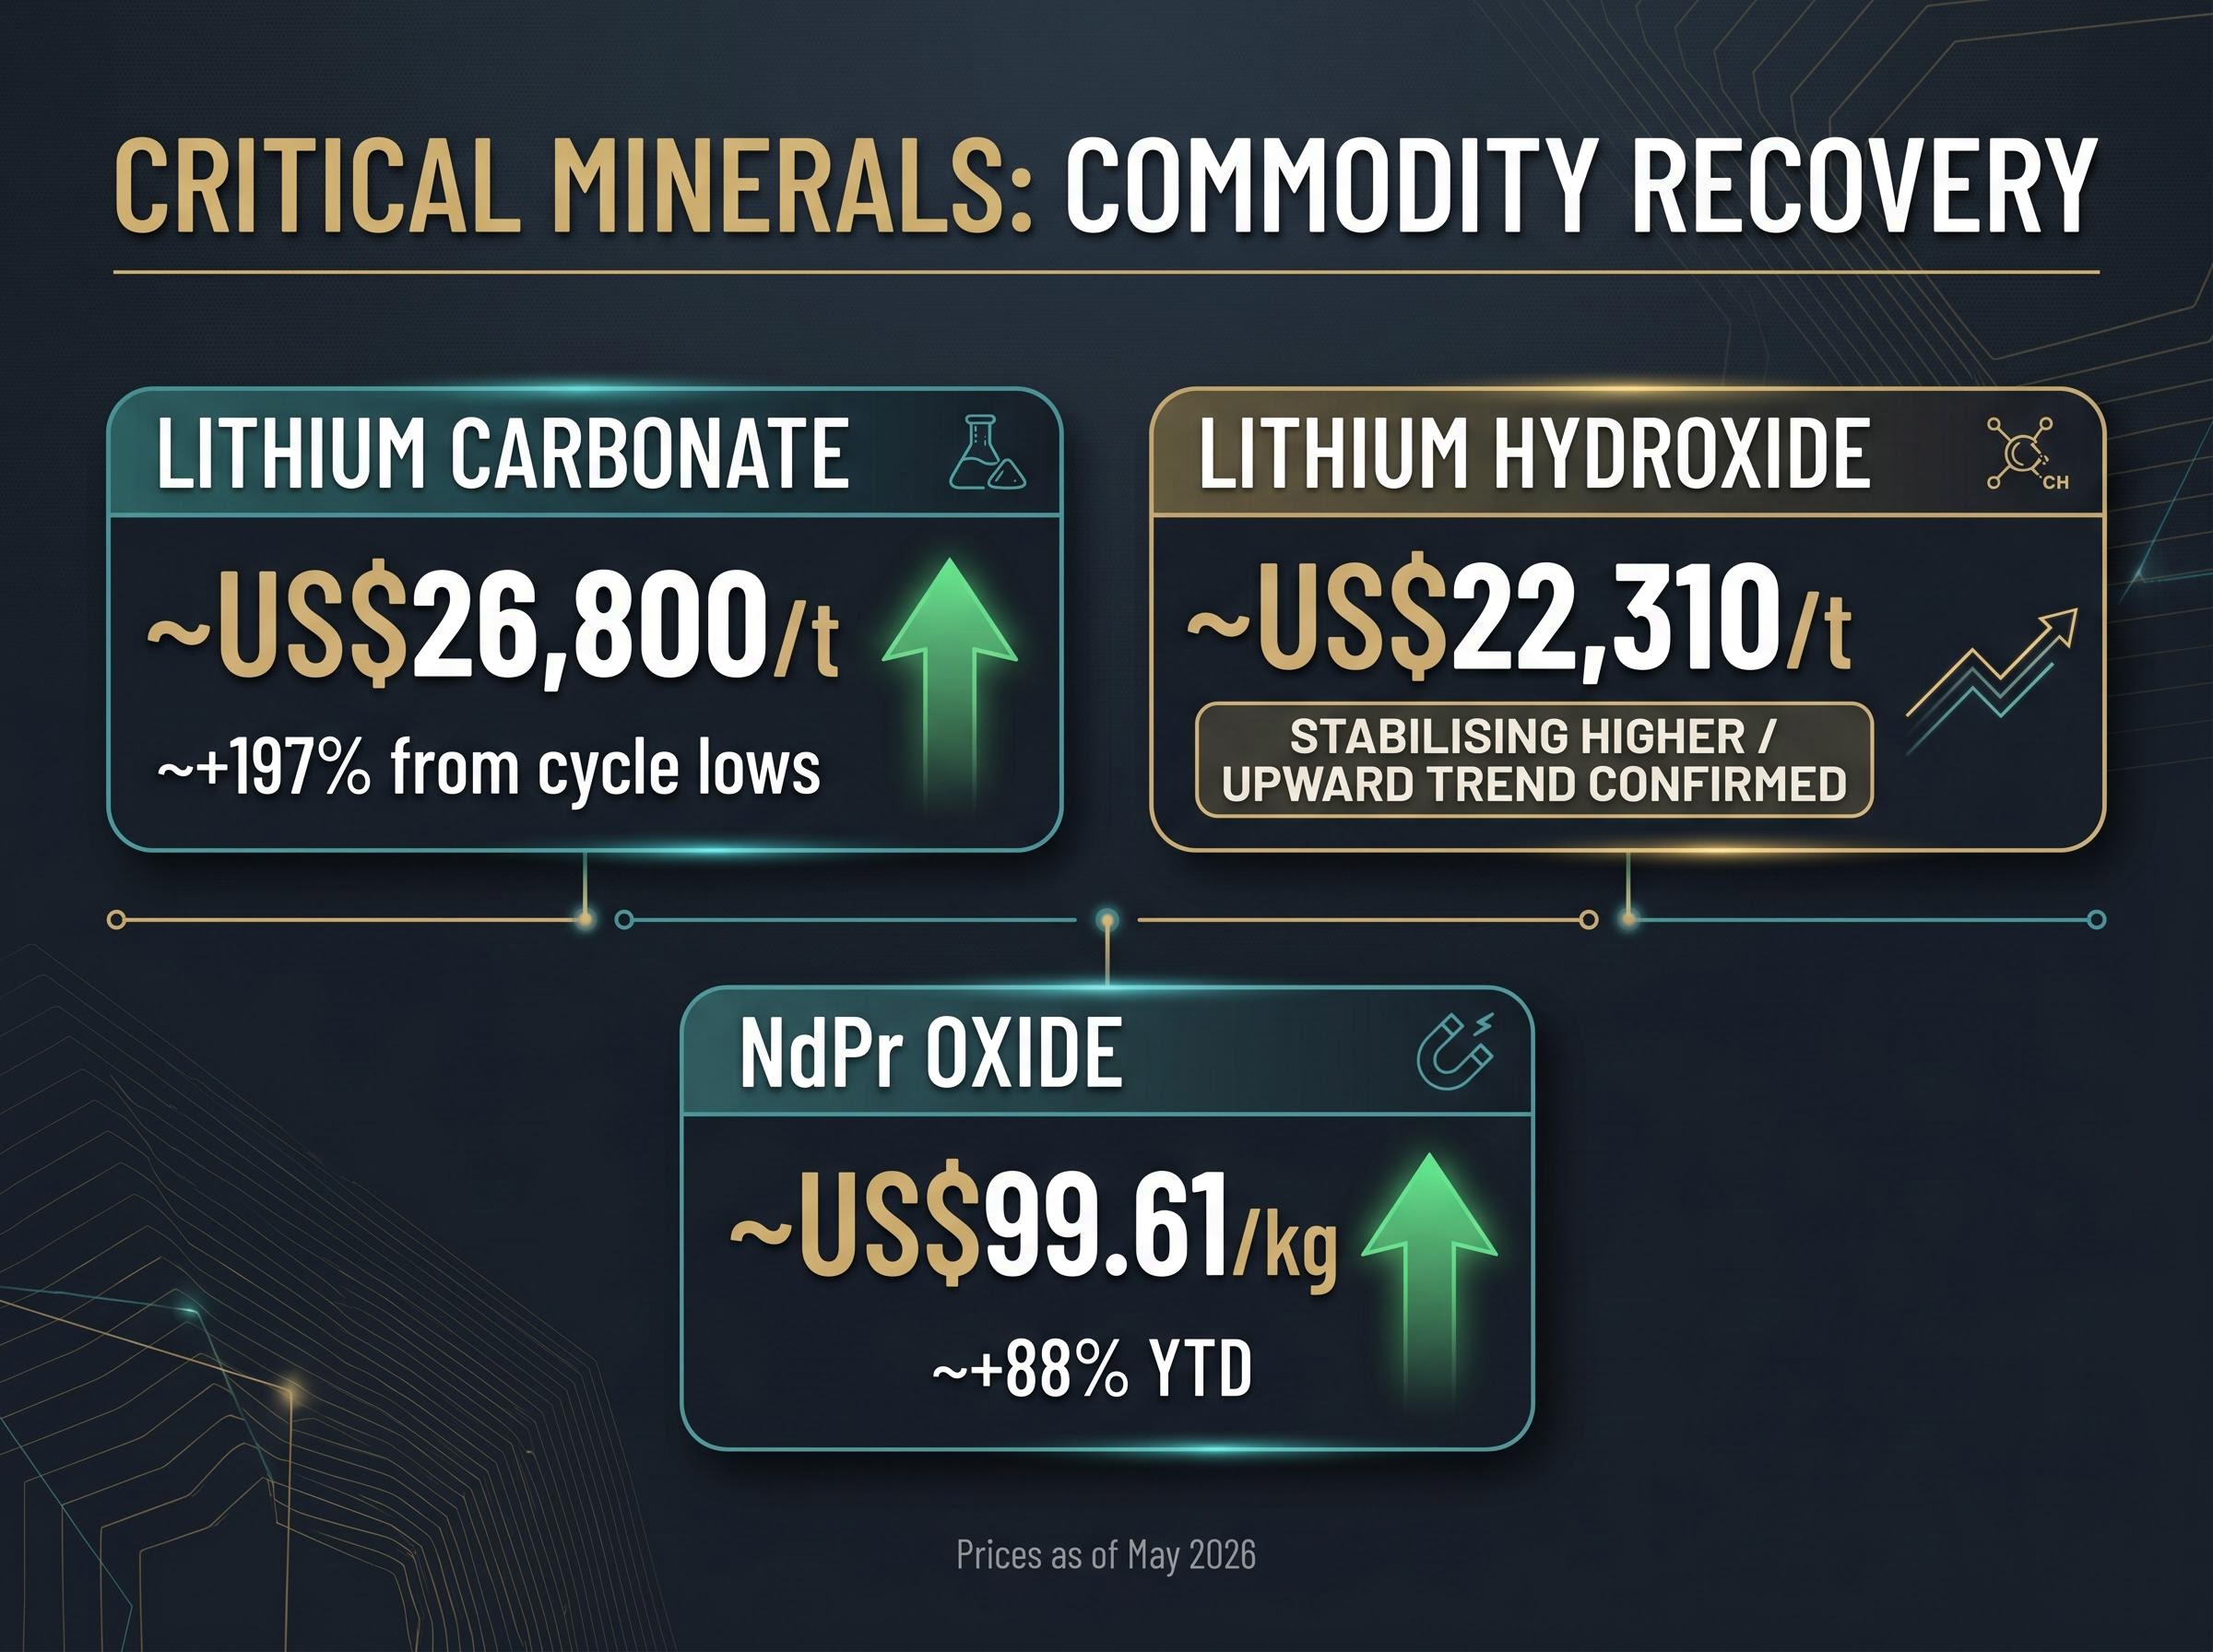
NdPr oxide, the rare earth pricing benchmark most relevant to permanent magnet demand, has added a second commodity thread to the ASX critical minerals story. Its 88% year-to-date rally to US$99.61 per kilogram reflects improving demand conditions and supply discipline from major producers.
The ASX 200’s 1.51% decline on 8 May serves as a reminder that equity markets and commodity markets do not always move in lockstep. Investors assessing ASX lithium stocks without anchoring to the commodity data beneath them risk misjudging whether share prices are running ahead of, or behind, the underlying recovery.
Clean energy investment flows into Australia recorded $12.7 billion in 2024 before a roughly 20% slump driven by grid connection bottlenecks rather than deteriorating economics, a distinction that matters for investors trying to separate temporary supply-side friction from a structural reversal in the capital cycle underpinning critical minerals demand.
| Commodity | Current price | Move from lows / YTD | Status |
|---|---|---|---|
| Lithium carbonate | ~US$26,800/t | ~+197% from cycle lows | Recovering |
| Lithium hydroxide | ~US$22,310/t | Upward trend confirmed | Stabilising higher |
| NdPr oxide | ~US$99.61/kg | ~+88% YTD | Recovering |
The commodity recovery sets the floor. Individual stock charts reveal which names have already priced in that recovery and which are still catching up.
The ChartWatch technical analysis series on Market Index, authored by Carl Capolingua across multiple editions in April and May 2026, has flagged renewed momentum in several ASX lithium names. Not all of them carry the same signal strength.
The week ending 1 May 2026 saw lithium names dominate ASX 52-week highs, with Liontown Resources, Pilbara Minerals, and Mineral Resources each reaching annual peaks even as the headline index delivered a flat return, a concentration pattern that confirms sector rotation into materials rather than a broad-based market recovery.
| Ticker | Price (AUD, 8 May) | Technical status |
|---|---|---|
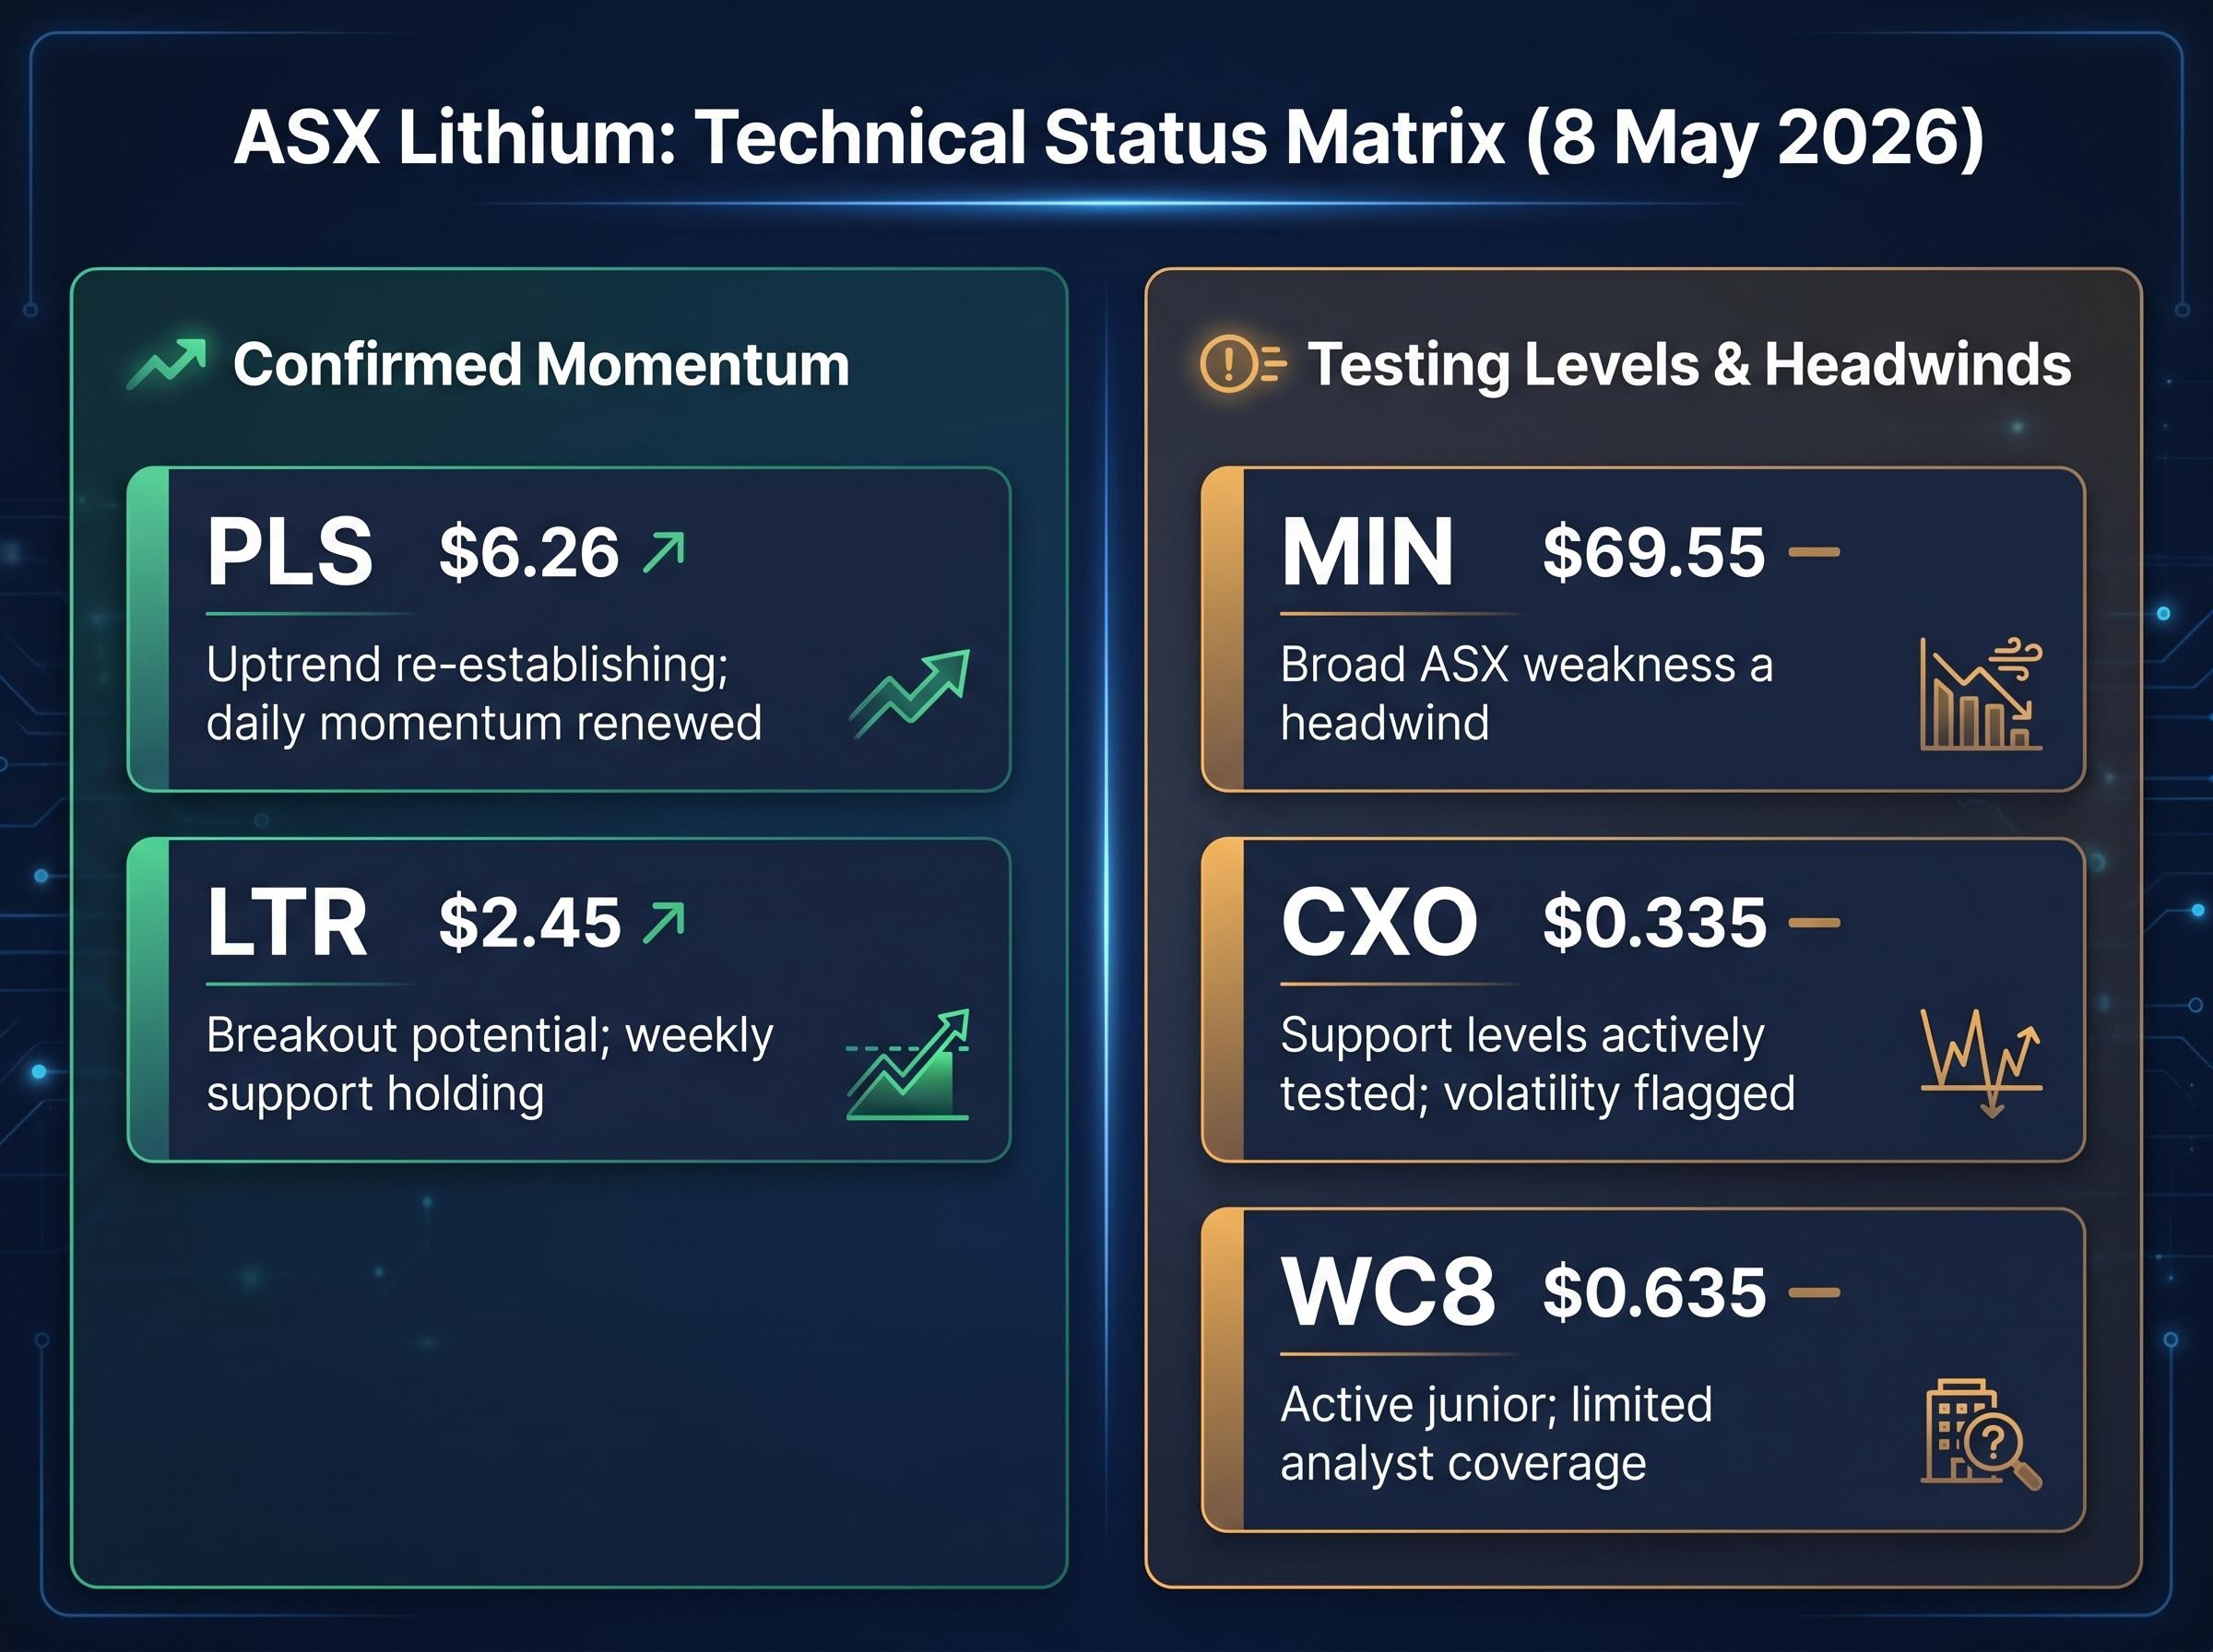
| PLS | $6.26 | Uptrend re-establishing; daily momentum renewed |
| LTR | $2.45 | Breakout potential; weekly support holding |
| MIN | $69.55 | Lithium-exposed diversified; broad ASX weakness a headwind |
| CXO | $0.335 | Support levels actively tested; volatility flagged |
| WC8 | $0.635 | Active junior; limited analyst coverage |
Pilbara Minerals (PLS) at $6.26 is the clearest momentum signal in the group. ChartWatch flagged a re-establishing uptrend on daily charts through April 2026, and the stock’s price action has continued to build on that signal. Higher trading volumes in a higher-liquidity name give the trend more statistical reliability than the same pattern in a junior stock.
Liontown Resources (LTR) at $2.45 presents breakout potential. Weekly chart support levels have held through recent sessions, and the ChartWatch series highlighted the stock as a candidate for upside continuation if lithium sentiment sustains. The weekly timeframe matters here: it filters out daily noise and focuses on whether the broader trend structure is intact.
Core Lithium (CXO) at $0.335 sits in a more fragile position. Technical reviews have noted volatility warnings, and the stock is actively testing its support levels rather than bouncing off them. When a stock “tests support,” it means the price is repeatedly approaching a level where buyers have previously stepped in. If that level fails, the next leg lower can be sharp.
Wildcat Resources (WC8) at $0.635 is an active junior with trading interest but limited analyst commentary for May 2026. For less experienced investors, the thinner liquidity in junior names like WC8 means price moves can be amplified in both directions, and the absence of broker coverage creates a wider information gap.
Before acting on the stock-level signals above, a practical question deserves a direct answer: what can technical analysis actually tell an investor?
Technical analysis identifies price momentum and trend direction based on past price action. It reads the behaviour of buyers and sellers as recorded in price and volume data. A “breakout” signal means a stock’s price has moved above a level that previously acted as a ceiling. An “uptrend re-establishing” signal means price is forming a pattern of higher lows and higher highs in a statistically consistent direction.
None of this means a stock is guaranteed to rise further. Technical signals describe what has happened and what the pattern suggests. They do not forecast commodity prices, company earnings, or government policy changes.
What technical analysis can indicate:
What technical analysis cannot indicate:
One additional consideration: technical signals in thin-liquidity junior stocks like CXO and WC8 carry more noise than the same signals in higher-volume names like PLS. The ChartWatch series, published multiple times per week across April and May 2026, provides a useful screening tool, not a substitute for fundamental analysis.
NdPr oxide has rallied approximately 88% year-to-date to US$99.61 per kilogram as of 1 May 2026, a re-rating that has reshaped the investment case for ASX rare earths producers.
That rally is driven by different forces than the lithium recovery. NdPr oxide is the primary input for permanent magnets used in electric vehicle motors and wind turbines. Its pricing is shaped by supply chain concentration (China dominates global rare earths processing), Western government diversification policy (the US Inflation Reduction Act framework incentivises non-Chinese supply), and end-use demand from the energy transition.
The ASX rare earths names most exposed to this theme each carry a different risk profile:
US critical minerals policy continues to act as a structural tailwind for Australian producers positioned as ex-China alternatives. Conflating the rare earths investment case with the lithium case, however, leads to poorly framed portfolio decisions. The supply chain dynamics, end-use demand drivers, and geopolitical leverage points differ materially between the two commodities.
Australia’s Critical Minerals Strategy, as outlined in the Parliamentary Library’s 2025-26 policy brief, designates lithium and rare earths as priority commodities eligible for targeted government funding and strategic support, reinforcing the structural policy tailwind that distinguishes Australian producers in the global supply chain.
Not every investor wants to run a multi-stock lithium portfolio. The Global X Battery Tech and Lithium ETF (ASX: ACDC) at $179.17 offers an alternative that reframes the sector opportunity as a single position.
ACDC holds globally listed battery technology and lithium names, providing exposure to the sector theme with international diversification layered in. Its assets under management of approximately $851 million (as of 4 May 2026, per Global X ETFs Australia) indicate meaningful institutional scale, not a niche product.
The trade-off is straightforward:
One administrative note: the ACDC ticker refers specifically to the Global X ETF. It should not be confused with ADC (Adcorp Australia, approximately $0.056), which is an entirely unrelated entity.
For investors drawn to the lithium and battery materials theme but lacking the time or tools for individual stock analysis, ACDC makes the decision binary: one position, diversified exposure, institutional-grade product.
The commodity supercycle debate sits directly beneath the ETF participation question: mining ETF assets under management surged 136% to $87.4 billion in the twelve months to March 2026, a capital rotation that suggests institutional positioning has already moved ahead of the retail investor conversation about whether the cycle is real.
The bullish case and the bearish case both rest on specific, verifiable data. Neither deserves more weight than the other.
| Bullish factors | Bearish factors |
|---|---|
| Li₂CO₃ ~US$26,800/t (+197% from lows) | ASX 200 fell 1.51% on 8 May; broad market headwind |
| NdPr ~US$99.61/kg (+88% YTD) | SSE Composite flat (0.00%); muted Chinese macro momentum |
| PLS and LTR showing technical uptrend signals | CXO testing support; juniors vulnerable to sharp reversals |
| Western critical minerals policy as structural tailwind | Chinese oversupply legacy remains a ceiling risk for absolute prices |
The Chinese oversupply question sits at the centre of the bearish case. Overproduction through 2023-2025 created inventory overhangs that continue to weigh on absolute price levels even as the recovery trajectory is underway. The SSE Composite’s flat session on 8 May reflects a Chinese economy that is not yet adding demand-side fuel to the commodity recovery.
Silicon anode battery technology advancing toward 530-600 mAh/g capacity targets at ASX-listed developers represents a demand-side variable that lithium price models do not always account for: higher-density anodes require different lithium input ratios than conventional graphite designs, and commercial-scale adoption timelines will shape how quickly the lithium demand curve steepens beyond current EV penetration forecasts.
Institutional flow into the ASX lithium and rare earths space is inferred from technical setups and ACDC’s $851 million AUM, but no disclosed flow quantum (specific weekly net inflows in dollar terms) has been confirmed for May 2026. That absence matters. Inferred momentum and confirmed institutional buying are not the same thing.
The question facing investors is not “up or down” but rather “what time horizon and what position size.” The commodity recovery is real. The technical signals in sector leaders are visible. The macro headwinds and junior-stock fragility are equally real. Framing the decision in terms of time horizon and position sizing, rather than a directional bet, is the more disciplined approach.
The commodity recovery in both lithium and rare earths is material and verified by multiple pricing sources. Lithium carbonate’s 197% rebound from cycle lows and NdPr oxide’s 88% year-to-date rally are not speculative; they are recorded spot prices. Equity markets, however, remain in a transitional phase where technical momentum and macro headwinds are running simultaneously on the ASX.
The ChartWatch coverage and technical signals discussed in this analysis are tools for timing and trend identification. They are not substitutes for fundamental due diligence or professional financial advice.
The structural case for Australian critical minerals producers, built on geopolitical diversification demand, Western government policy support, and EV supply chain buildout, has not changed. Whether individual stocks have priced that case in fully is the live question. Patience and position sizing discipline remain the appropriate investor posture while the market resolves the tension between commodity strength and broader equity caution.
This article is for informational purposes only and should not be considered financial advice. Investors should conduct their own research and consult with financial professionals before making investment decisions. Past performance does not guarantee future results. Financial projections are subject to market conditions and various risk factors.
NdPr oxide is a rare earth compound used as the primary input for permanent magnets in electric vehicle motors and wind turbines. Its 88% year-to-date rally to US$99.61 per kilogram as of May 2026 has reshaped the investment case for ASX rare earths producers like Lynas Rare Earths.
Lithium carbonate has recovered approximately 197% from its cycle trough, reaching around US$26,800 per tonne as of 8 May 2026, according to Trading Economics. This follows a severe bear market from 2023-2025 where prices fell from above US$80,000 per tonne.
ACDC is the Global X Battery Tech and Lithium ETF listed on the ASX, holding globally listed battery technology and lithium names with approximately $851 million in assets under management as of May 2026. It offers diversified exposure to the battery materials theme without requiring individual stock selection.
When a stock is testing support, its price is repeatedly approaching a level where buyers have previously stepped in to prevent further declines. If that support level fails, the next move lower can be sharp, which is why Core Lithium (CXO) testing support in May 2026 was flagged as a fragility signal.
While the ASX 200 fell 1.51% on 8 May 2026, sector leaders like Pilbara Minerals and Liontown Resources had been showing technical uptrend signals through April and early May, reflecting sector rotation into materials rather than a broad-based market recovery.