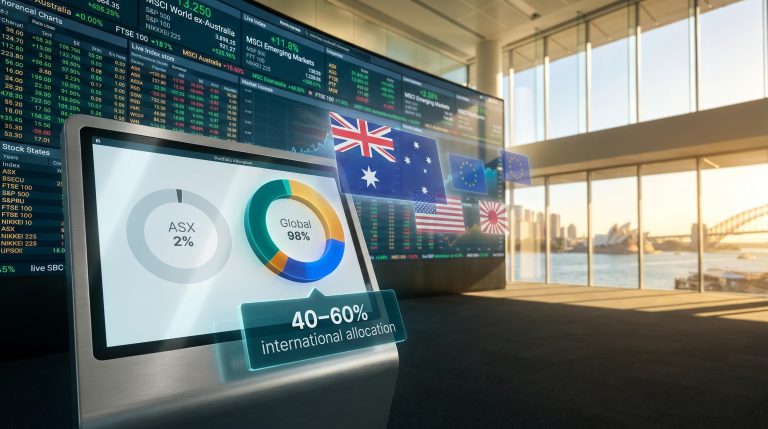
How to Invest in International Shares From Australia
4 hrs ago
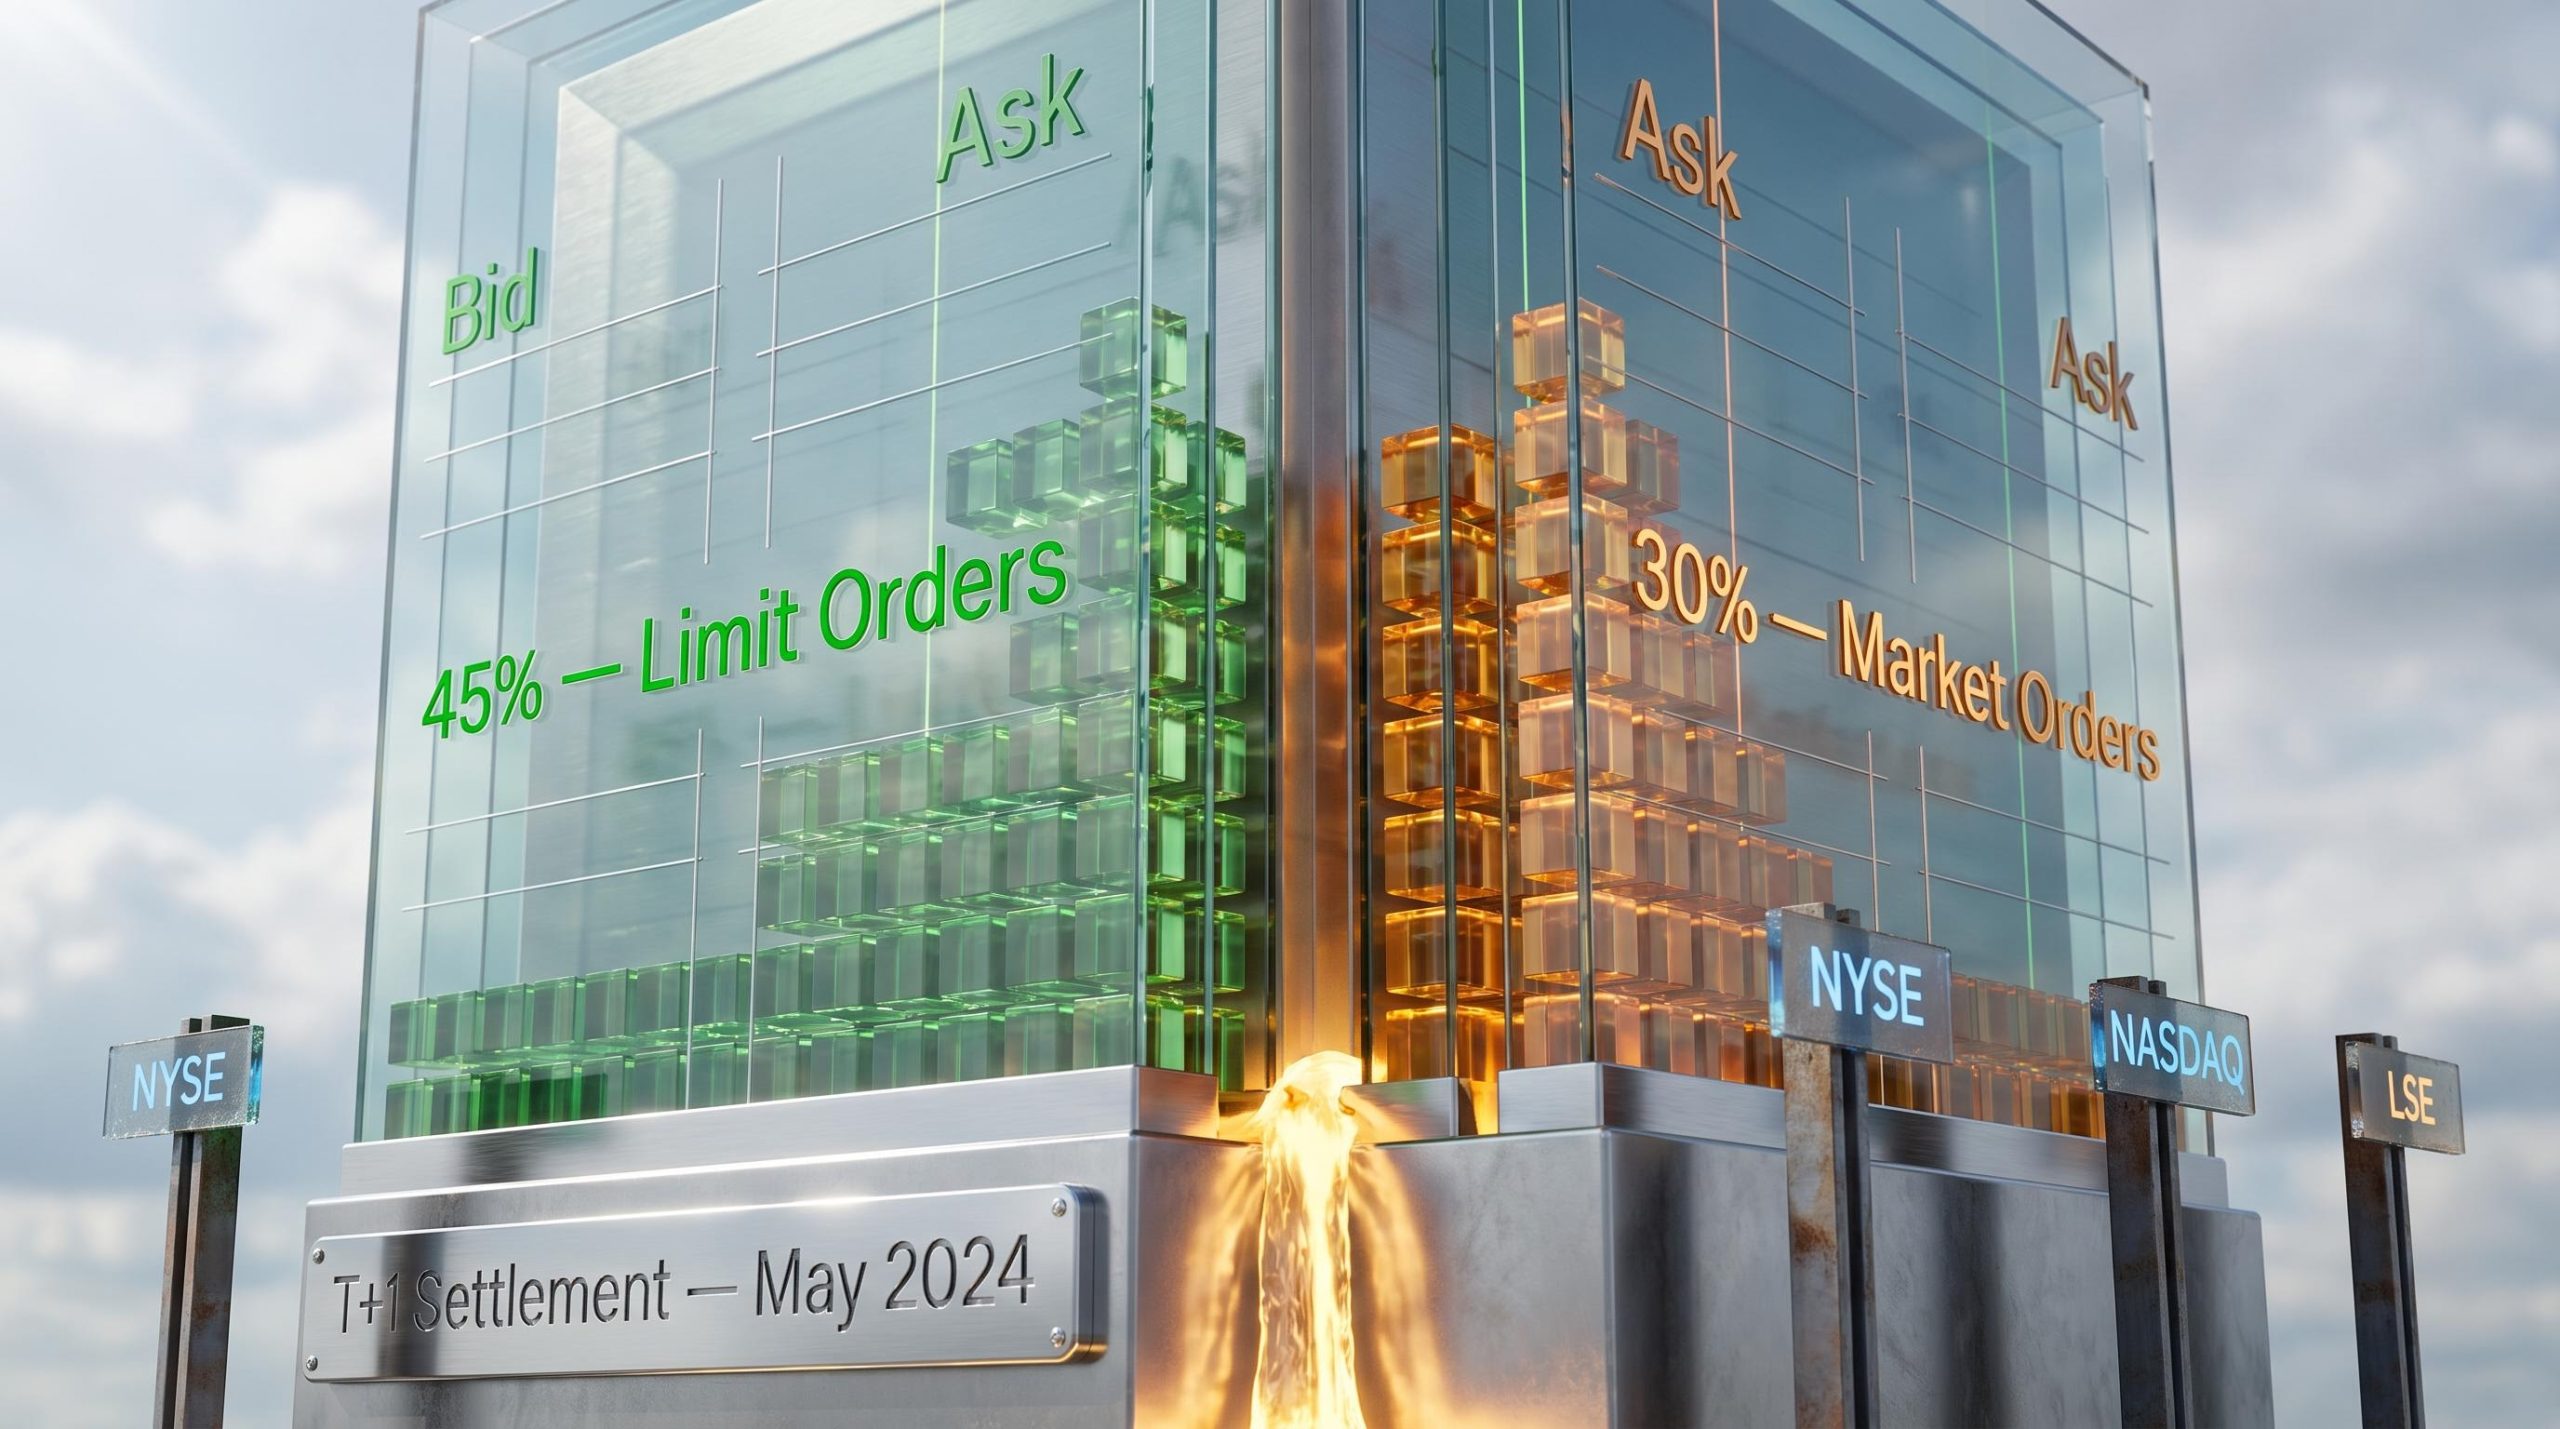
Most people assume completed trades set stock prices. Research from Brogaard, Hendershott, and Riordan tells a different story: limit orders sitting passively in the order book contribute roughly 45% to price discovery before a single trade executes. The remaining 30% comes from market orders, with cancellations and other activity accounting for the rest.
Millions of investors place buy and sell orders every day without a clear picture of what happens between tapping “buy” and seeing shares in their account. Understanding how the stock market works is not just academic; it changes how investors interpret price movements, execution quality, and market behaviour during volatile sessions. What follows is the full mechanical loop: how markets are structured, how orders find their match, how prices are continuously negotiated, and who the real participants are. By the end, readers will have a concrete mental model they can apply every time they place a trade.
The market most investors interact with daily is actually the second layer of a two-part system. Recognising which tier a transaction belongs to clarifies why prices behave the way they do, particularly on days when a company releases no news at all.
The first tier is the primary market. When a company issues new shares to the public, typically through an Initial Public Offering (IPO), it is raising capital directly. The company sets the offering price in consultation with underwriters, and proceeds flow to the business itself.
The second tier, the secondary market, is where the vast majority of daily trading takes place. Here, existing shares change hands between investors. The company receives nothing from these transactions. Prices on the secondary market are set entirely by supply and demand among participants, not by the issuing company.
Major global exchanges facilitate this secondary trading: the NYSE and NASDAQ in the United States, the London Stock Exchange (LSE) in the United Kingdom, and the Tokyo Stock Exchange in Japan. Each operates its own rules, but all serve the same structural purpose.
| Feature | Primary Market | Secondary Market |
|---|---|---|
| Definition | Companies issue new shares to raise capital | Investors trade existing shares among themselves |
| Who participates | Issuing company, underwriters, initial investors | Individual and institutional investors |
| How price is set | Offering price determined by company and underwriters | Continuous supply and demand between buyers and sellers |
Investors who understand this distinction are better equipped to interpret why a stock moves on a quiet news day. Secondary market prices reflect what participants believe a share is worth right now, not what the company declared it to be worth at issuance.
The instant an investor taps “buy” on a brokerage app, an invisible sequence begins. The broker, acting as an intermediary, routes the order to an exchange or electronic network. What happens next depends almost entirely on which order type was chosen.
A market order prioritises speed. It executes immediately at the best available price, which means the investor gets certainty of execution but not certainty of price. In a fast-moving session, the price paid may differ from the price displayed at the moment the button was pressed.
A limit order prioritises cost control. It will only execute if the market reaches the investor’s specified price. This gives precision, but carries the risk of the order never filling if the market moves the other way.
Key characteristics of each:
Commission-free trading became the industry standard in 2019, lowering the cost of participation substantially. The underlying mechanics, however, remain unchanged. Global regulators overseeing this system include the SEC (US), FCA (UK), ESMA (EU), and ASIC (Australia).
Limit orders contribute approximately 45% to price discovery even before a trade executes, according to research from Brogaard, Hendershott, and Riordan (2019). The price an investor sees on screen is shaped by these passive orders sitting in the order book, a concept explored in detail below.
Choosing the wrong order type in a fast-moving market can mean paying significantly more than expected or missing a trade entirely. This decision is one of the few points where individual investors exercise direct control over execution quality.
Behind every executed trade is an algorithm following transparent rules. The “market” is not a chaotic free-for-all; it is a precisely ordered queue.
The dominant matching logic on most electronic exchanges is Price-Time, also known as First In, First Out (FIFO). The sequence works as follows:
The alternative is Pro-Rata matching. Under this system, orders at the same price are filled proportionally based on their size rather than when they arrived. A larger order receives a proportionally larger fill. This approach is more common in derivatives markets than equity exchanges.
Not all exchanges apply these rules identically. The NYSE operates a hybrid model that combines electronic order books with Designated Market Makers (DMMs). During high-uncertainty moments, such as IPO openings, DMMs inject real-time price points to gauge supply and demand on the floor, providing a human-assisted layer to the auction process.
The Shell Midstream Partners (SHLX) IPO illustrates the difference. SHLX opened at $32.00, a nearly 40% premium to its offering price. According to NYSE analysis, the DMM-assisted opening process produced results that were 37% less volatile on average compared to NASDAQ listing-day openings.
NYSE’s hybrid model, where DMMs provide real-time floor input during auctions, produced openings 37% less volatile on average than NASDAQ listing-day openings.
NASDAQ, by contrast, operates on a predominantly algorithmic basis. Its matching engine is continuously refined: on 9 January 2026, NASDAQ issued Options Regulatory Alert ORA2026-4, prohibiting “options shredding,” a practice where traders broke up orders to exploit price-improvement auctions for higher allocation. The rule change reflects how matching systems are actively updated to address emerging manipulation tactics.
The practical implication: the same order placed at different exchanges, or at open versus midday, can behave very differently depending on which matching rules govern it.
The most common assumption among new investors is that prices are set by completed trades. A buyer and seller agree, a trade prints, and the price updates. This is only part of the story, and not even the largest part.
Price discovery is the continuous process by which markets converge on a security’s fair value. It happens through the interaction of three inputs:
Research from Brogaard, Hendershott, and Riordan (2019), studying Canadian equity markets, measured these contributions directly.
Brogaard, Hendershott, and Riordan’s Journal of Finance research establishes that high-frequency traders submit the bulk of limit orders and that these passive orders drive the majority of price discovery, with market orders playing a secondary role despite being the more visible transaction type.
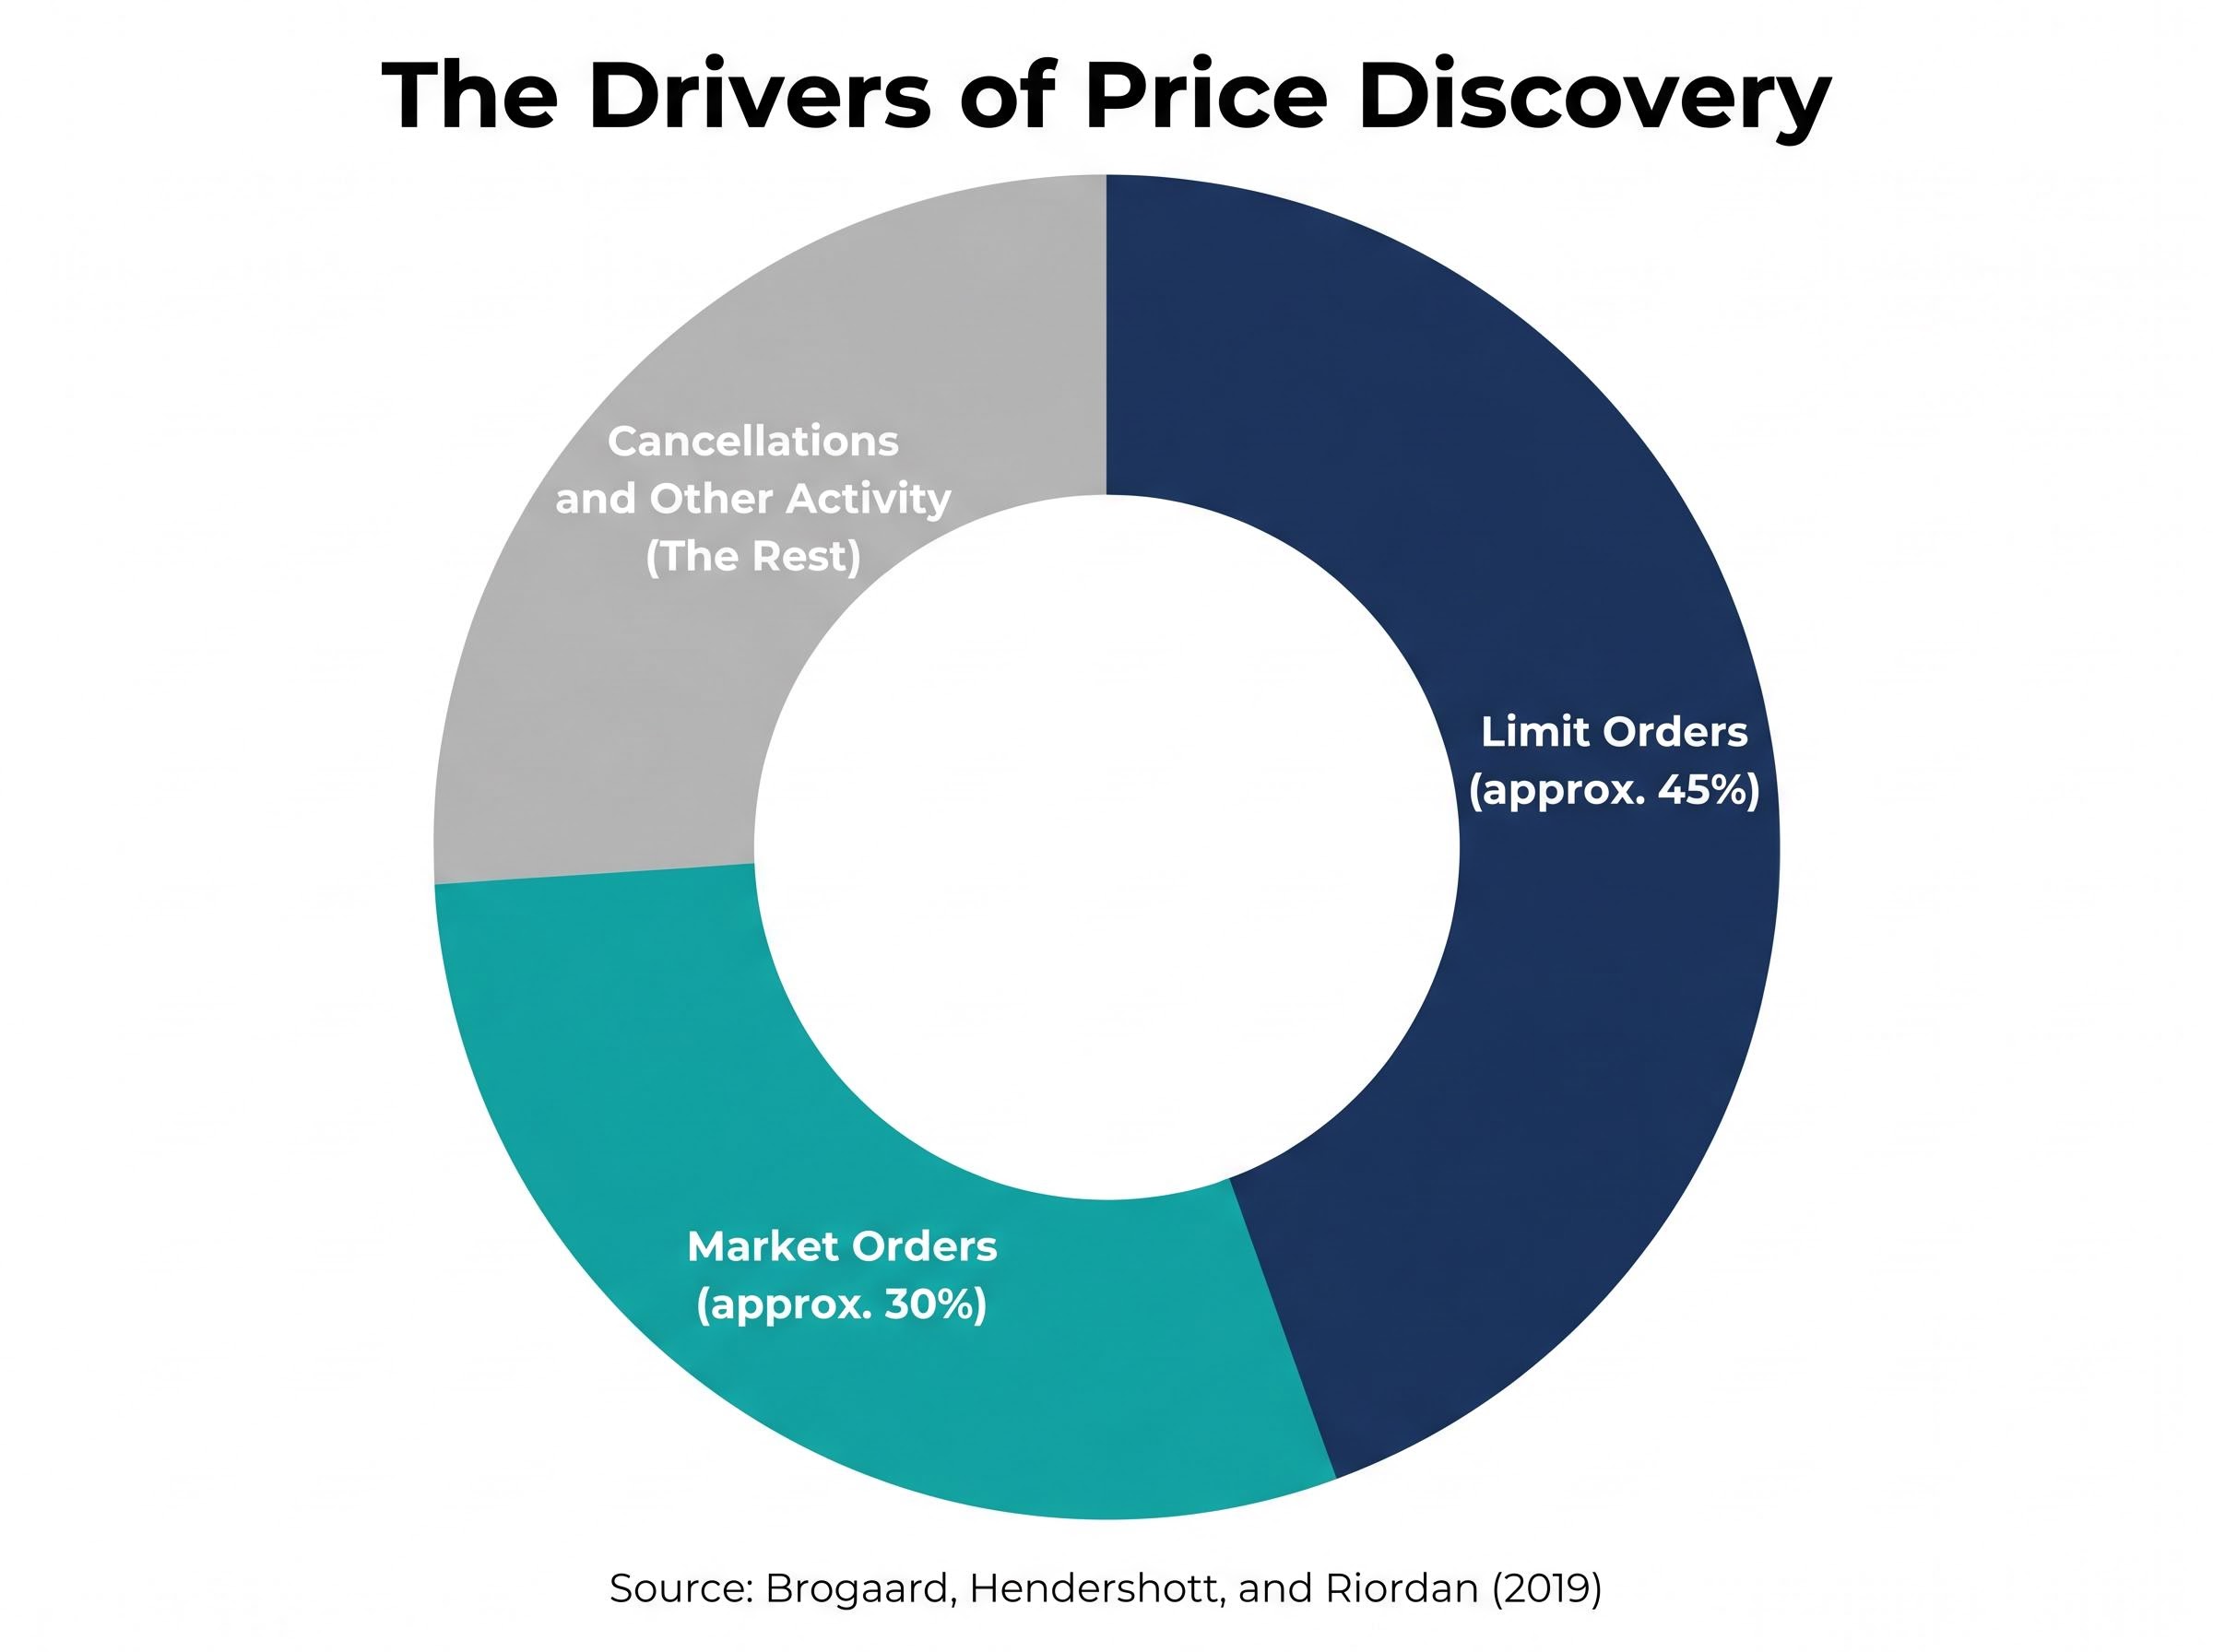
“Limit orders contribute approximately 45% to price discovery; market orders contribute approximately 30%.” Brogaard, Hendershott, and Riordan (2019)
This means passive limit orders, ones that have not yet resulted in a trade, are doing more of the price-setting work than actual completed transactions. The price an investor sees on screen is shaped by what the order book reveals about collective belief, not just by the last trade that printed.
Nasdaq Nordic data from 2023 reinforced this dynamic at a venue level: the listing exchange contributed a 50%+ share of European Best Bid and Offer improvements, holding a 2-3x lead over competing venues.
Price discovery does not operate the same way all day. During regular trading hours, prices update in milliseconds as algorithmic systems continuously quote and adjust. New information, whether earnings data, economic releases, or geopolitical developments, is incorporated almost instantly.
Opens and closes use a different mechanism entirely. A batch auction aggregates orders over several minutes before producing a single clearing price. This is why price gaps between yesterday’s close and today’s open are structurally normal, not anomalies. Overnight information accumulates and is resolved in one aggregated moment rather than tick by tick.
Investors who understand that the price they see is a live negotiation, not a settled fact, are less likely to be caught off guard by moves that occur before any large trade prints.
The earnings expectations gap is one of the clearest illustrations of price discovery in action: a company can report record profits and still see its share price fall sharply if the order book had already embedded a higher outcome into bid prices before the announcement, making the actual result look like a disappointment relative to what the market had already priced.
Individual investors occupy an outsized place in financial media. The actual data tells a more measured story about their role in setting prices.
Institutions, including hedge funds, mutual funds, pension funds, and proprietary trading firms, dominate overall market volume. Their algorithmic order flow generates the majority of limit orders that, as the price discovery research shows, do the heaviest lifting in determining prices.
High-frequency and algorithmic traders function as de facto market makers on most electronic venues. They continuously quote bid and ask prices, embedding price information into the market in real time. Goldman Sachs commentary from the second quarter of 2026 characterised algorithmic market makers as able to process macro uncertainty faster than human traders, adjusting quotes in milliseconds as new data arrives.
High-frequency trading firms achieve their speed advantage primarily through co-located servers positioned physically inside exchange data centres, reducing the signal travel time between their systems and the matching engine to microseconds; it is this latency edge, not any informational advantage, that allows them to continuously quote and update bid-ask prices faster than any human trader could respond.
The main participant categories in modern equity markets:
Retail share of US stock volume peaked at approximately 15.0% in November 2025. By early 2026, that figure had fallen to approximately 8.1%, its lowest level since Q3 2024, according to BeInCrypto.
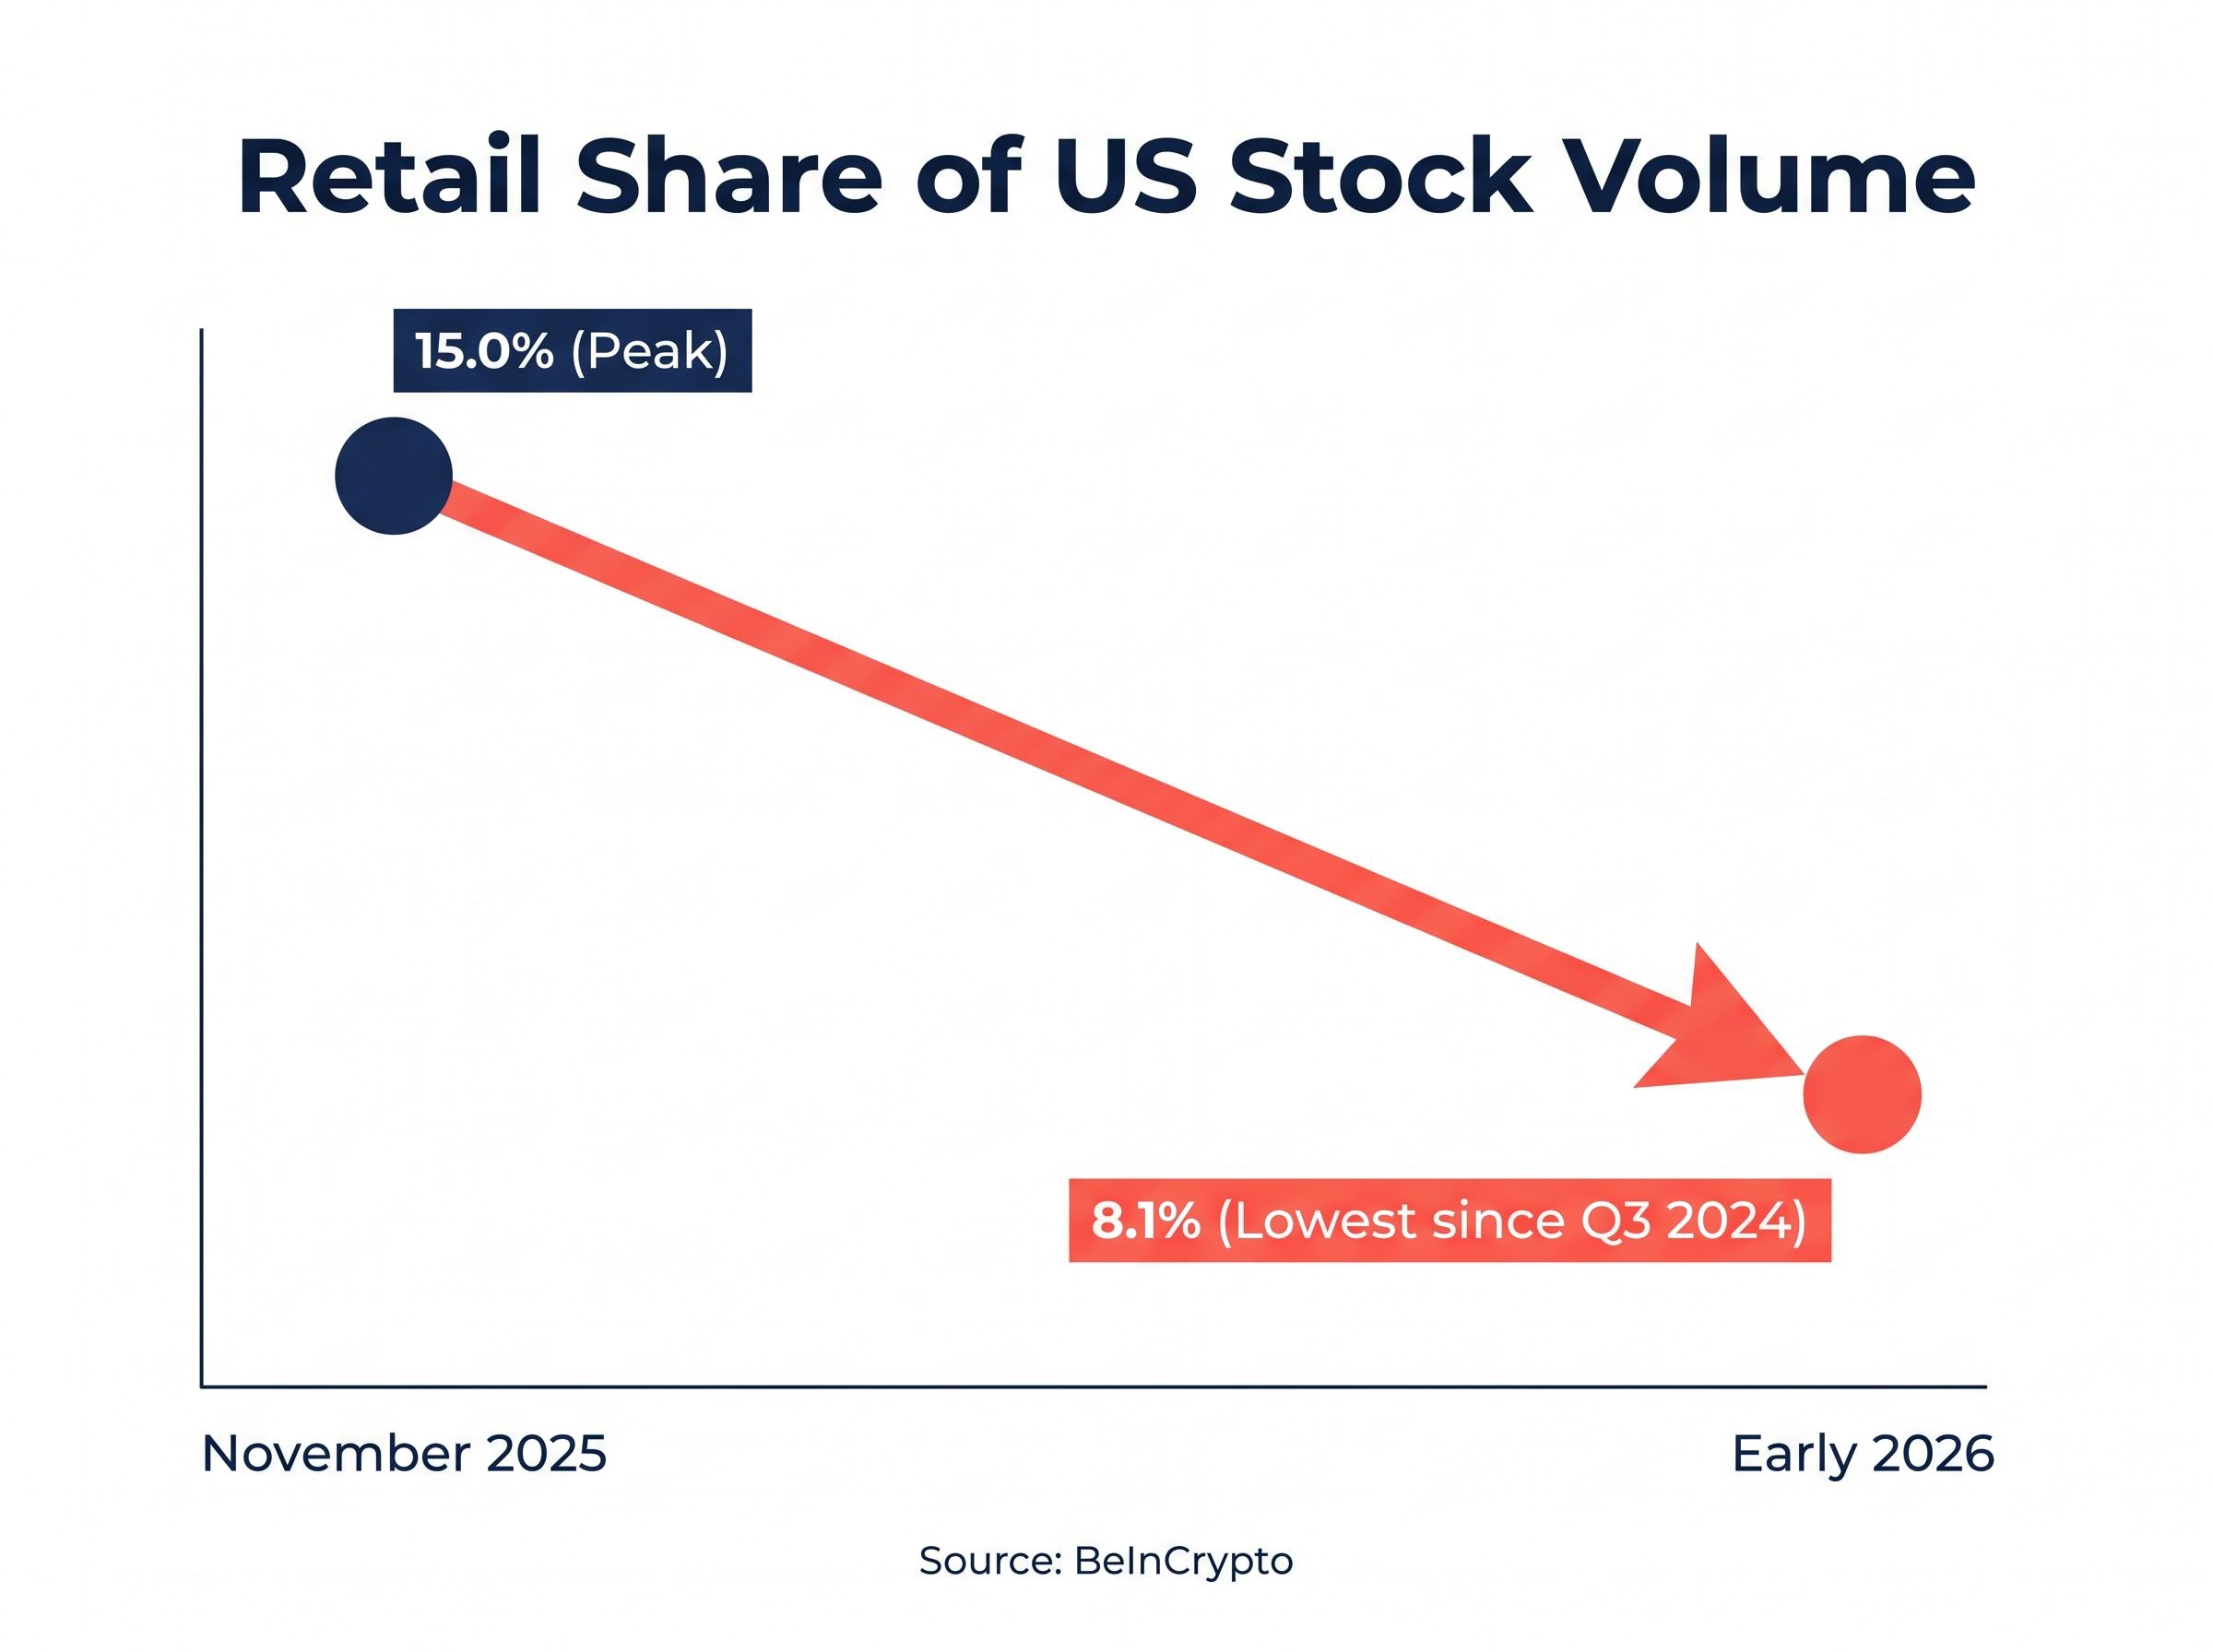
This does not mean retail participation is irrelevant. Individual investors still number in the tens of millions and can influence specific stocks, particularly smaller-capitalisation names. But in aggregate volume terms, individual trades rarely move broad market prices. Understanding who does move prices helps newer investors interpret signals more accurately and set realistic expectations about their own market impact.
A trade executing on an exchange is not the end of the process. Shares still need to reach the buyer’s account, and cash still needs to reach the seller. This post-execution step is called settlement.
In the United States, equity trades have settled on a T+1 basis since May 2024, meaning shares and cash exchange hands one business day after the trade executes. This was shortened from the previous T+2 standard to reduce counterparty risk, which is the risk that one party defaults before the trade clears. Across Europe and Asia, T+2 settlement remains standard.
| Region | Settlement Standard |
|---|---|
| United States | T+1 (since May 2024) |
| Europe and Asia | T+2 |
| Context | Shorter settlement reduces counterparty risk but requires faster operational infrastructure |
Settlement timelines affect how quickly investors can access proceeds from a sale. An investor selling shares on a Monday in the US will not have settled cash available until Tuesday.
Beyond individual trades, market indices give investors a shorthand for reading the overall health of the system. The three most widely referenced global benchmarks:
These indices are used to measure portfolio performance and to construct passive investment products such as index funds and ETFs. Rather than evaluating returns in isolation, investors can compare their portfolio against the relevant benchmark to gauge relative performance.
ETF ownership structure introduces a layer between the investor and the underlying shares; rather than holding individual company stock directly, an ETF investor owns a proportional interest in a fund that in turn holds the underlying securities, which affects how settlement, voting rights, and dividend distributions flow through to the end investor.
The stock market is not a single undifferentiated entity. It is a layered mechanical system: order routing, matching engines, price discovery, participant dynamics, and settlement infrastructure, each performing a distinct function.
The single most counterintuitive takeaway is worth restating. Passive limit orders, not completed trades, contribute the largest share of price discovery work. The price on screen reflects a live negotiation encoded in the order book, not simply the last trade that printed.
With this mental model in place, the next step is applying it. Reading order flow signals, interpreting bid-ask spreads as information rather than noise, and understanding why prices gap at the open are all practical extensions of the mechanics covered here.
This article is for informational purposes only and should not be considered financial advice. Investors should conduct their own research and consult with financial professionals before making investment decisions.
Price discovery is the continuous process by which markets converge on a security's fair value through the interaction of limit order quotes, completed market order trades, and other order book activity such as cancellations and modifications.
A market order executes immediately at the best available price, guaranteeing execution but not the exact price paid, while a limit order only executes at a specified price or better, giving cost certainty but risking the order never filling if the market moves away.
In the United States, equity trades have settled on a T+1 basis since May 2024, meaning shares and cash exchange hands one business day after the trade executes, which was shortened from the previous T+2 standard to reduce counterparty risk.
Yes, according to research by Brogaard, Hendershott, and Riordan, passive limit orders sitting in the order book contribute approximately 45% to price discovery before a single trade executes, making them a larger price-setting force than completed market order transactions.
The primary market is where companies issue new shares directly to investors through processes such as IPOs, with proceeds going to the company, while the secondary market is where existing shares trade between investors with prices set entirely by supply and demand.