
What UK Traders Lose When Their CFD Account Goes Offshore
23 mins ago

A company can report a “record quarter” on an adjusted basis while simultaneously posting a GAAP loss, and most retail investors will never notice the contradiction. This is not an accident. Quarterly earnings releases are authored by investor relations teams that serve two functions at once: delivering a factual financial record and constructing a strategic narrative around it. Four times a year, these documents shape how the market prices thousands of public companies, and the framing choices buried inside them carry real consequences for anyone making decisions based on the headline figures. This guide walks through the specific techniques companies use to present results favourably, the red flags that reveal what is being obscured, and a practical six-step method for reading any earnings release critically in 20 minutes or less.
The earnings press release is not a neutral document. It is written by a company’s investor relations team, reviewed by management, and released without an auditor’s sign-off. Unlike the 10-Q (quarterly SEC filing) or the 10-K (annual filing), which follow standardised formats and face regulatory review, the press release is where narrative construction happens most aggressively. Management chooses which metrics lead, which comparisons frame the quarter, and which figures earn a bullet point at the top of the page.
The SEC recognises this asymmetry. Its guidance under Regulation G requires that any non-GAAP financial measure be reconciled to the nearest GAAP equivalent and prohibits companies from presenting the non-GAAP figure more prominently than the GAAP figure. The existence of that rule is itself a signal: regulators have already identified the framing problem.
Understanding this structural reality is the prerequisite to reading anything else critically. Consider the contrast:
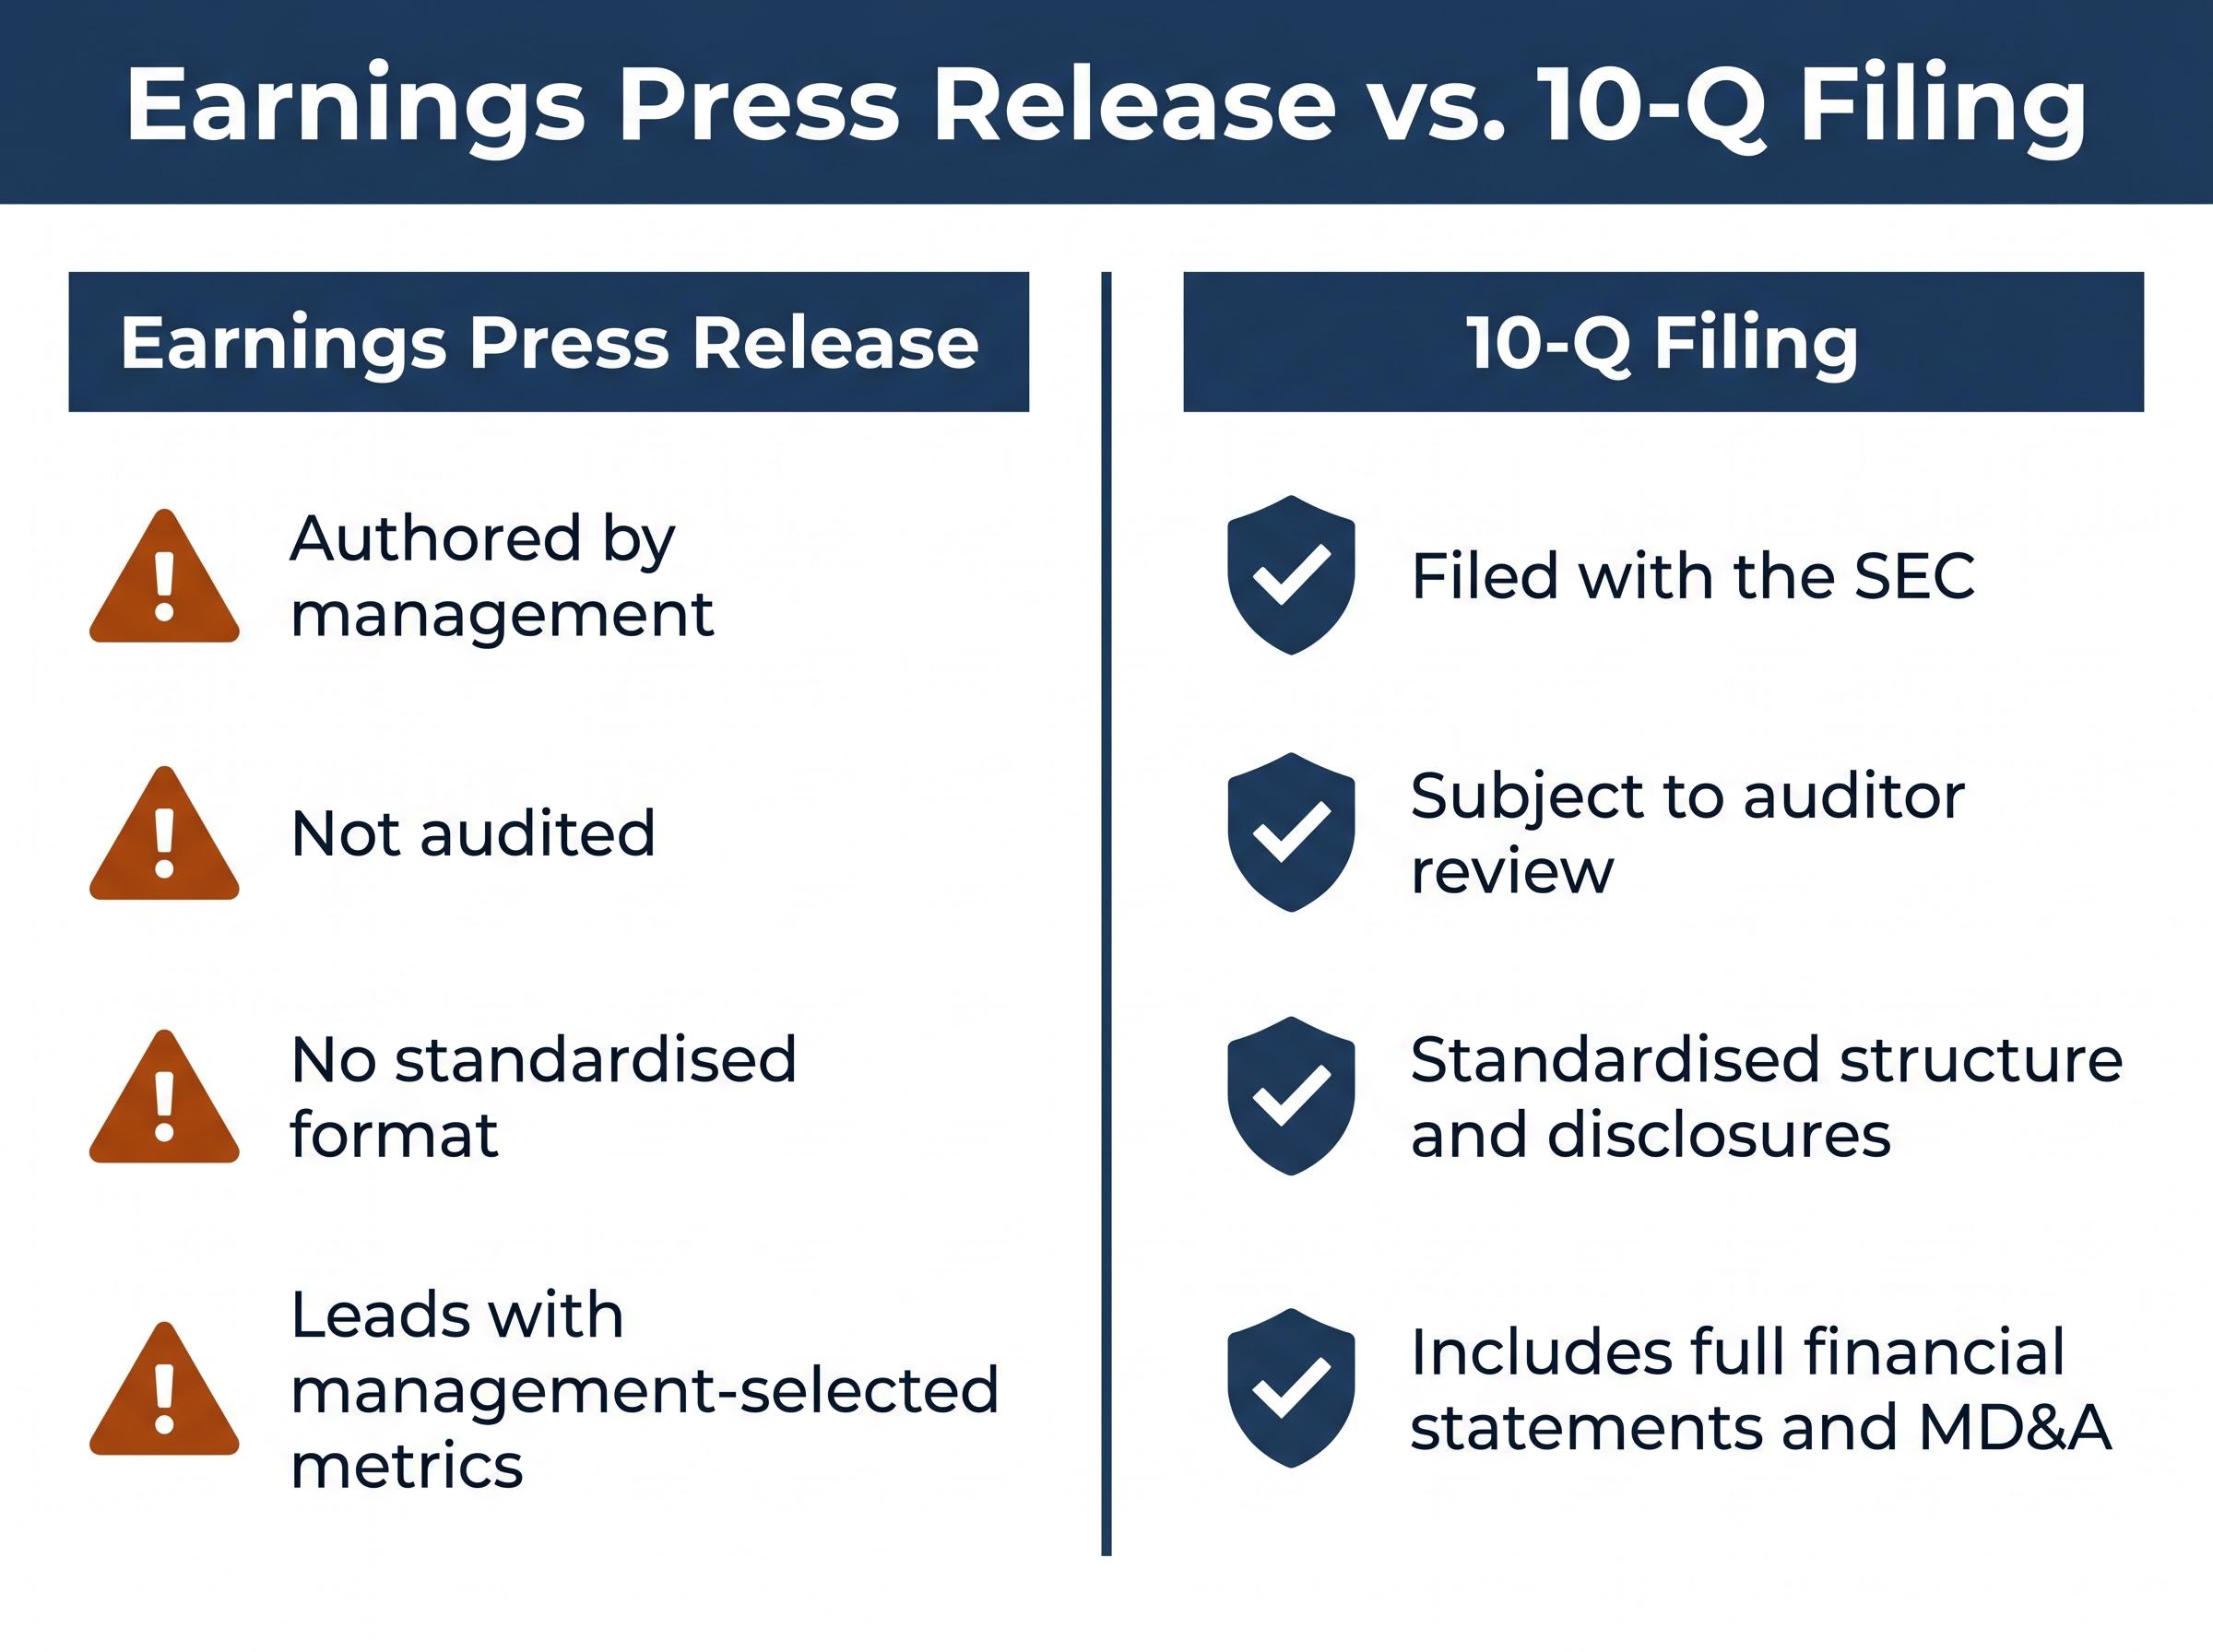
Earnings press release:
10-Q filing:
An 8-K filing often contains or references the earnings press release, but the press release itself remains management-authored. Every section that follows in this guide builds on one principle: the document was designed to argue a case, not merely report facts. Read it that way.
The SEC’s proposed revision to quarterly reporting requirements, which would allow eligible domestic companies to replace Form 10-Q filings with a semiannual Form 10-S, directly affects how often investors receive the structured financial disclosures this framework relies on; critics of the proposal warn that extended reporting gaps widen the information asymmetry between corporate insiders and outside investors.
GAAP (Generally Accepted Accounting Principles) metrics are the standardised, audited financial figures the SEC requires in all public filings. They include revenue, net income, earnings per share (EPS), operating income, and cash flow from operations. Because every company must follow the same recognition rules, GAAP figures allow direct comparison across companies and across time.
Non-GAAP metrics are adjusted figures that management defines independently. A company’s “Adjusted EBITDA” might exclude stock-based compensation, restructuring charges, acquisition costs, and litigation expenses, but another company using the same label could exclude an entirely different set of items. As KPMG has acknowledged, management independently determines non-GAAP methodology with no universal standard. Non-GAAP figures are not audited.
| Attribute | GAAP Metrics | Non-GAAP Metrics |
|---|---|---|
| Audited | Yes (annually; reviewed quarterly) | No |
| Standardised | Yes, uniform rules across all filers | No, defined by each company individually |
| What is excluded | Nothing; all costs recognised | Stock-based comp, restructuring, litigation, acquisition costs (varies) |
| SEC presentation rules | Required in all filings | Must be reconciled to GAAP; cannot be more prominent |
The governing rules are Regulation G and Item 10(e) of Regulation S-K. Under these rules, companies must reconcile every non-GAAP figure to its nearest GAAP equivalent and cannot label a charge as “non-recurring” if a similar charge appeared within the prior two years or is reasonably expected within the next two years.
Regulation G and Item 10(e) of Regulation S-K, adopted by the SEC in 2003, established the core disclosure requirements that govern non-GAAP presentations today, including the prohibition on labelling a charge as non-recurring when a similar charge has appeared within the prior two years or is reasonably expected to recur.
The five most common non-GAAP exclusions to watch for:
The two-year recurrence rule: Under SEC guidance, a company cannot characterise a charge as non-recurring if a similar charge has occurred within the prior two years or is reasonably likely to recur within the next two years. When restructuring costs appear in four consecutive quarters but are still excluded from “Adjusted EPS,” that adjustment deserves immediate scrutiny.
Non-GAAP EPS is the figure most financial media headlines reference when reporting a “beat.” Knowing what has been excluded, and whether those exclusions genuinely qualify as non-recurring, is the single most important analytical skill for evaluating whether the beat carries any meaning.
The opening paragraph and bulleted highlights of an earnings release are the highest-attention real estate in the document. Companies use this space exclusively for their strongest metrics. When the current quarter is weaker than the prior year, management may lead with full-year figures instead. When GAAP results disappoint, the opening bullets may feature only non-GAAP beats.
This is deliberate architecture, not neutral layout.
The first two bullet points almost always feature management’s strongest numbers. Research consistently shows that companies position favourable metrics in the opening section and push weaker results further down. A related technique is the “sandwich”: placing a deteriorating metric between two strong ones so the decline reads as minor or isolated within a list of highlights.
Guidance revisions carry more forward-looking weight than reported results, yet full-year guidance cuts are routinely buried in footnotes or delivered verbally near the end of an earnings call, after the stock has already reacted to the headline beat. Segment reporting offers another avenue: underperforming business lines may be consolidated with stronger divisions or removed from detailed reporting altogether.
Guidance signals across sectors routinely carry more price impact than the reported quarter itself, a dynamic visible each earnings season when companies with modest result beats are punished for cutting forward outlooks while others with modest misses rally on raised guidance.
Four placement red flags to watch for:
That last signal deserves emphasis. When a previously reported KPI disappears from an earnings release, treat the absence as information. Companies do not stop highlighting metrics that are improving.
A standard earnings call follows a predictable structure: a safe harbour statement (the legal disclaimer on forward-looking statements), CEO prepared remarks, CFO financial review, and then the analyst Q&A session. The prepared remarks are scripted and pre-approved. The Q&A is not.
That distinction makes the Q&A the most analytically useful portion of the call.
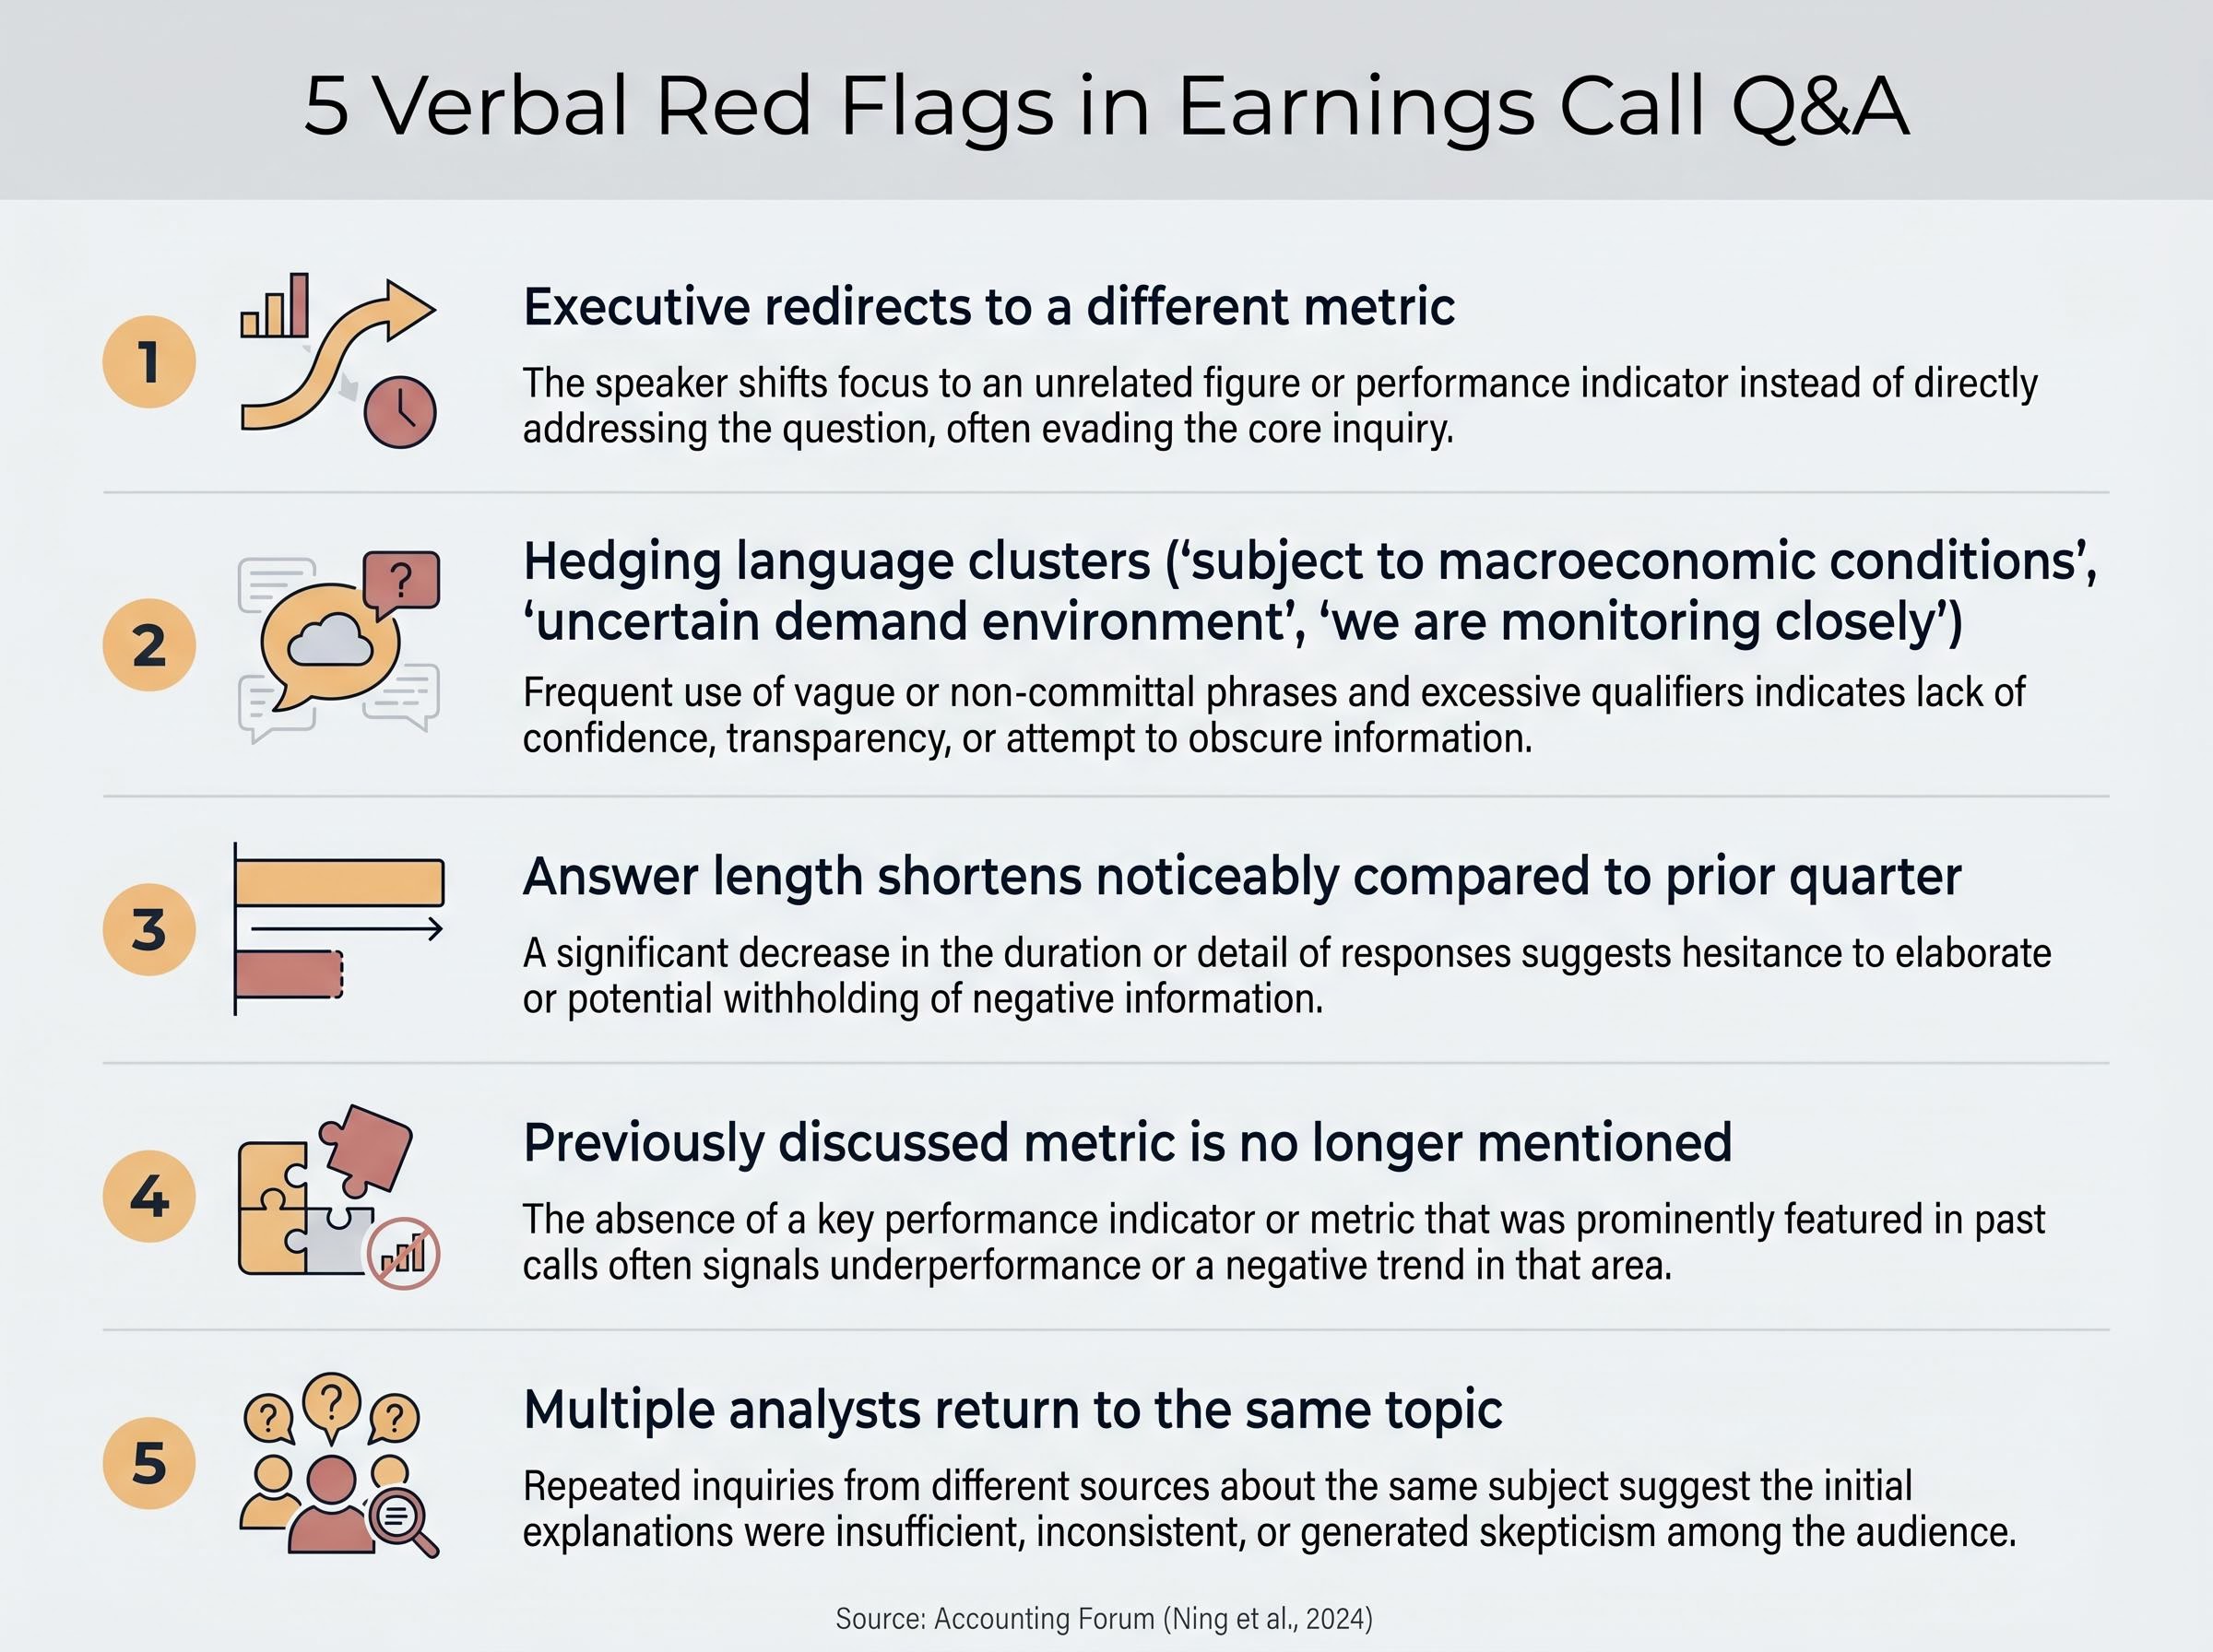
Five verbal red flags to listen for in Q&A:
Academic research supports the value of this qualitative analysis. According to research published in Accounting Forum (Ning et al., 2024), managers with stronger confidence tend to use more optimistic language, while those anticipating weaker results moderate their tone. These language patterns often appear before the numbers confirm the deterioration.
A note on AI-drafted language: There is growing awareness among financial analysts that AI-assisted drafting tools may be contributing to more uniformly neutral language in prepared remarks. Polished, consistently tempered tone is not necessarily a signal of genuine stability; it may simply reflect communications tools that smooth editorial variation. This makes Q&A analysis, where responses are unrehearsed, comparatively more important for detecting shifts in management confidence.
Metric switching is another pattern worth tracking across consecutive transcripts. A SaaS company that shifts emphasis from net revenue retention to gross revenue retention, for example, may be signalling that customer churn has increased. These changes should be tracked quarter over quarter, not evaluated in isolation.
The analytical skills covered in the preceding sections convert into a repeatable six-step process, ordered from the fastest cross-checks to deeper verification.
Earnings beat rates and analyst estimates interact in ways that can make aggregate results look more impressive than underlying business performance warrants; when analysts enter a season with unusually conservative forecasts, the resulting beat rate reflects the forecast gap as much as genuine outperformance.
| Step | Document Source | What to Look For | Red Flag |
|---|---|---|---|
| 1 | GAAP reconciliation table | Items excluded from non-GAAP | Recurring charges labelled “one-time” |
| 2 | Earnings release / 10-Q | GAAP vs. non-GAAP EPS gap | Gap widening each quarter |
| 3 | Cash flow statement | OCF minus CapEx vs. company FCF | Company FCF significantly higher than yours |
| 4 | Balance sheet | AR growth vs. revenue growth | AR outpacing revenue |
| 5 | Guidance section / consensus data | Raise, maintain, or cut vs. consensus | Guidance cut buried; non-GAAP-only outlook |
| 6 | Prior quarter’s earnings release | Language shifts, missing KPIs | Metric previously featured now absent |
All SEC filings are publicly available at no cost on SEC EDGAR. Analyst consensus figures are accessible on Yahoo Finance and Seeking Alpha. Multi-year trend data for historical comparisons is available on Macrotrends.
One behavioural note worth internalising: Post-Earnings Announcement Drift (PEAD) is a well-documented phenomenon in which stock prices continue to move in the direction of an earnings surprise for weeks after the announcement. Reacting immediately to the headline “beat” or “miss” framing, before completing the steps above, is one of the most common and costly errors retail investors make during earnings season.
This article is for informational purposes only and should not be considered financial advice. Investors should conduct their own research and consult with financial professionals before making investment decisions.
Earnings releases are constructed arguments, not neutral records. The analytical skills in this guide are tools for reading them on the company’s own terms while drawing independent conclusions. Three takeaways matter most: always locate the GAAP reconciliation before engaging with headline figures; treat information placement and metric disappearance as data, not layout; and recognise that the Q&A transcript and the cash flow statement are the two hardest things for a company to fully control.
Earnings season recurs quarterly. Each cycle is an opportunity to practise these steps on real disclosures. The investor who reads four earnings releases critically each quarter, applying the six-step framework above, develops a material informational advantage over one who relies on headline framing alone.
For investors wanting to translate earnings release analysis into a quantified view of market expectations before a report lands, our dedicated guide to earnings season options pricing covers implied volatility mechanics, the volatility crush that occurs post-announcement, and a five-step framework for assessing event risk using front-month straddles.
SEC EDGAR and Investor.gov are free starting points for applying this framework immediately. The filings are public. The tools are accessible. The edge comes from the habit of using them.
GAAP earnings follow standardised, audited accounting rules required by the SEC, while non-GAAP earnings are adjusted figures defined independently by each company that may exclude items like stock-based compensation, restructuring charges, and acquisition costs.
Watch for the opening section featuring only non-GAAP figures, guidance cuts buried in footnotes, previously highlighted metrics that suddenly disappear, and current-quarter weakness obscured by full-year or trailing-twelve-month framing.
Under Regulation G and Item 10(e) of Regulation S-K, a company cannot label a charge as non-recurring if a similar charge appeared within the prior two years or is reasonably expected to recur within the next two years.
Focus on the Q&A section rather than scripted prepared remarks, and watch for executives redirecting to different metrics, clusters of hedging language, noticeably shorter answers compared to prior quarters, and multiple analysts pressing on the same topic.
Start by locating the GAAP reconciliation table, compare GAAP EPS to non-GAAP EPS and track whether the gap is widening, calculate free cash flow yourself from the cash flow statement, check accounts receivable growth against revenue growth, review guidance versus analyst consensus, and compare the current release side by side with the prior quarter's release.