Stock Valuation Analysis: What Tesla at 161x Teaches Investors
19 mins ago

At roughly 185x forward earnings, Tesla’s stock is not priced for what the company is today. It is priced for what it might become, and the gap between those two things is one of the most instructive valuation puzzles in modern markets.
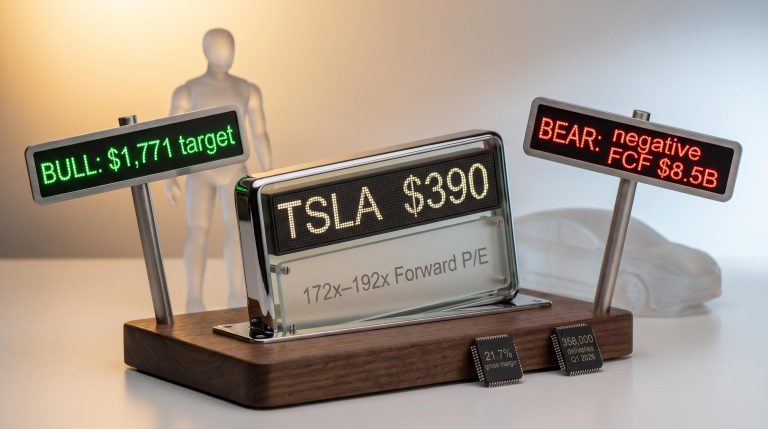
Tesla reported Q1 2026 earnings on 22 April 2026, delivering a mixed result: a slight revenue miss ($22.39 billion actual versus $22.64 billion expected) alongside an EPS beat ($0.41 versus $0.37 expected). The stock sat at $411.79 as of 7 May 2026. Wall Street’s analyst community is split between a $405 neutral target from Goldman Sachs and a $600 bull case from Wedbush. That divergence is not a disagreement about Tesla’s current business. It is a disagreement about which future Tesla inhabits.
What follows uses Tesla’s current valuation as a teaching tool. Readers will learn how to build bull and bear scenarios, why entry price is one of the most consequential variables in any investment, and how to think probabilistically when a stock is priced for a transformation that has not yet happened.
The instinct is understandable. A stock looks expensive, so a reader pulls up the price-to-earnings ratio, sees a number, and uses it to make a judgement. For most companies, that instinct serves well enough. For Tesla, it produces a number that is almost meaningless on its own.
Tesla’s forward P/E of approximately 185x and forward EV/EBITDA of approximately 119x are not anomalies to be dismissed. They are signals. At a consensus 2026 EPS of approximately $2.22, the market is not paying for this year’s earnings. It is paying for a probability distribution of futures, some of which look radically different from the business Tesla operates today.
The market is pricing a probability distribution of futures, not a single outcome. A single P/E multiple cannot capture the range of businesses Tesla might become.
Consider what contributes to that distribution. Tesla’s valuation embeds at least four distinct business segments, each requiring a different analytical lens:
That Q1 2026 gross margin of 21.7%, which substantially exceeded the 17% analyst consensus, illustrates the point. The base automotive business is performing. But it is not the automotive business driving the valuation. The premium sits on the segments that do not yet generate meaningful revenue.
This is the category of stock where traditional multiples function as diagnostic tools rather than verdicts. Recognising that distinction is the first skill in evaluating any company in transition.
Historical precedents for extreme multiples, including Amazon’s transition from retail to cloud infrastructure and Nvidia’s pivot to AI accelerator dominance, show that optically absurd valuations can be retrospectively justified, but both cases also produced severe drawdowns before the underlying thesis proved out, a detail that selectively optimistic investors tend to omit.
If a single multiple cannot capture Tesla’s range of outcomes, what can? The answer is scenario analysis, a methodology that explicitly acknowledges uncertainty by modelling multiple plausible futures rather than betting on one.
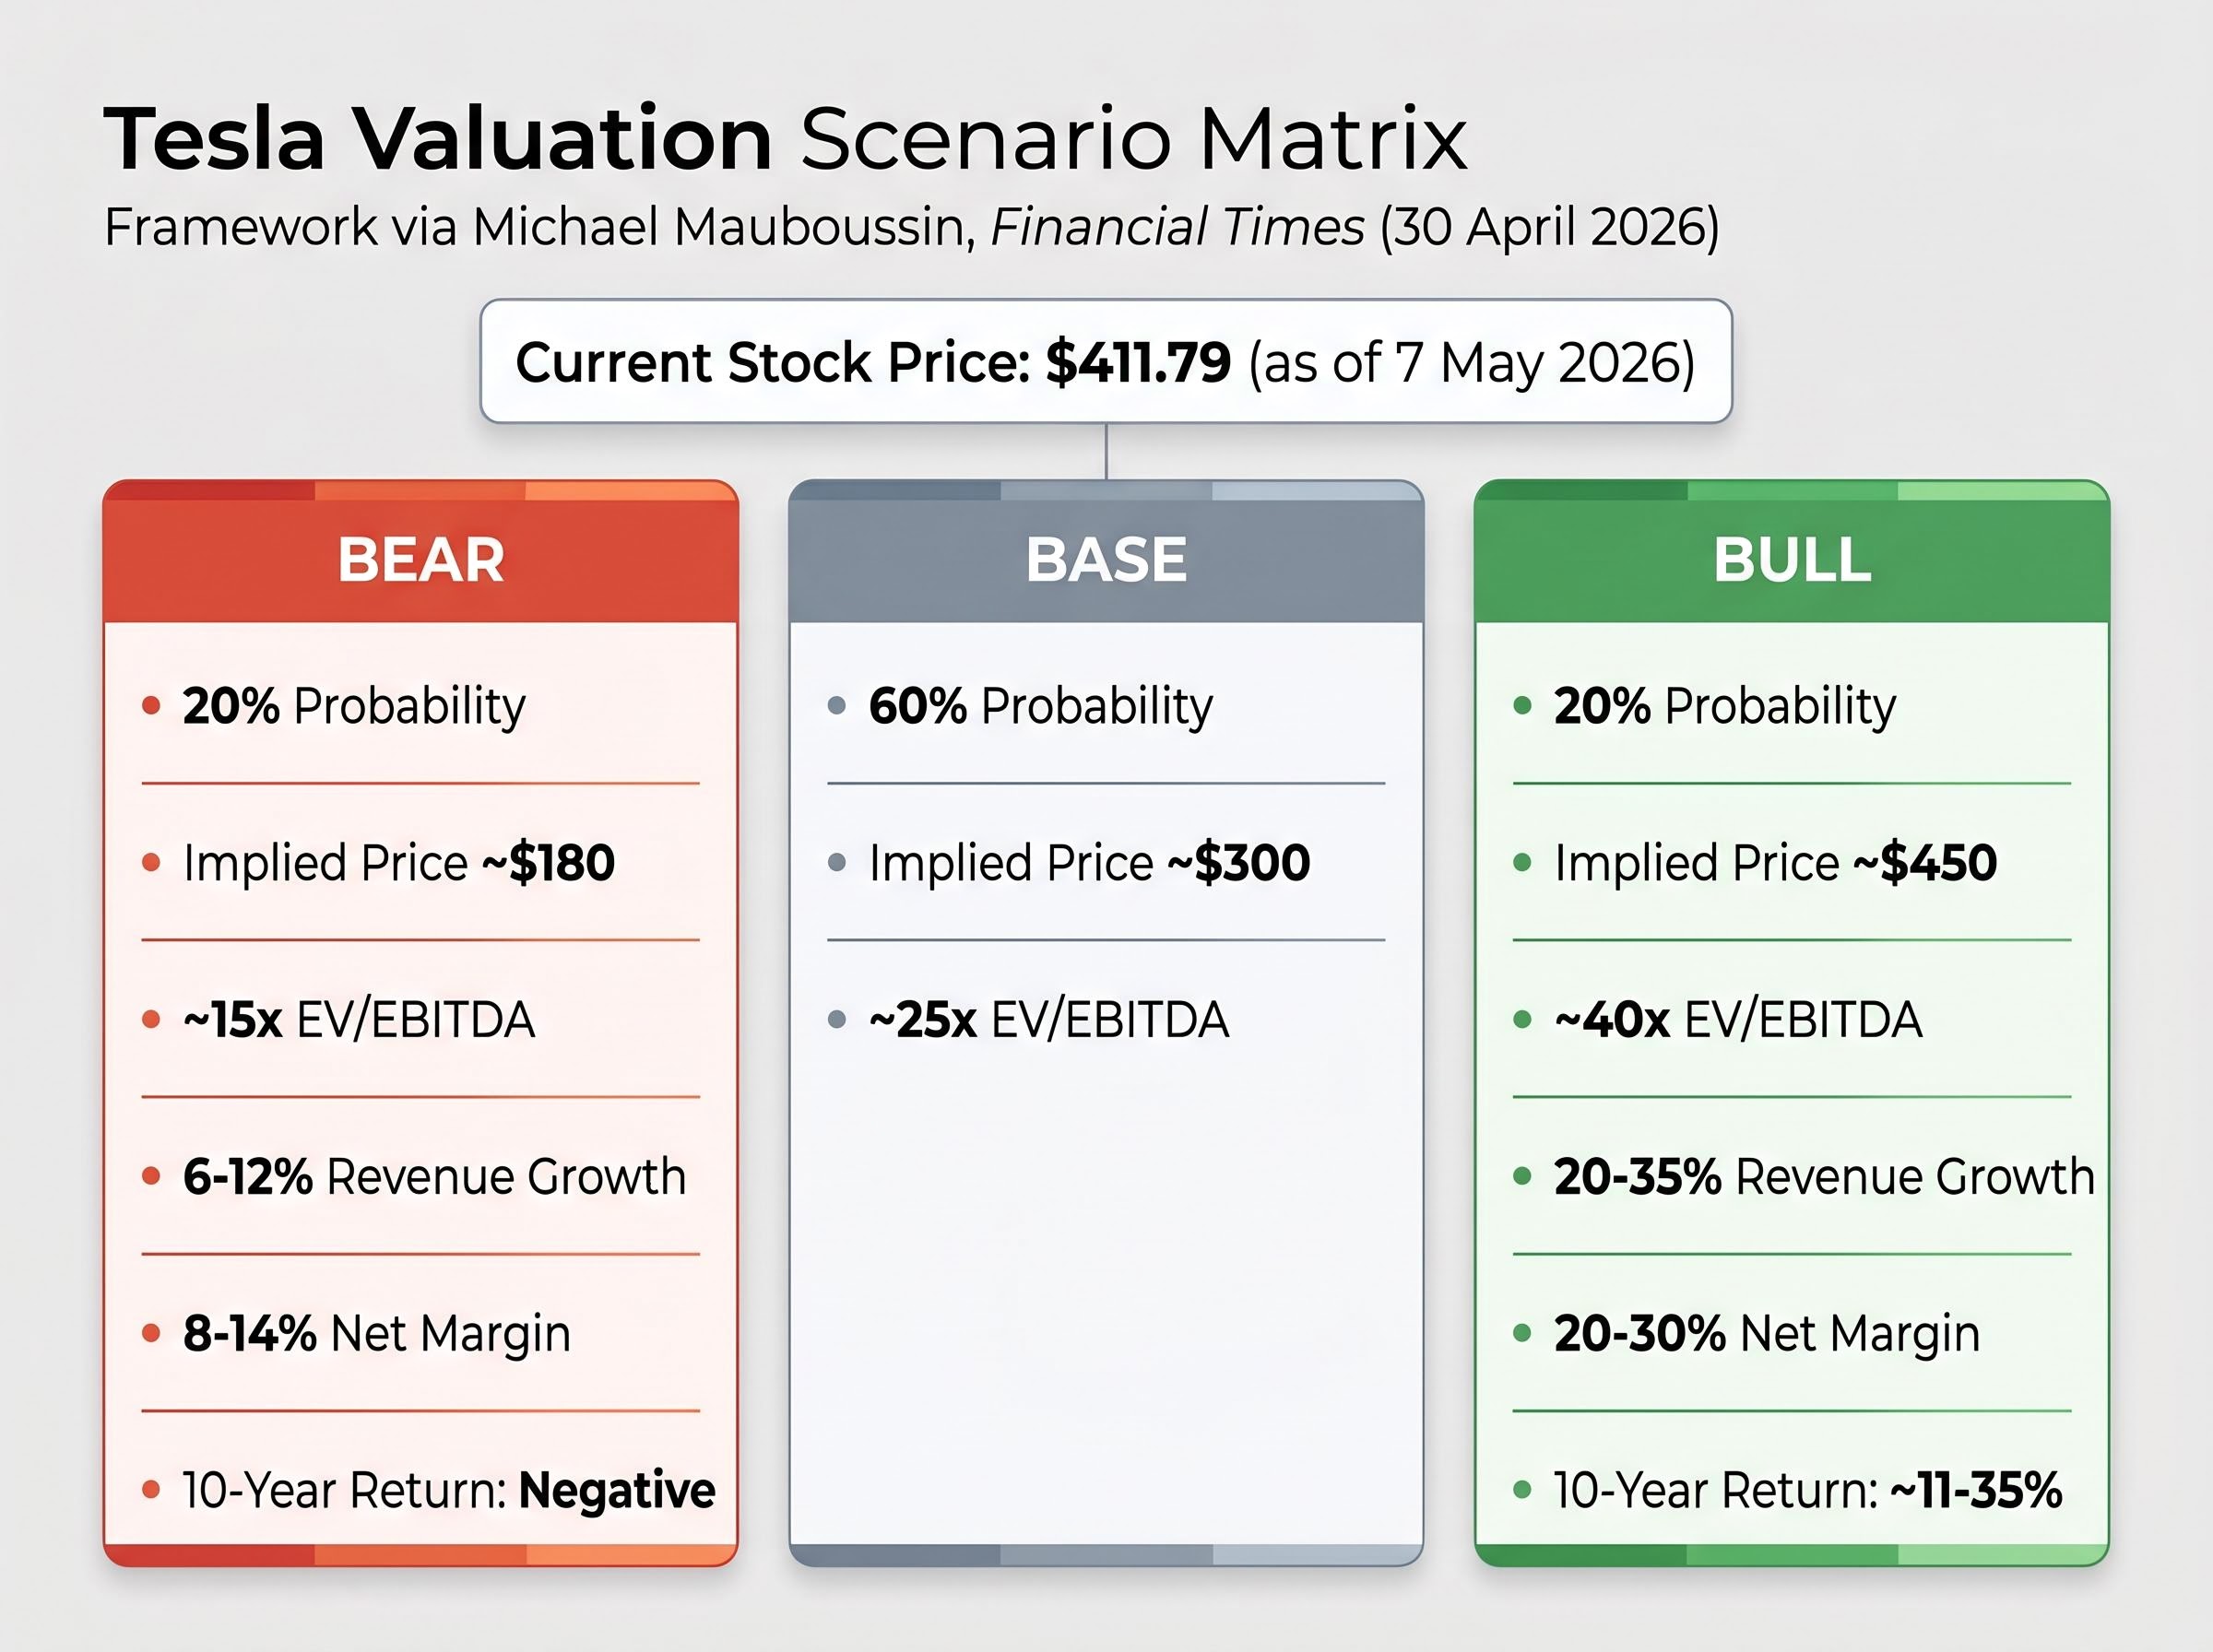
Michael Mauboussin, a widely cited CFA Institute contributor, outlined a DCF sensitivity approach for Tesla in a 30 April 2026 Financial Times piece. The framework applies different EV/EBITDA multiples to the same company depending on which future materialises:
Damodaran’s scenario analysis framework, developed through NYU Stern’s valuation research, treats each scenario as a probability-weighted estimate of expected cash flows rather than a single-point forecast, a discipline that guards against the common error of treating the most optimistic outcome as the base case.
| Scenario | EV/EBITDA multiple | Implied share price | Probability weight |
|---|---|---|---|
| Bear | ~15x | ~$180 | 20% |
| Base | ~25x | ~$300 | 60% |
| Bull | ~40x | ~$450 | 20% |
The structure is replicable. First, identify the plausible scenarios. Then, for each scenario, translate qualitative assumptions (robotaxi succeeds, margins expand, Optimus scales) into quantifiable inputs: a revenue growth rate, a net profit margin, and a valuation multiple. The three scenarios become three columns, each producing a different implied share price.
The hardest part is not building the scenarios. It is weighting them honestly. The bull case is more exciting, and excitement introduces a cognitive bias toward overweighting it.
ARK Invest’s reverse DCF model, updated in May 2026, works backward from Tesla’s current price to determine what assumptions the market is embedding. At prevailing price levels, the model implies approximately a 45% probability of robotaxi success is already priced into the shares.
That number deserves context. Elon Musk claimed in 2016 that Tesla hardware was ready for full self-driving. In 2019, he projected a robotaxi network would be operational within the year. In 2021, he suggested Optimus would be ready soon after. Each timeline proved optimistic. This is not an argument against the technology. It is an argument for conservative probability weighting on transformational claims, anchored to the historical execution record rather than the aspiration.
A 60/20/20 split (base/bull/bear) is a reasonable starting point for any company with this execution history. Adjust from there as evidence accumulates.
Analyst target dispersion, the dollar-width of the spread between the most bearish and most bullish price targets on a given stock, is itself an independent risk signal: wide dispersion indicates that professional analysts applying comparable data sets are reaching fundamentally different conclusions about which scenario will materialise, which is a useful pre-investment calibration check on assumed certainty.
The framework only becomes useful when populated with specific assumptions. Here, the distance between Tesla’s possible futures becomes visible in dollar terms.
| Scenario | Revenue growth | Net margin | Valuation multiple | 10-year annualised return |
|---|---|---|---|---|
| Bull | 20-35% (midpoint ~27%) | 20-30% | 25-35x | ~11-35% |
| Bear | 6-12% (midpoint ~9%) | 8-14% | 18-22x | Negative (all outcomes) |
The bull case assumes robotaxi revenue scales, FSD licensing contributes meaningfully, and margins expand as software revenue grows faster than hardware costs. Under those assumptions, an investor buying at $411 could see annualised returns of 11-35% over a decade.
The bear case assumes Tesla remains a highly profitable electric vehicle manufacturer but the autonomous and robotics segments fail to generate material revenue. Revenue growth settles in the 6-12% range. Margins compress to 8-14% under competitive pressure from BYD and tariff headwinds. At an entry price of approximately $411, every projected return outcome is negative.
At approximately $411 per share, every projected return outcome under realistic automotive-only assumptions is negative. The current price already embeds the AI and robotics transformation.
Q1 2026 results are instructive here. The $0.41 EPS beat and 21.7% gross margin are consistent with the base and bull case for the automotive business. They are encouraging data points. But they do not yet validate the robotaxi or Optimus revenue assumptions that drive the bull case multiple. Forward analyst estimates project earnings per share growing more than 5x from current levels, which already incorporates expected AI and autonomy contributions.
The question is not whether Tesla can execute on EVs. The question is whether the segments that justify the premium will materialise on a timeline that rewards today’s buyer.
Scenario analysis treats Tesla as one entity with multiple possible futures. Sum-of-parts (SOP) valuation takes a complementary approach: it treats Tesla as multiple businesses operating simultaneously, each with its own risk profile and required evidence threshold.
The logic is straightforward. A traditional auto multiple applied to Tesla’s EV business would produce one valuation. A high-growth multiple applied to energy and storage would produce another. A probability-weighted DCF for robotaxi and FSD would produce a third. And a deep optionality treatment for Optimus, where the addressable market could be enormous but the timeline is uncertain, would produce a fourth.
The appropriate valuation methodology differs for each segment:
SOP decomposition reveals which assumptions are doing the most valuation work, and therefore which developments to monitor most closely.
Sum-of-parts decomposition becomes particularly valuable when a company’s next concrete catalysts are already scheduled, because investors can map each upcoming data point (a delivery report, a regulatory permitting decision, a production milestone) directly onto the specific segment assumptions that data point is designed to validate or refute.
Waymo provides the clearest operational benchmark for sizing the robotaxi opportunity. As of March 2026, Waymo was completing approximately 500,000 paid rides per week across Phoenix, San Francisco, and Los Angeles. At roughly $15-$20 per ride, that produces an annualised revenue run-rate of approximately $355 million. The company targets 1 million rides per week by end of 2026 with a fleet of approximately 3,000 vehicles.
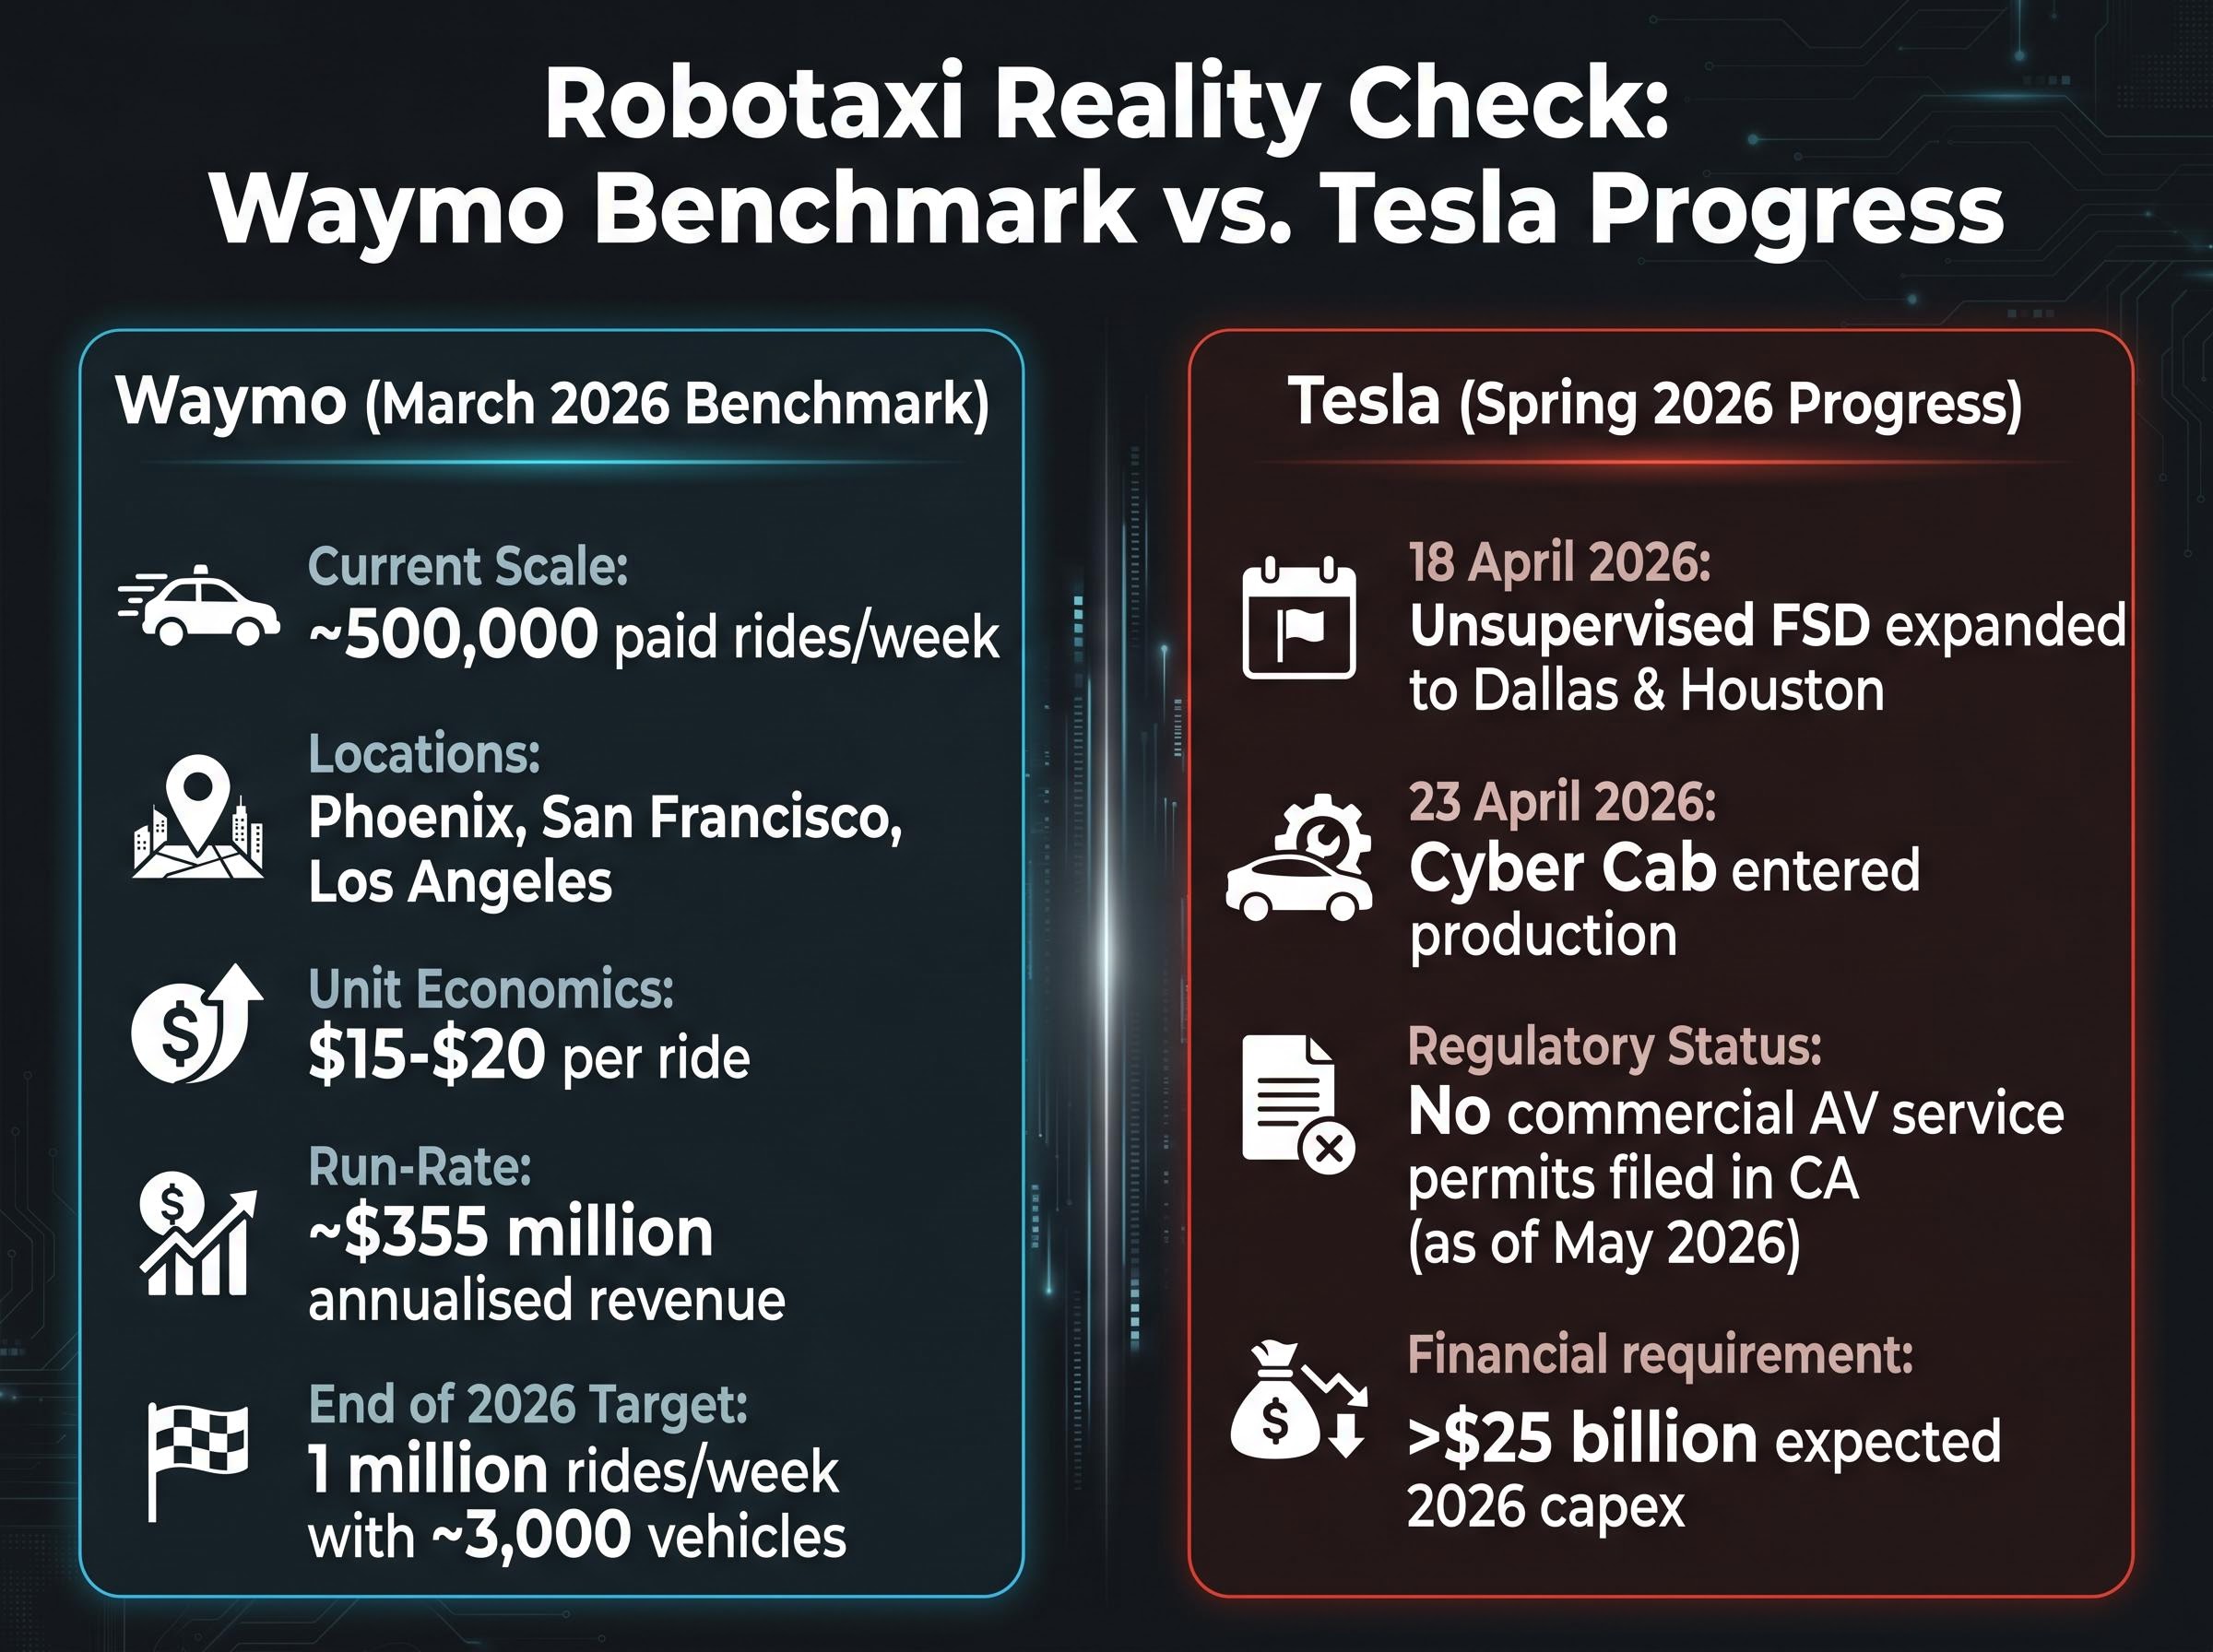
Those numbers illustrate both the revenue potential and the timeline. Waymo, with years of operational history and multi-city regulatory approvals, generates roughly $355 million annualised. Tesla’s Cyber Cab entered production on 23 April 2026, and unsupervised FSD expanded to Dallas and Houston on 18 April 2026. The progress is real. But Tesla has not filed for commercial autonomous vehicle service permits in California as of May 2026, while the company’s CFO has indicated 2026 capital expenditure is expected to surpass $25 billion, generating substantial negative free cash flow across simultaneous build-outs.
The California DMV autonomous vehicle permit requirements, updated in April 2026, establish a staged approval process moving from supervised testing to driverless testing before any commercial deployment is authorised, a regulatory sequence that shapes realistic timelines for any robotaxi operator seeking to scale in the state’s major metro markets.
The arithmetic of scaling Waymo’s ride economics to Tesla’s stated ambitions is the exercise every investor should complete. It converts optimism into a testable revenue range and makes the gap between current operations and required scale concrete.
Everything built in the preceding sections, the scenarios, the sum-of-parts decomposition, the probability weights, converges on one variable that determines whether the investment works: the price paid to enter.
The relationship is mathematical, not philosophical. A higher entry price means more of the bull case must materialise just to break even. At approximately $100 per share, available in prior years, even a partial execution on autonomy generates strong returns. At $411, the bear case produces losses even if Tesla remains a highly profitable EV manufacturer.
The price paid determines which future an investor needs to be right about.
The analyst target divergence is itself evidence of this dynamic. Goldman Sachs analyst Mark Delaney set a neutral target of approximately $405 (updated 29 January 2026). Wedbush analyst Dan Ives maintains a $600 target. Morgan Stanley’s Adam Jonas sits at approximately $425. ARK Invest projects a bull case of $2,600 by 2029, assuming an 80% robotaxi success probability. These are not analysts who disagree about Tesla’s products. They disagree about how much of the transformation is already priced in, and how much upside remains at the current entry point.
Short interest declined from 3.4% on 31 March to 2.8% in early May, the lowest since Q4 2025. Institutional flows reflect a similar directional shift: ETF inflows into Tesla-linked products totalled approximately $2.8 billion from 22 April to 6 May, and 13F filings indicate ARK Invest and Baillie Gifford added over 5 million shares at Q1 end.
A three-step framework captures the entry price discipline:
Defining pre-purchase monitoring triggers before entering a position converts probability weights from static assumptions into living estimates that update as evidence arrives each quarter, with specific thresholds such as auto gross margin exceeding 18%, robotaxi regulatory filings, Optimus production milestones, and CapEx efficiency ratios providing concrete criteria for revising the scenario weightings upward or downward.
The framework built through this Tesla analysis is portable. It applies to any stock where the current price is meaningfully higher than what the existing business alone can justify, meaning the valuation embeds a transformation that has not yet occurred.
The four-step workflow, in sequence:
This methodology applies across categories:
The analyst EPS trajectory for Tesla itself illustrates why single-point estimates mislead for transitional companies. Forward estimates declined more than 90% from peak before recovering in projections, evidence of how dramatically earnings trajectories shift when the business model is evolving. Institutional sentiment post-Q1 2026 underscores the same point: ARK Invest and Baillie Gifford added millions of shares while Goldman Sachs maintained a neutral rating. The same quarterly data produced different conclusions because different scenario weightings were applied.
That divergence is not a failure of analysis. It is the correct output of honest scenario analysis applied to genuine uncertainty.
Tesla is not primarily a test of whether an investor believes in electric vehicles or artificial intelligence. It is a test of whether the probability of transformation embedded in the current share price is one worth underwriting at this entry point.
The methodology arc built through this article, standard multiples as diagnostic rather than verdict, scenario construction with probability weighting, sum-of-parts decomposition, and entry price as the integrating variable, applies wherever a stock is priced for a future that has not yet arrived.
The question for any high-multiple transitional stock is never simply: is this a good company? It is: what does the current price require to be true, and how confident is the investor in that specific set of conditions materialising?
This article is for informational purposes only and should not be considered financial advice. Investors should conduct their own research and consult with financial professionals before making investment decisions. Past performance does not guarantee future results. Financial projections are subject to market conditions and various risk factors.
Scenario-based stock valuation analysis models multiple plausible futures for a company, each with its own revenue growth, margin, and valuation multiple assumptions, then assigns probability weights to each outcome to produce a probability-weighted expected value rather than a single-point forecast.
Standard P/E ratios reflect only current or near-term earnings, but transitional companies like Tesla are priced for future business segments that do not yet generate meaningful revenue, making a single multiple misleading as a standalone valuation verdict.
Sum-of-parts valuation treats a single company as multiple distinct businesses, each valued with its own appropriate methodology, and is most useful when a company operates across segments with very different risk profiles, growth rates, and comparable peer groups.
Entry price is mathematically critical: at approximately $411 per share, Tesla's bear case produces negative returns even if the company remains a highly profitable EV manufacturer, because the current price already embeds the assumption that autonomous and robotics segments will succeed.
As of March 2026, Waymo generated approximately $355 million in annualised revenue from around 500,000 paid rides per week, providing a concrete operational baseline that investors can scale against Tesla's stated robotaxi ambitions to convert optimism into a testable revenue range.