
The Memo That Halved Meta’s AI Infrastructure Cost Estimate
9 hrs ago

Westpac shares fell 2.2% on 8 May 2026, steeper than the broader market’s 1.6% drop, even after the bank had posted a 3% rise in annual profit and declared a fully franked 77 cents per share dividend. That apparent contradiction is worth unpacking. The 5 May 2026 first-half FY2026 results landed during a volatile week shaped by ex-dividend mechanics, a softening financial sector, and renewed geopolitical pressure from the Middle East. For WBC shareholders and prospective buyers, separating the short-term noise from the structural signal matters. This analysis decodes the headline numbers, explains what CET1 and payout ratios actually signal about financial health, benchmarks Westpac against its big four peers, and assesses what the near-term catalysts mean for investors watching the share price.
The same result can tell two stories depending on which comparison an investor chooses. Westpac reported statutory net profit of $3.4 billion, up 3% on the first half of FY2025 but down 5% on the second half. That directional contrast is the single biggest reason different commentators are reaching different conclusions from the same set of numbers.
The core profit figures break down as follows:
CEO Anthony Miller attributed the result to balance sheet discipline, noting that the bank’s positioning amid global uncertainty reflected deliberate capital management rather than defensive contraction.
The half-on-half decline is the figure most likely driving immediate share price pressure. The year-on-year rise, underpinned by 7% volume growth across both lending and deposits, is the more structurally meaningful comparison for investors evaluating the earnings trajectory over a full cycle.
Business lending growth of 16% year-on-year sits behind the headline profit figure as one of the more operationally significant data points in the result, signalling that Westpac’s balance sheet expansion is not confined to the mortgage book but is broadening across commercial and institutional segments.
Two metrics sit at the centre of every bank result, and both answer the same question from different angles: is the institution strong enough to keep paying dividends while absorbing unexpected losses?
Common Equity Tier 1 (CET1) capital is the core financial buffer a bank holds against unexpected losses, expressed as a percentage of its risk-weighted assets. It represents the highest-quality capital a bank owns, primarily ordinary shares and retained earnings, and regulators require it to remain above minimum thresholds.
APRA’s capital adequacy standard APS 110 sets the minimum CET1 ratio for Australian authorised deposit-taking institutions at 4.5%, with an additional capital conservation buffer of 2.5%, bringing the effective minimum to 10.5% before any institution-specific buffers apply, which explains why Westpac’s 12.4% reading carries a meaningful surplus above the regulatory floor.
Westpac’s CET1 ratio of 12.4% sits comfortably above its internal target of 11.25% and well above APRA’s minimum requirement of 10.5% (plus applicable buffers). That approximately 115 basis point excess translates to roughly $2.7 billion in surplus capital above target. APRA’s framework broadly permits distributions where banks remain above their targets post-dividend, and Westpac satisfies that condition with room to spare.
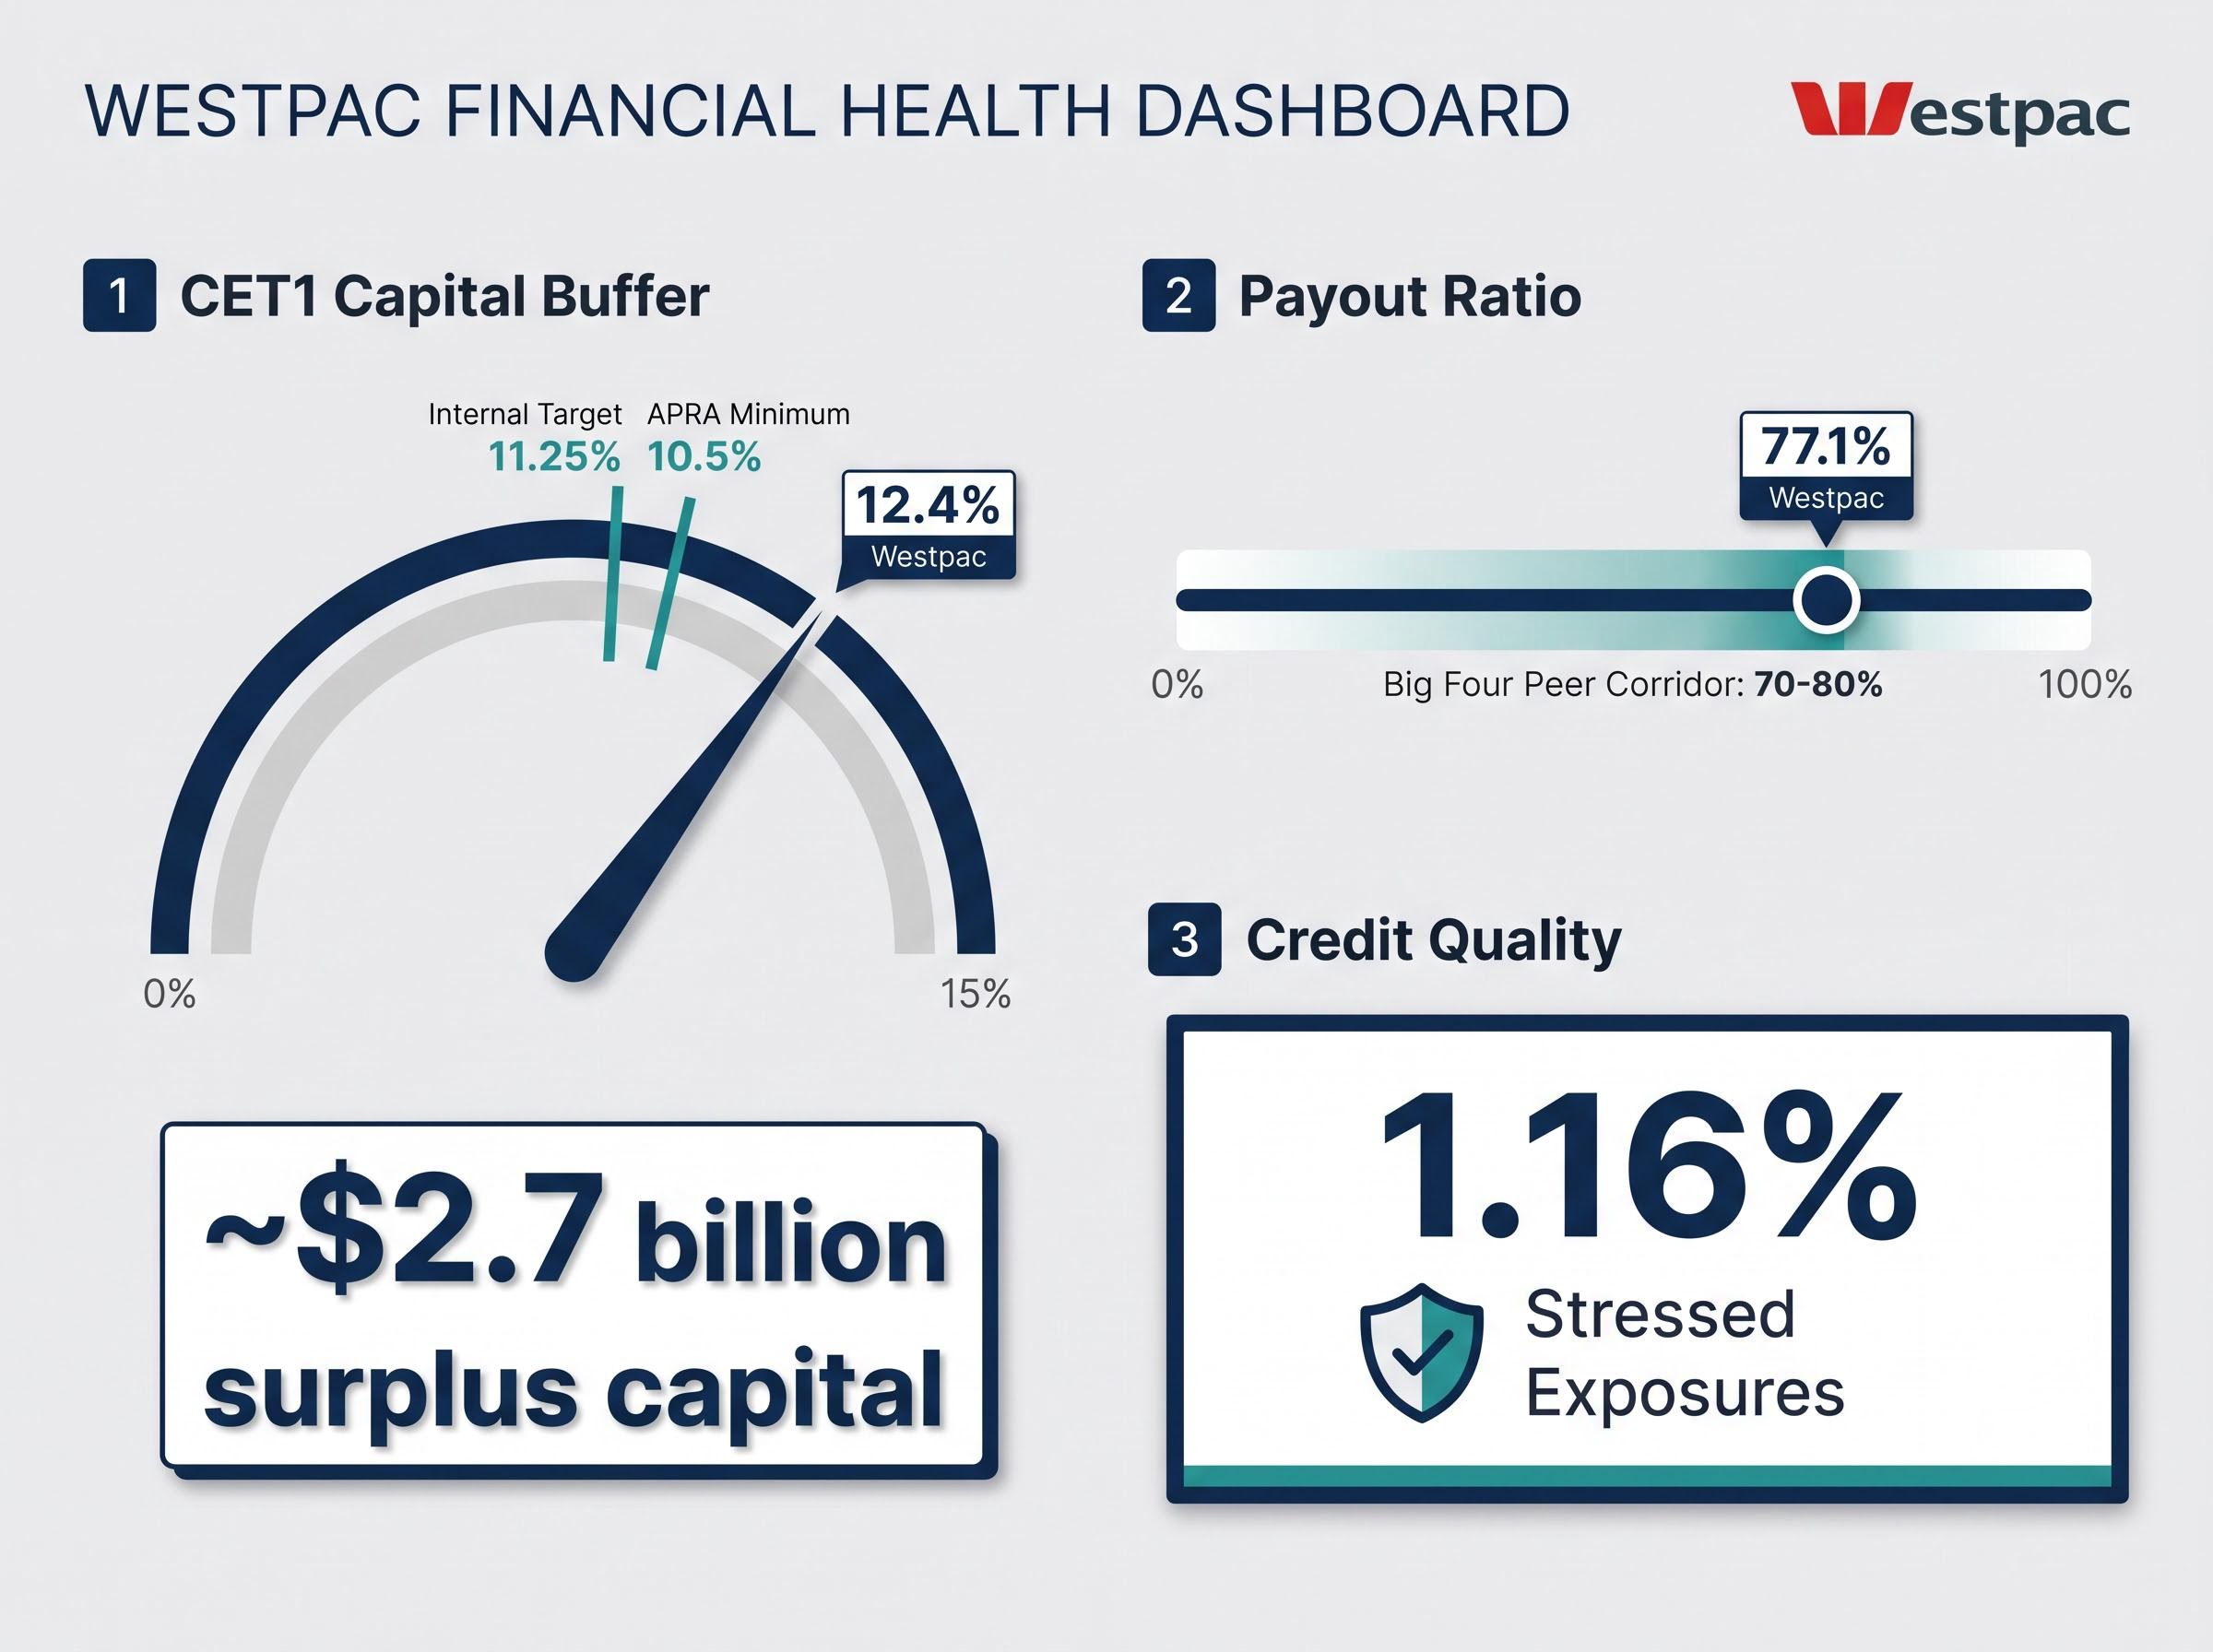
A payout ratio measures the proportion of earnings returned to shareholders as dividends. Westpac’s statutory payout ratio of 77.1% (75.6% excluding Notable Items) sits inside the 70-80% corridor the big four banks have broadly maintained in recent years.
| Metric | Westpac figure | Target / benchmark |
|---|---|---|
| CET1 ratio | 12.4% | 11.25% (internal target) |
| Payout ratio (statutory) | 77.1% | 70-80% (peer corridor) |
| Return on equity | 9.6% | Peer range: 10.1-13.0% |
| Stressed exposures | 1.16% | Low (sector baseline) |
Together, these metrics suggest the dividend is sustainable in the near to medium term. The primary vulnerability to dividend continuity is a material and sustained rise in unemployment, not the current capital or earnings picture.
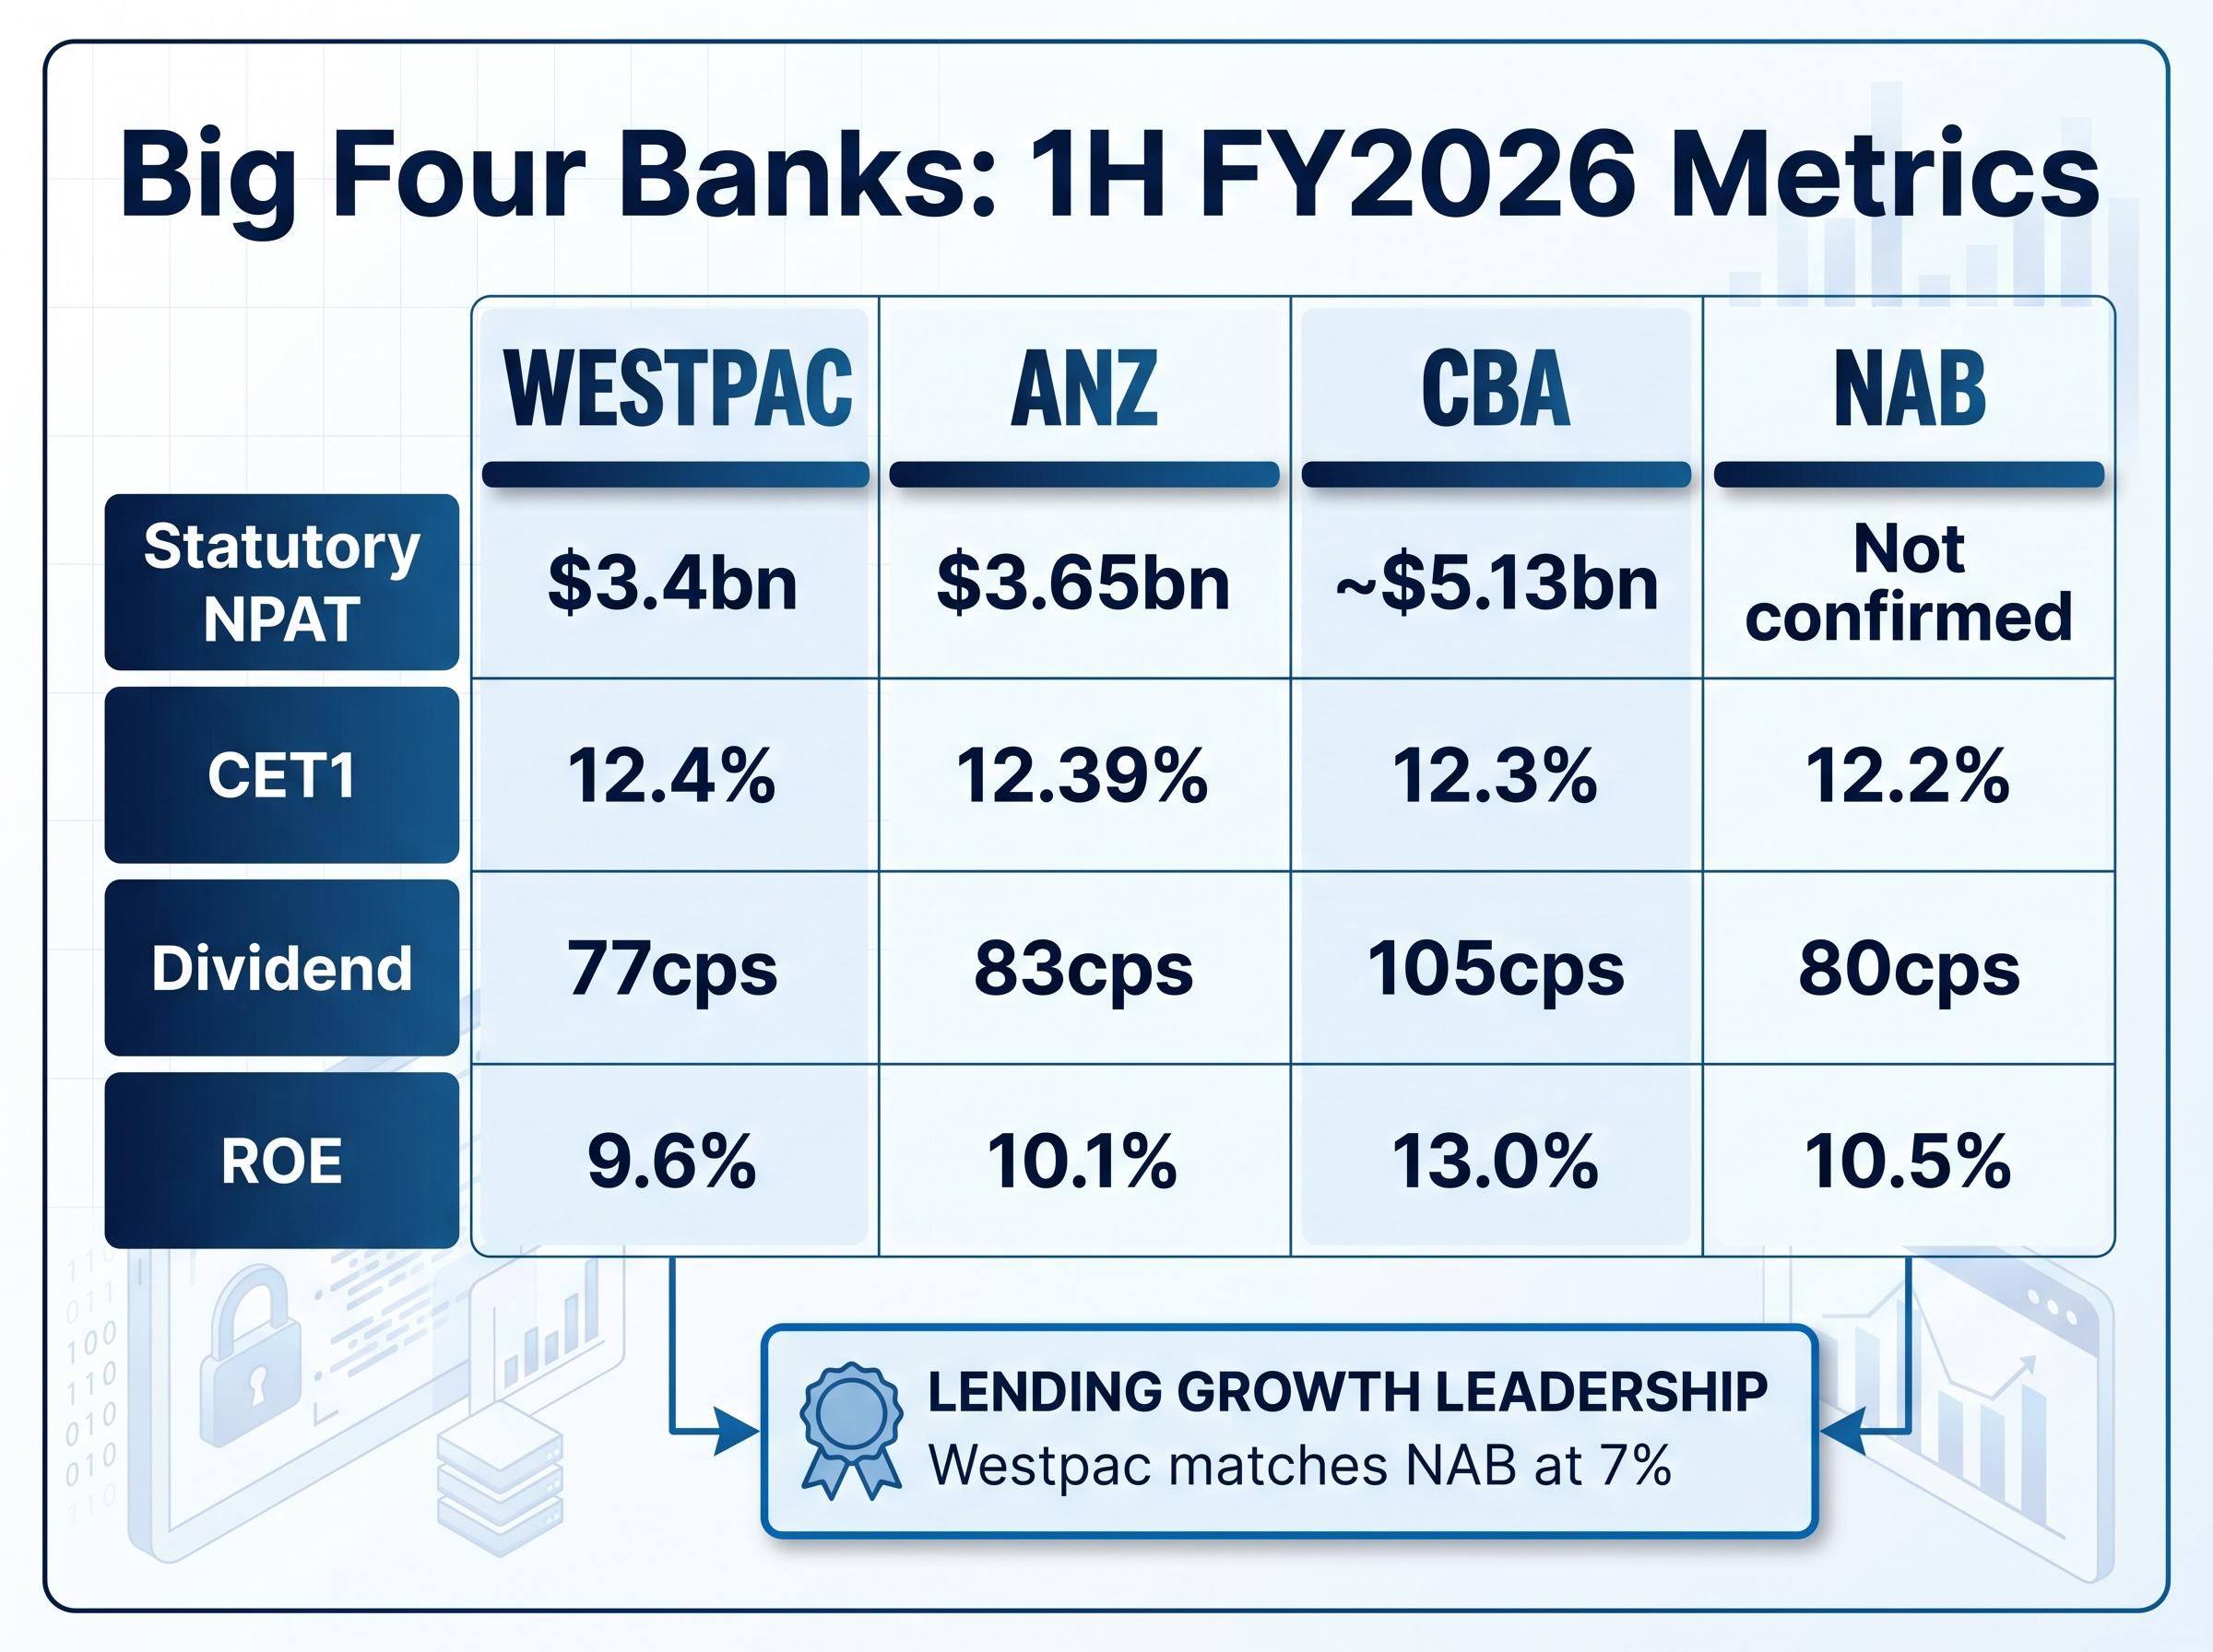
All four major banks reported first-half FY2026 results by early May 2026. The comparison reveals a sector-wide pattern rather than a Westpac-specific concern.
| Bank | Statutory NPAT | CET1 ratio | Interim dividend | ROE |
|---|---|---|---|---|
| Westpac | $3.4bn | 12.4% | 77cps | 9.6% |
| ANZ | $3.65bn | 12.39% | 83cps | 10.1% |
| CBA | ~$5.13bn | 12.3% | 105cps | 13.0% |
| NAB | Not confirmed | 12.2% | 80cps | 10.5% |
The Australian Financial Review described Westpac as broadly “in line” with peers, and impairment charges across the sector remained low at approximately 10 basis points. The key takeaways for WBC investors:
For a taxable Australian investor, the fully franked 77 cents per share dividend carries a franking credit that lifts its effective value.
At the post-result trading level of approximately $38.94, the grossed-up yield sits at approximately 4.0%, a figure that accounts for the franking credit component refundable or offsettable against personal tax liabilities for Australian resident shareholders.
The franking credit value attached to a fully franked dividend is not uniform across investor types; SMSF trustees in pension phase and low-tax retirees receive the credit as a refundable cash offset from the ATO, making the grossed-up yield a more accurate measure of total return than the face dividend alone.
The ex-dividend date of 8 May 2026 is a mechanical consideration. When a stock trades ex-dividend, the share price typically adjusts downward by approximately the dividend amount, meaning part of the day’s decline reflects this automatic repricing rather than any fundamental reassessment. Payment is scheduled for 26 June 2026.
On sustainability, the 77 cents represents a 1.3% reduction compared with the prior year’s interim dividend, a detail income-focused investors should note alongside the absolute payout. Three indicators support near-term dividend continuity:
The dividend appears sustainable in the short to medium term given the capital position. A material and sustained rise in unemployment remains the most credible risk to that assessment.
Three independent forces acted on Westpac’s share price on 8 May 2026, and conflating them produces a confused reading. In approximate order of magnitude:
Broker consensus targets present a counterpoint to the recent rally. Macquarie carries a Sell rating with a target of approximately $32-$35, J.P. Morgan holds a Sell target of $37.30, while UBS (Hold, $38-$40) and Citi (Hold, $39) sit closer to the current price. The average consensus target falls in the $34.96-$35.78 range, meaningfully below recent trading levels.
Over the past 12 months, Westpac shares have gained approximately 17%, outpacing the ASX 200’s 6.6% rise over the same period. The gap between that appreciation and where broker consensus sits is a tension investors will need to reconcile.
The RBA’s next meeting on 15-16 June 2026 is the most proximate catalyst for Australian bank shares. Implied market probability for a rate change sits at 26-35% across various scenarios, making a cut possible but far from certain.
The RBA’s May 2026 monetary policy decision and accompanying economic outlook statement set the context for any June meeting scenario, with the Board’s assessment of inflation trajectory and labour market conditions directly shaping the probability weighting investors assign to a further rate adjustment.
If delivered, a rate reduction would begin to relieve the net interest margin (NIM) compression that has been building through the rate rise cycle. NIM measures how efficiently a bank converts its lending activity into profit, and Westpac’s 14 basis point NIM reduction (excluding Markets activity) in 1H FY2026 is the metric to monitor. Australian bank shares have historically rallied 3-5% in the wake of RBA easing cycles, according to analyst estimates. That said, NIM recovery is neither automatic nor immediate following a cut; the speed of mortgage repricing versus deposit repricing determines whether the relief materialises. J.P. Morgan has flagged mortgage repricing tailwinds potentially supporting earnings into FY27.
Net interest margin compression is the direct transmission mechanism linking RBA rate decisions to bank earnings; when the cash rate rises faster than mortgage rates can be repriced upward, or when deposit competition intensifies to retain funding, the spread between what banks earn on loans and pay on deposits narrows, and Westpac’s 14 basis point NIM reduction in 1H FY2026 reflects exactly that dynamic.
The four items with the most direct read-through to Westpac’s earnings trajectory:
Stressed exposures at 1.16% remain low. A rise in this figure would serve as an early warning signal on credit quality ahead of any dividend reassessment.
The 1H FY2026 results confirmed several things investors needed to see: year-on-year profit growth, a capital buffer well above regulatory and internal targets, joint-strongest lending growth among the big four, and a dividend that remains sustainable on current settings.
What remains unresolved is the trajectory. NIM compression has not stabilised. Macro sensitivity, particularly to unemployment, could shift the credit quality picture. And the broker consensus average target of $34.96-$35.78 sits meaningfully below the recent trading price, implying the market has already priced in more optimism than the analyst community supports.
The gap between a 17% twelve-month share price gain and that consensus range is the tension at the heart of the Westpac investment case right now. The half-year result did not resolve it; it sharpened it.
The provisioning outlook across the big four is where the bear case acquires its most concrete form: Morgans projected total sector provisions rising from approximately $2.4 billion in FY25 to approximately $5.5 billion by FY27, a trajectory that would materially compress earnings and pressure dividend capacity if credit conditions deteriorate in line with that forecast.
This article is for informational purposes only and should not be considered financial advice. Investors should conduct their own research and consult with financial professionals before making investment decisions. Past performance does not guarantee future results. Financial projections are subject to market conditions and various risk factors.
CET1 (Common Equity Tier 1) is the core capital buffer a bank holds against unexpected losses, expressed as a percentage of risk-weighted assets. Westpac's CET1 ratio of 12.4% sits well above APRA's effective minimum of 10.5% and its own internal target of 11.25%, providing approximately $2.7 billion in surplus capital that supports dividend sustainability.
Three forces drove the decline: a sector-wide ASX financial selloff of 2.3%, a mechanical ex-dividend price adjustment reflecting the 77-cent per share dividend, and some investor selling in response to the half-on-half profit decline of 5%. The year-on-year profit figure was actually up 3%.
Because the 77-cent interim dividend is fully franked, Australian resident shareholders receive an additional tax credit representing corporate tax already paid. At a trading price of approximately $38.94, this lifts the grossed-up yield to around 4.0%, making the effective return higher than the face dividend yield alone.
Westpac's CET1 ratio of 12.4% is the highest among the big four, and its lending growth of 7% matches NAB as joint strongest, but its return on equity of 9.6% is the lowest of the group and its statutory profit of $3.4 billion is well below CBA's approximately $5.13 billion.
The most important near-term catalyst is the RBA's June 2026 meeting, where a rate cut could relieve net interest margin pressure that compressed by 14 basis points in 1H FY2026. Investors should also monitor Q2 GDP and labour market data, stressed exposure levels, and progress on Westpac's cost simplification programme.


