Barclays Warns of Prolonged Market Volatility Under New Fed Reality
Jun 27, 2026

Brent crude shed approximately 7.6% in a single session on 7 May 2026, one of the sharpest single-day oil selloffs since the Iran conflict began. The trigger was not a supply shock but the prospect of peace.
Reports that Washington and Tehran are closing in on a one-page memorandum of understanding sent energy markets into retreat, with Brent falling from roughly $116.55 per barrel to approximately $101.88. At the same time, the diplomatic signal ignited a broad rally across gold, industrial metals, uranium, and mining equities. The divergence was sharp, immediate, and instructive about how financial markets price geopolitical risk in real time.
What follows unpacks the specific terms of the reported US-Iran memorandum, explains the mechanics behind the oil selloff, walks through the inverse commodity dynamic that played out across asset classes, and examines what a confirmed deal, or its collapse, means for commodity investors in the weeks ahead.
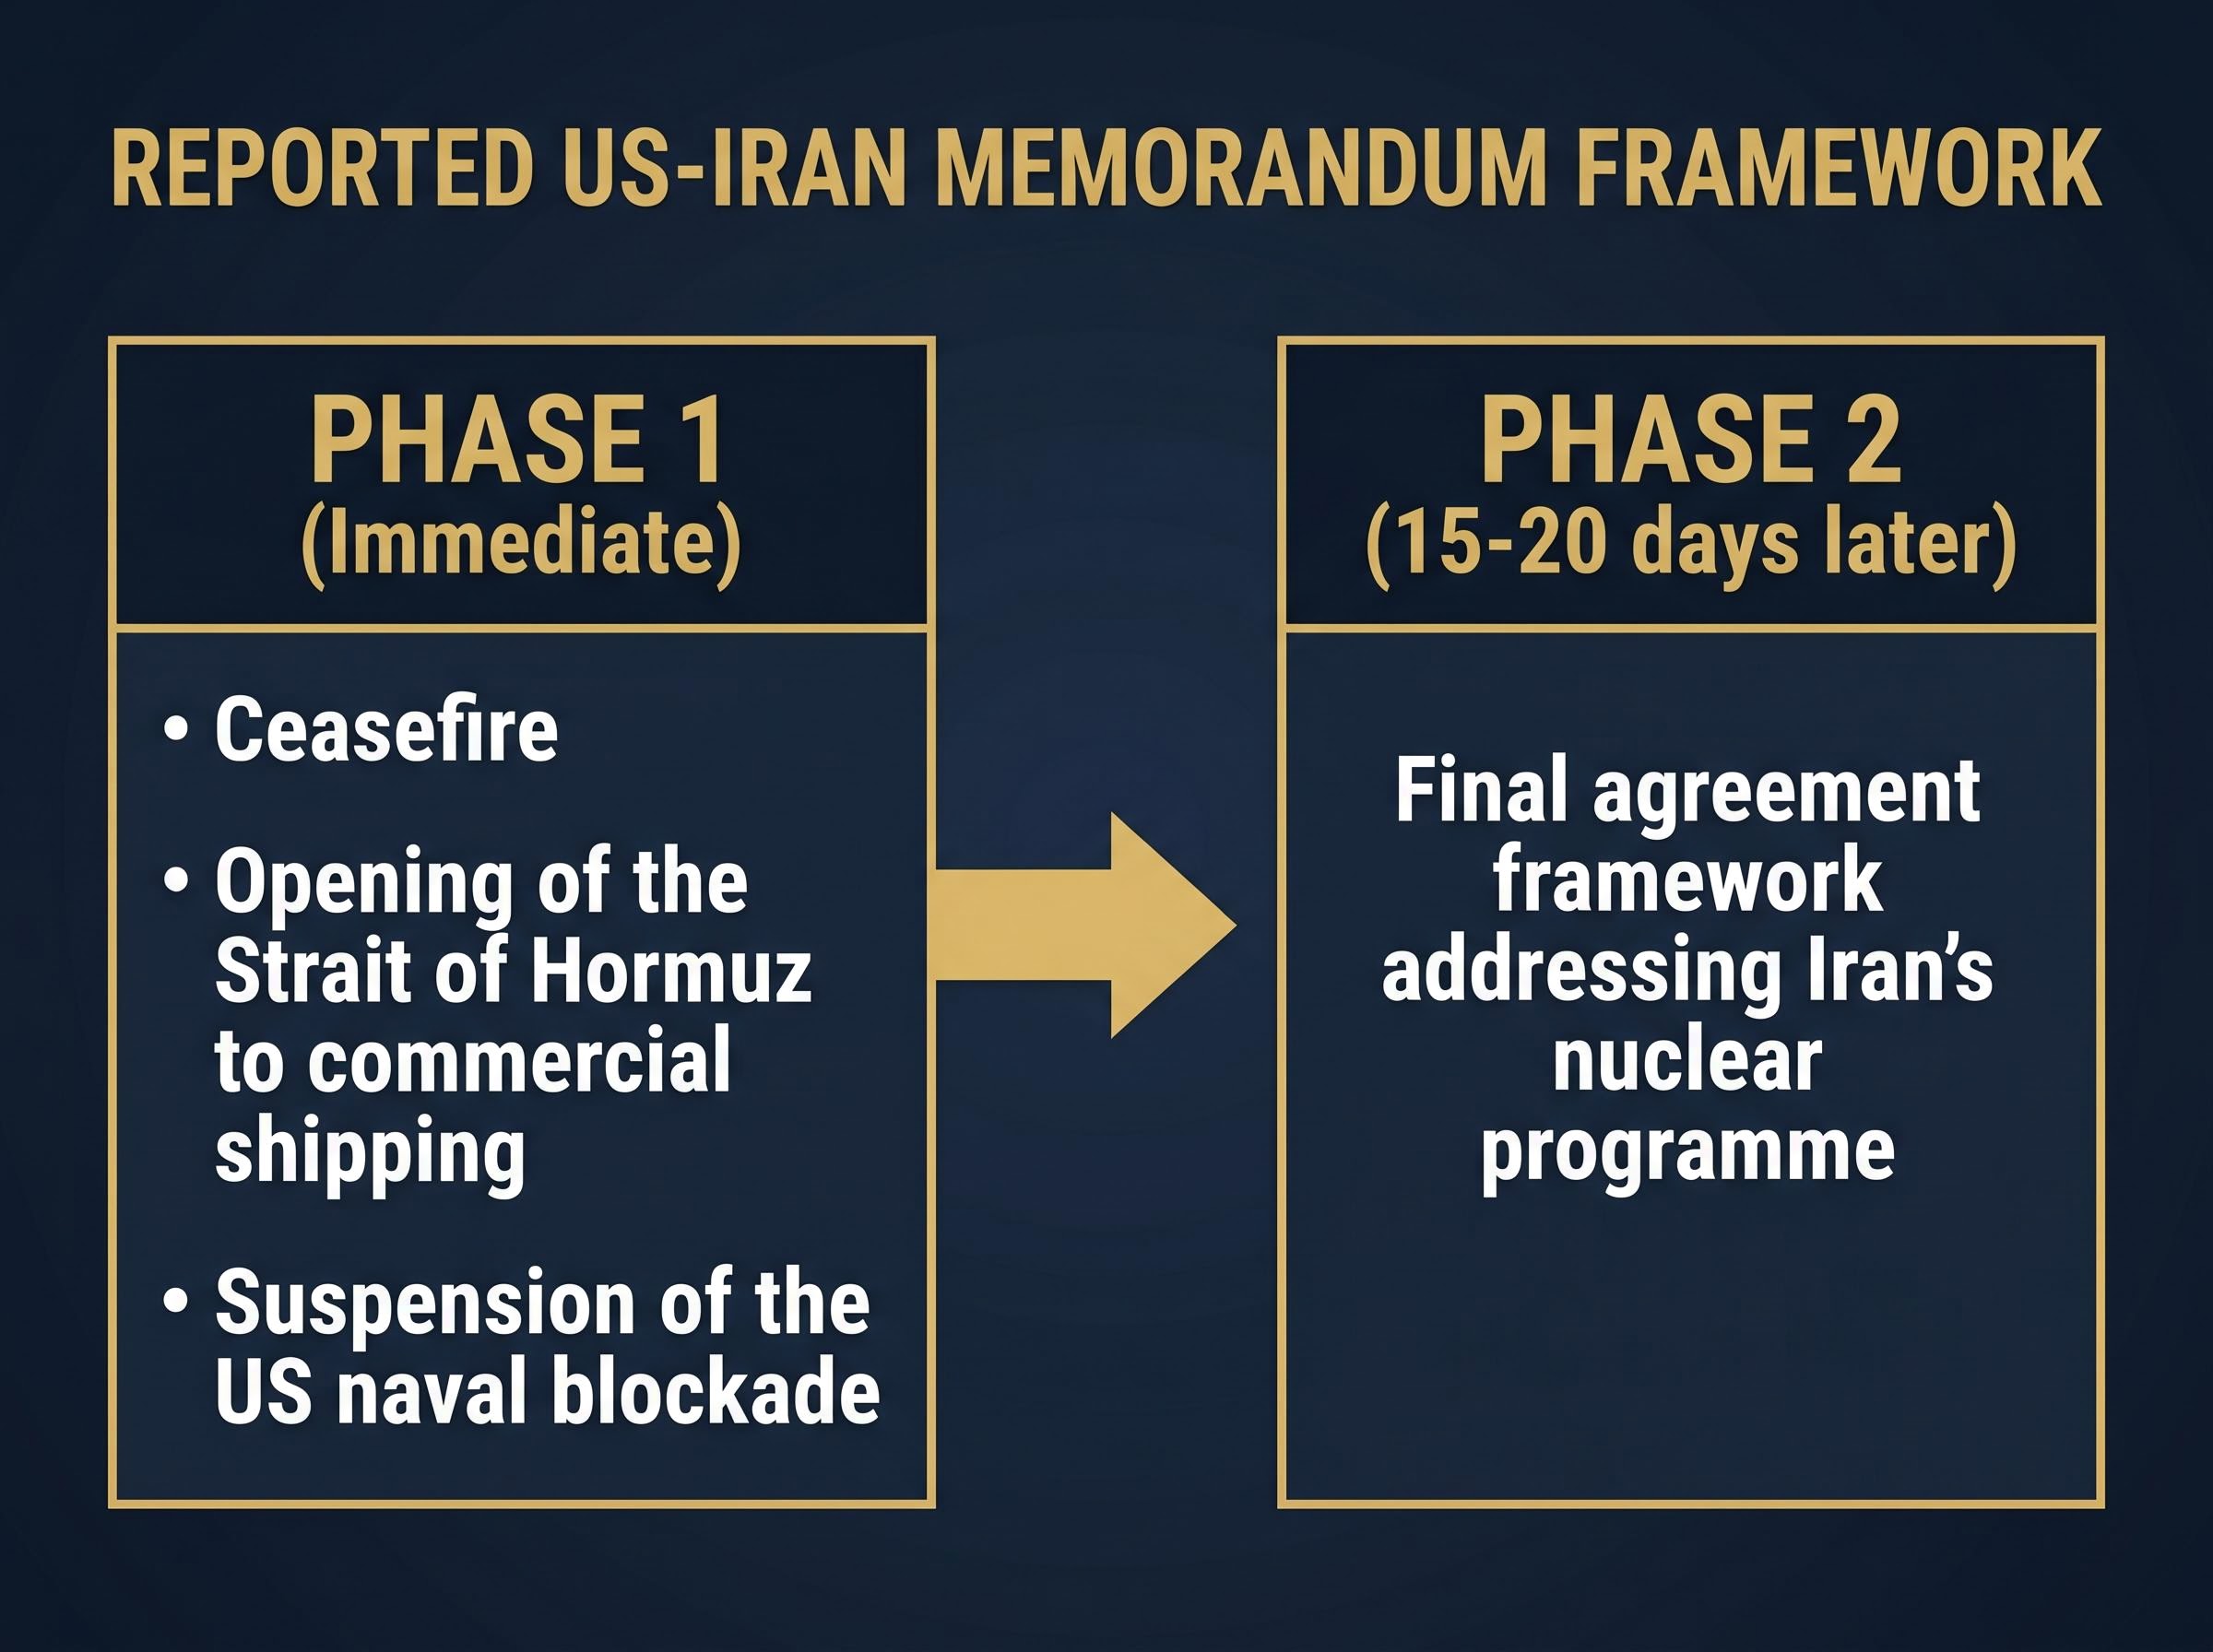
The framework under discussion is a single-page memorandum of understanding, reported by Axios on 7 May 2026, with the White House awaiting Iran’s formal response as of 6 May. The document proposes a phased resolution to the conflict, though no full text has been publicly confirmed.
Iran’s two-phase structure works as follows:
The 3 May breakthrough removed a structural obstacle that had stalled earlier rounds. Tehran agreed to include its nuclear file in the talks, dropping a precondition that had kept the two sides apart. Prior to this, Trump had expressed dissatisfaction on 28 April with proposals that delayed nuclear deal components, according to Reuters.
Saudi Arabia called for de-escalation on 5 May following US-Iran clashes, according to France 24, adding regional diplomatic weight to the negotiations. Trump suspended the “Project Freedom” naval escort mission through the Strait of Hormuz as a confidence-building measure while keeping port blockades active.
Trump warned that military action would resume “at greater intensity” if Iran declined the proposed terms, a reminder that the diplomatic window carries an explicit expiration date.
The deal’s fragility is the point. Markets are pricing a specific phased scenario, not a generic peace outcome. If Phase 2 nuclear talks collapse or Iran’s formal response introduces new conditions, the repricing described below would rapidly reverse.
The Strait of Hormuz is the world’s most concentrated oil chokepoint, and its potential reopening under Phase 1 struck directly at the geopolitical premium embedded in crude prices since the conflict began. Traders were not reacting to barrels arriving on the market; they were repricing the probability that barrels would flow freely again.
The timing compounded the move. OPEC had already announced a 188,000 barrels-per-day output increase for June, decided on 3 May according to CNBC. The diplomatic signal landed on a market already absorbing additional supply.
Brent’s 7.6% decline was reported as the second-largest single-session drop since the onset of the Iran conflict.
| Asset | Pre-Deal Price | Post-Deal Price | Change (%) |
|---|---|---|---|
| Brent Crude | $116.55/barrel | $101.88/barrel | -7.6% |
| WTI Crude | — | $96.21/barrel | -5.75% |
| US Energy Sector ETF | — | — | -4.07% |
The scale of the move reflects how much war premium had been structurally baked into energy prices. Investors holding energy-heavy portfolios should note that this repricing can reverse just as suddenly; the deal terms remain unconfirmed.
Brent’s intraday spike above $125 on 30 April 2026, its highest level in approximately four years, established the ceiling from which the 7 May selloff originated; understanding the scale of that prior surge is what makes the single-session 7.6% decline so significant as a geopolitical repricing event.
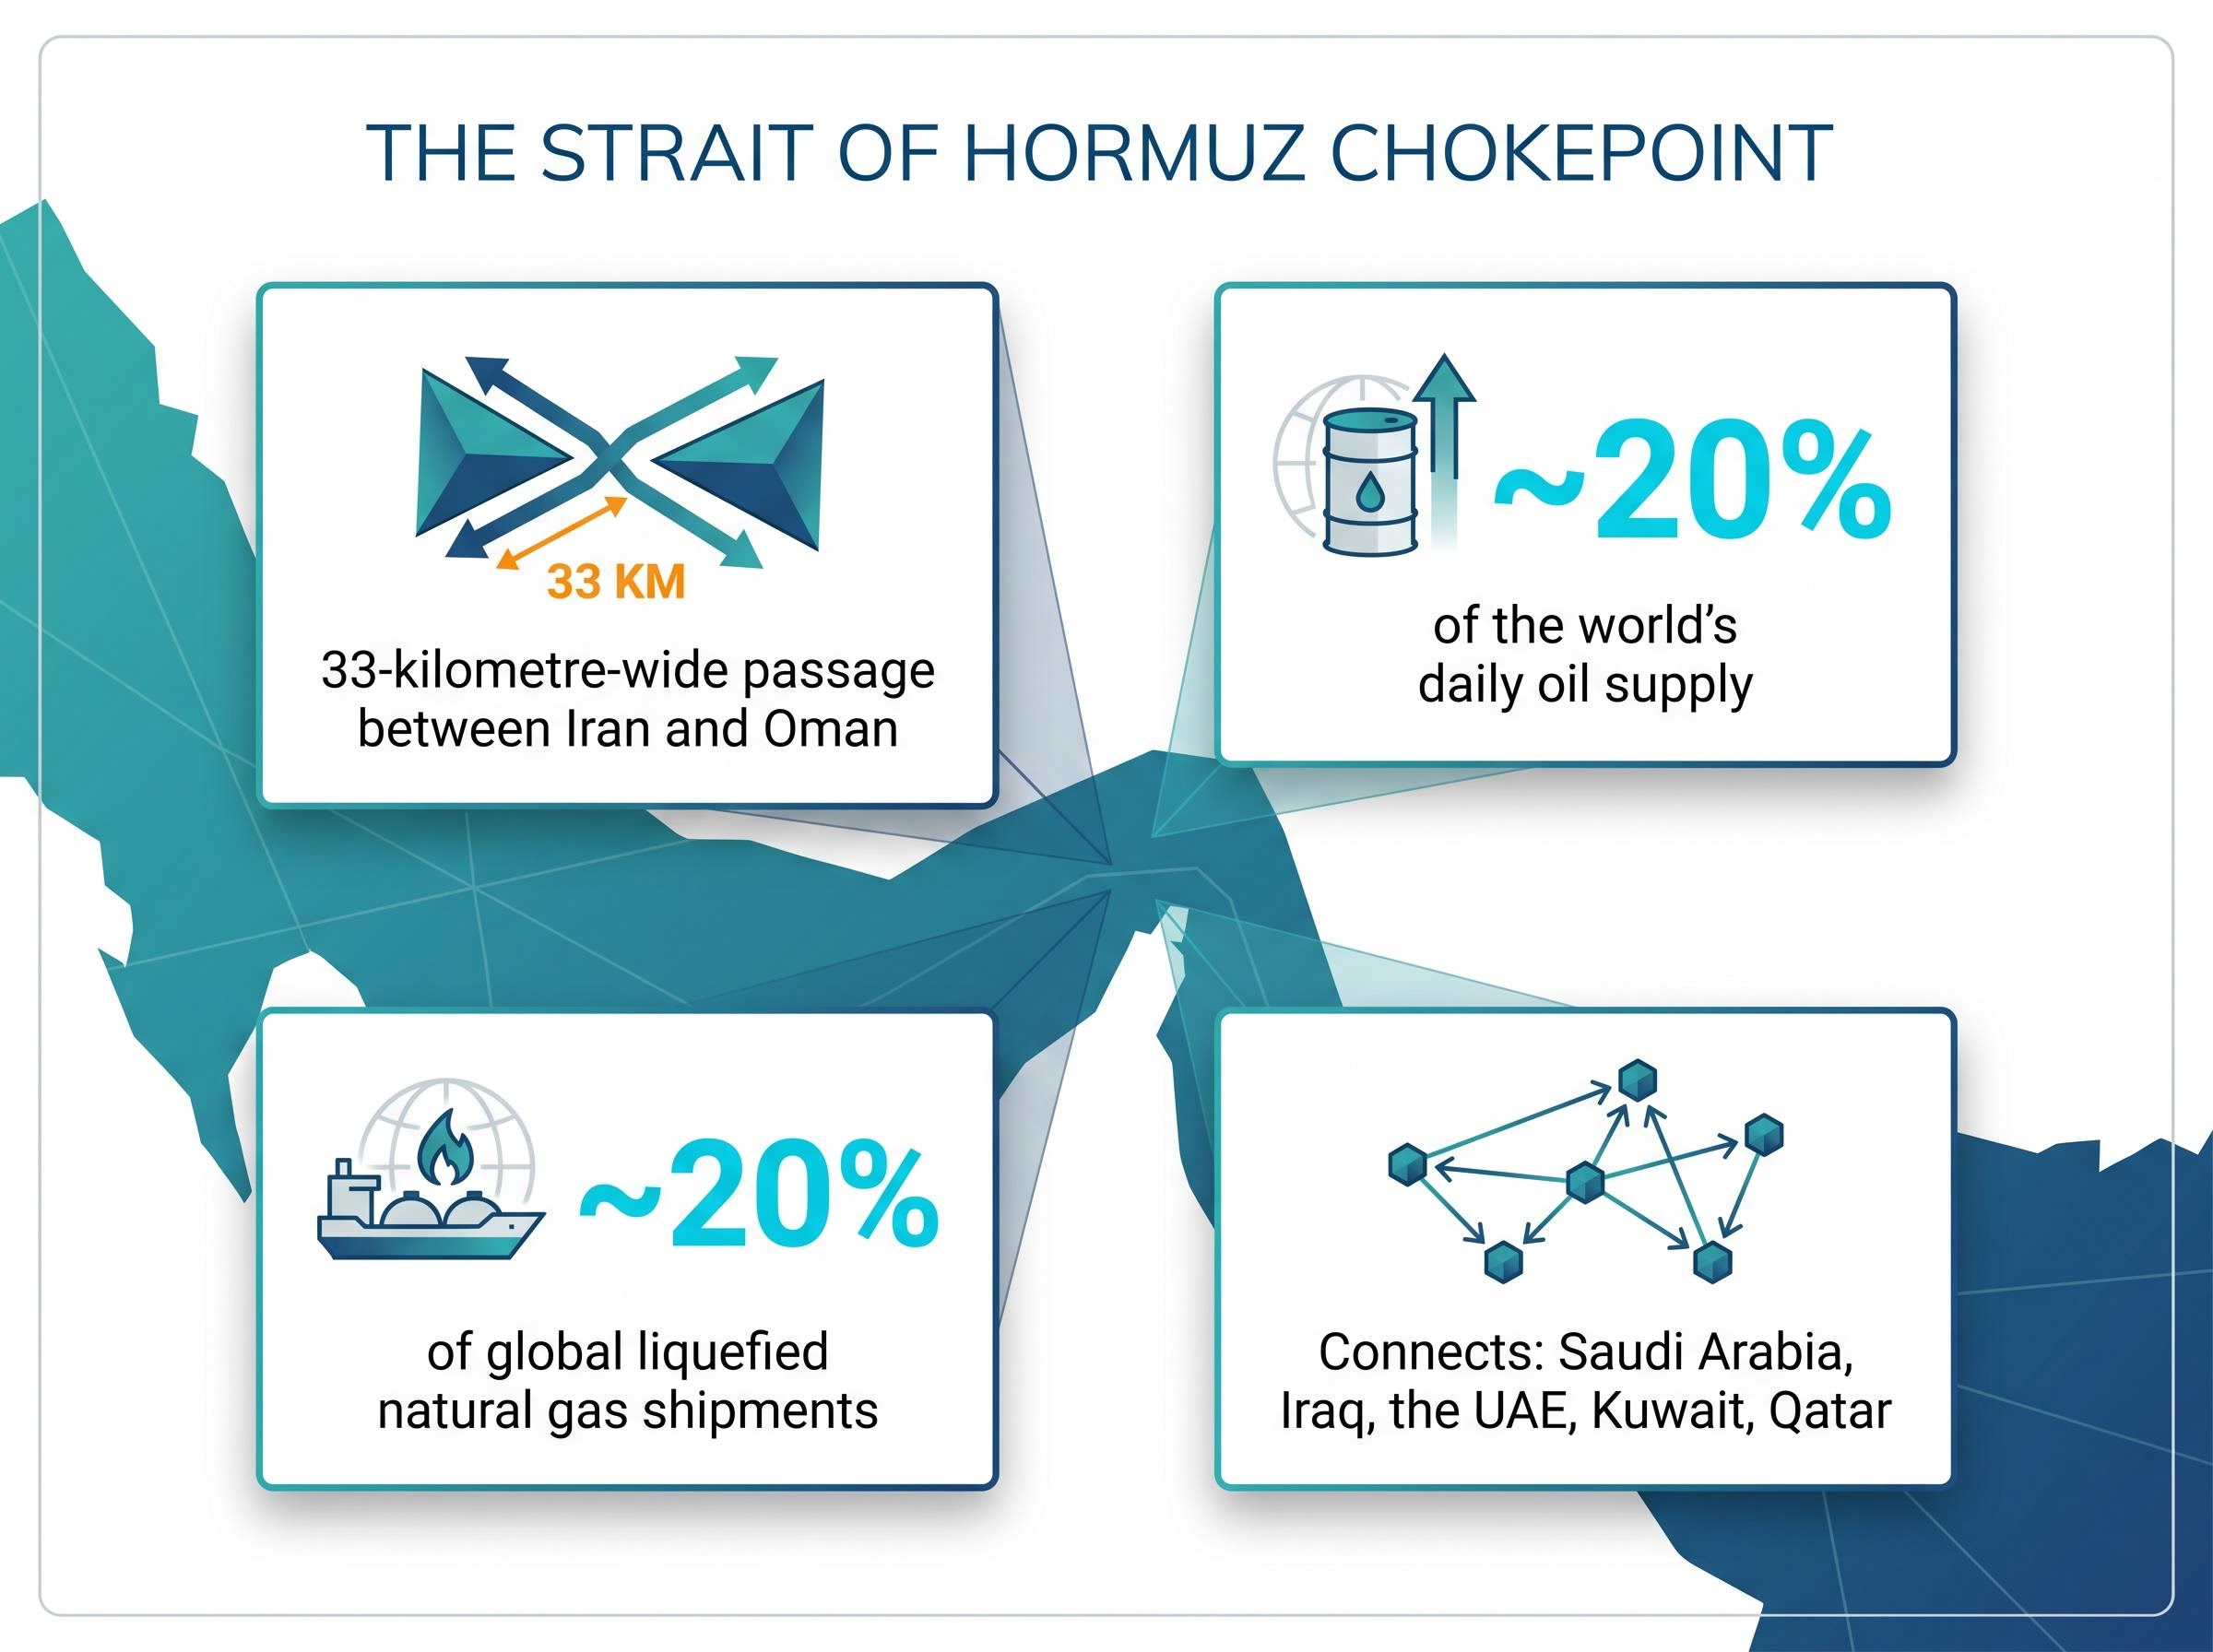
The Strait of Hormuz is a 33-kilometre-wide passage between Iran and Oman. It is the single most consequential bottleneck in global energy supply.
The Iran conflict turned this geography into a live risk. Iranian threats to close the strait, combined with US naval escort operations under “Project Freedom,” embedded a structural risk premium into every barrel priced globally. Shipping insurance rates climbed. Tanker operators rerouted. The cost of moving oil through the region increased even before any physical closure occurred.
The war premium embedded in crude prices was not simply a function of the blockade; it reflected a Hormuz triple lock combining the US naval operation, Iranian toll enforcement on non-US and non-Israeli vessels, and the near-total withdrawal of commercial war risk insurance, each mechanism compounding the others in ways that kept physical shipping costs elevated even when barrel volumes partially resumed.
Project Freedom was the US naval escort mission tasked with ensuring safe passage through the Strait of Hormuz during the conflict. Trump’s decision to suspend the mission while keeping port blockades active served a dual function: it reduced the immediate risk of a naval confrontation while signalling to Tehran that Washington was prepared to de-escalate operationally, not just rhetorically.
This context explains why a diplomatic headline, not an actual barrels-on-market event, moved oil prices by nearly 10%. Markets price probability distributions, not confirmed outcomes. The Hormuz premium was large enough that credible negotiating progress alone was sufficient to trigger a repricing.
Federal Reserve Bank of Dallas research on geopolitical risk in oil markets models how conflict signals and uncertainty distribute across crude prices, finding that probability-weighted peace or escalation scenarios can shift oil valuations significantly before any physical supply change occurs.
Oil fell because a specific geopolitical supply risk was being removed. Everything else rose because the same peace signal implied reduced inflation risk, lower energy input costs for industrial producers, and a broader risk-on rotation across asset classes.
Gold’s rise alongside peace talks appears counterintuitive on the surface. Gold typically gains on risk and retreats on calm. In this case, gold’s move reflected the ongoing US dollar weakness and a decline in Treasury yields that accompanied the session. The US 10-year Treasury yield fell to 4.356%, down 1.36% on the day, providing a tailwind for non-yielding assets.
Gold’s behaviour in the 7 May session fits within a broader pattern of safe haven asset mechanics breaking down during supply-shock crises: gold lost 12.2% in March 2026 alone before recovering as dollar weakness and falling Treasury yields, rather than pure risk-off demand, became the primary driver of its price, which is why the metal’s 3.2% gain on 7 May reflected monetary conditions rather than a conventional flight-to-safety bid.
Mining equity ETFs outperformed their underlying commodities by a wide margin, a leveraged beta effect where equity prices amplify spot commodity moves.
The Gold Miners ETF surged 7.73% to 92.44, more than double the 3.2% gain in spot gold, illustrating how mining equities magnify underlying commodity price movements in both directions.
| Asset / ETF | Type | Move (%) | Price Level |
|---|---|---|---|
| Spot Gold | Commodity | +3.2% | $4,703.09/oz |
| Gold Miners ETF | Equity ETF | +7.73% | 92.44 |
| Copper | Commodity | +3.4% | $6.19/lb |
| Copper Miners ETF | Equity ETF | +6.85% | 83.57 |
| Uranium ETF | Equity ETF | +7.49% | 58.26 |
Silver ETF gained 6.40%, Strategic Metals ETF rose 5.02%, Steel ETF added 3.66%, and Lithium and Battery Tech ETF climbed 3.47%. The pattern was consistent: mining equities delivered returns two to three times the magnitude of their underlying commodity moves. That leverage works identically in reverse if talks collapse.
The session’s optimism priced a clean path to a deal. The regional picture is messier.
Iran had made a ceasefire in the Israel-Hezbollah conflict a stated precondition for resumed peace talks. Whether this condition was formally set aside as part of Tehran’s 3 May softening remains unclear. The Israeli strike complicates the picture regardless, giving Iranian hardliners a reason to argue the precondition has not been met.
Pakistan’s broader Middle East peace-brokering efforts have also been complicated by the Beirut action.
Commodity investors now face a binary risk scenario. A confirmed MOU likely sends oil below $100 and sustains the metals rally. A breakdown in talks, particularly if the Lebanon dimension derails Iran’s participation, would reverse both moves sharply.
The market has already repriced a large portion of the geopolitical premium based on diplomatic progress alone. Further upside in non-energy commodities and further downside in oil require the deal to actually close, with Phase 1 deliverables implemented on the ground.
Three specific signals should update the investor view in the coming days:
The commodity moves did not occur in isolation. The S&P 500 closed at a record 7,365 (up 1.46%), the Nasdaq Composite reached 25,839 (up 2.02%), and the Korea Kospi surged 6.45% on reopening after a public holiday. ASX 200 futures rose 95 points (1.08%) as of 8:30 am AEST on 7 May, driven by resources and airline tailwinds. The US Global Jets ETF gained 4.53%, reflecting airlines’ direct benefit from lower fuel costs. BHP closed 3.0% higher on the prior session, reaching a two-month chart high.
The S&P 500’s record close at 7,365 signals how broadly the peace prospect registered across risk assets, well beyond commodities alone.
The session’s moves are a preview of the portfolio reshaping a confirmed deal would trigger at scale: energy rotation out, industrials, materials, and airlines rotation in. Investors who track the specific signals above will be better positioned to act ahead of the broader market, rather than react to it.
For investors who want a structured framework for acting on these signals without falling into reactive trading, our comprehensive walkthrough of geopolitical risk investing strategy examines the behavioural biases that cost retail investors most during high-attention geopolitical events, draws on historical S&P 500 outcomes across three prior periods when oil crossed $100 per barrel, and outlines the specific questions investors should ask before repositioning around any single diplomatic headline.
This article is for informational purposes only and should not be considered financial advice. Investors should conduct their own research and consult with financial professionals before making investment decisions. These forward-looking statements regarding deal outcomes and commodity price movements are speculative and subject to change based on diplomatic developments, regional security conditions, and market dynamics.
The memorandum of understanding is a reported one-page framework brokered between Washington and Tehran proposing a two-phase resolution: an immediate ceasefire and reopening of the Strait of Hormuz in Phase 1, followed by a nuclear programme agreement in Phase 2 approximately 15-20 days later.
Oil fell nearly 7.6% because the Strait of Hormuz, which carries approximately 20% of the world's daily oil supply, was potentially set to reopen under Phase 1, removing the large geopolitical war premium that had been embedded in crude prices since the conflict began; the move was compounded by OPEC announcing a 188,000 barrels-per-day output increase for June.
The diplomatic signal triggered a broad rally in gold, copper, uranium, and mining equities, driven by falling Treasury yields, US dollar weakness, and a risk-on rotation; mining equity ETFs outperformed their underlying commodities by two to three times, with the Gold Miners ETF gaining 7.73% compared to a 3.2% rise in spot gold.
Investors should monitor three key developments: Iran's formal response to the one-page MOU, confirmation that Phase 1 deliverables (Hormuz shipping resumption and US blockade suspension) have been implemented, and whether the Lebanon ceasefire remains stable given Iran's stated precondition linking it to the talks.
If negotiations break down, particularly if the Lebanon dimension derails Iran's participation or Phase 2 nuclear talks fail, oil prices would likely reverse sharply back toward prior highs while the gains in gold, metals, and mining equities would rapidly unwind.