Cook Warns Memory Costs Will Force Apple Price Increases in 2026
1 hr ago
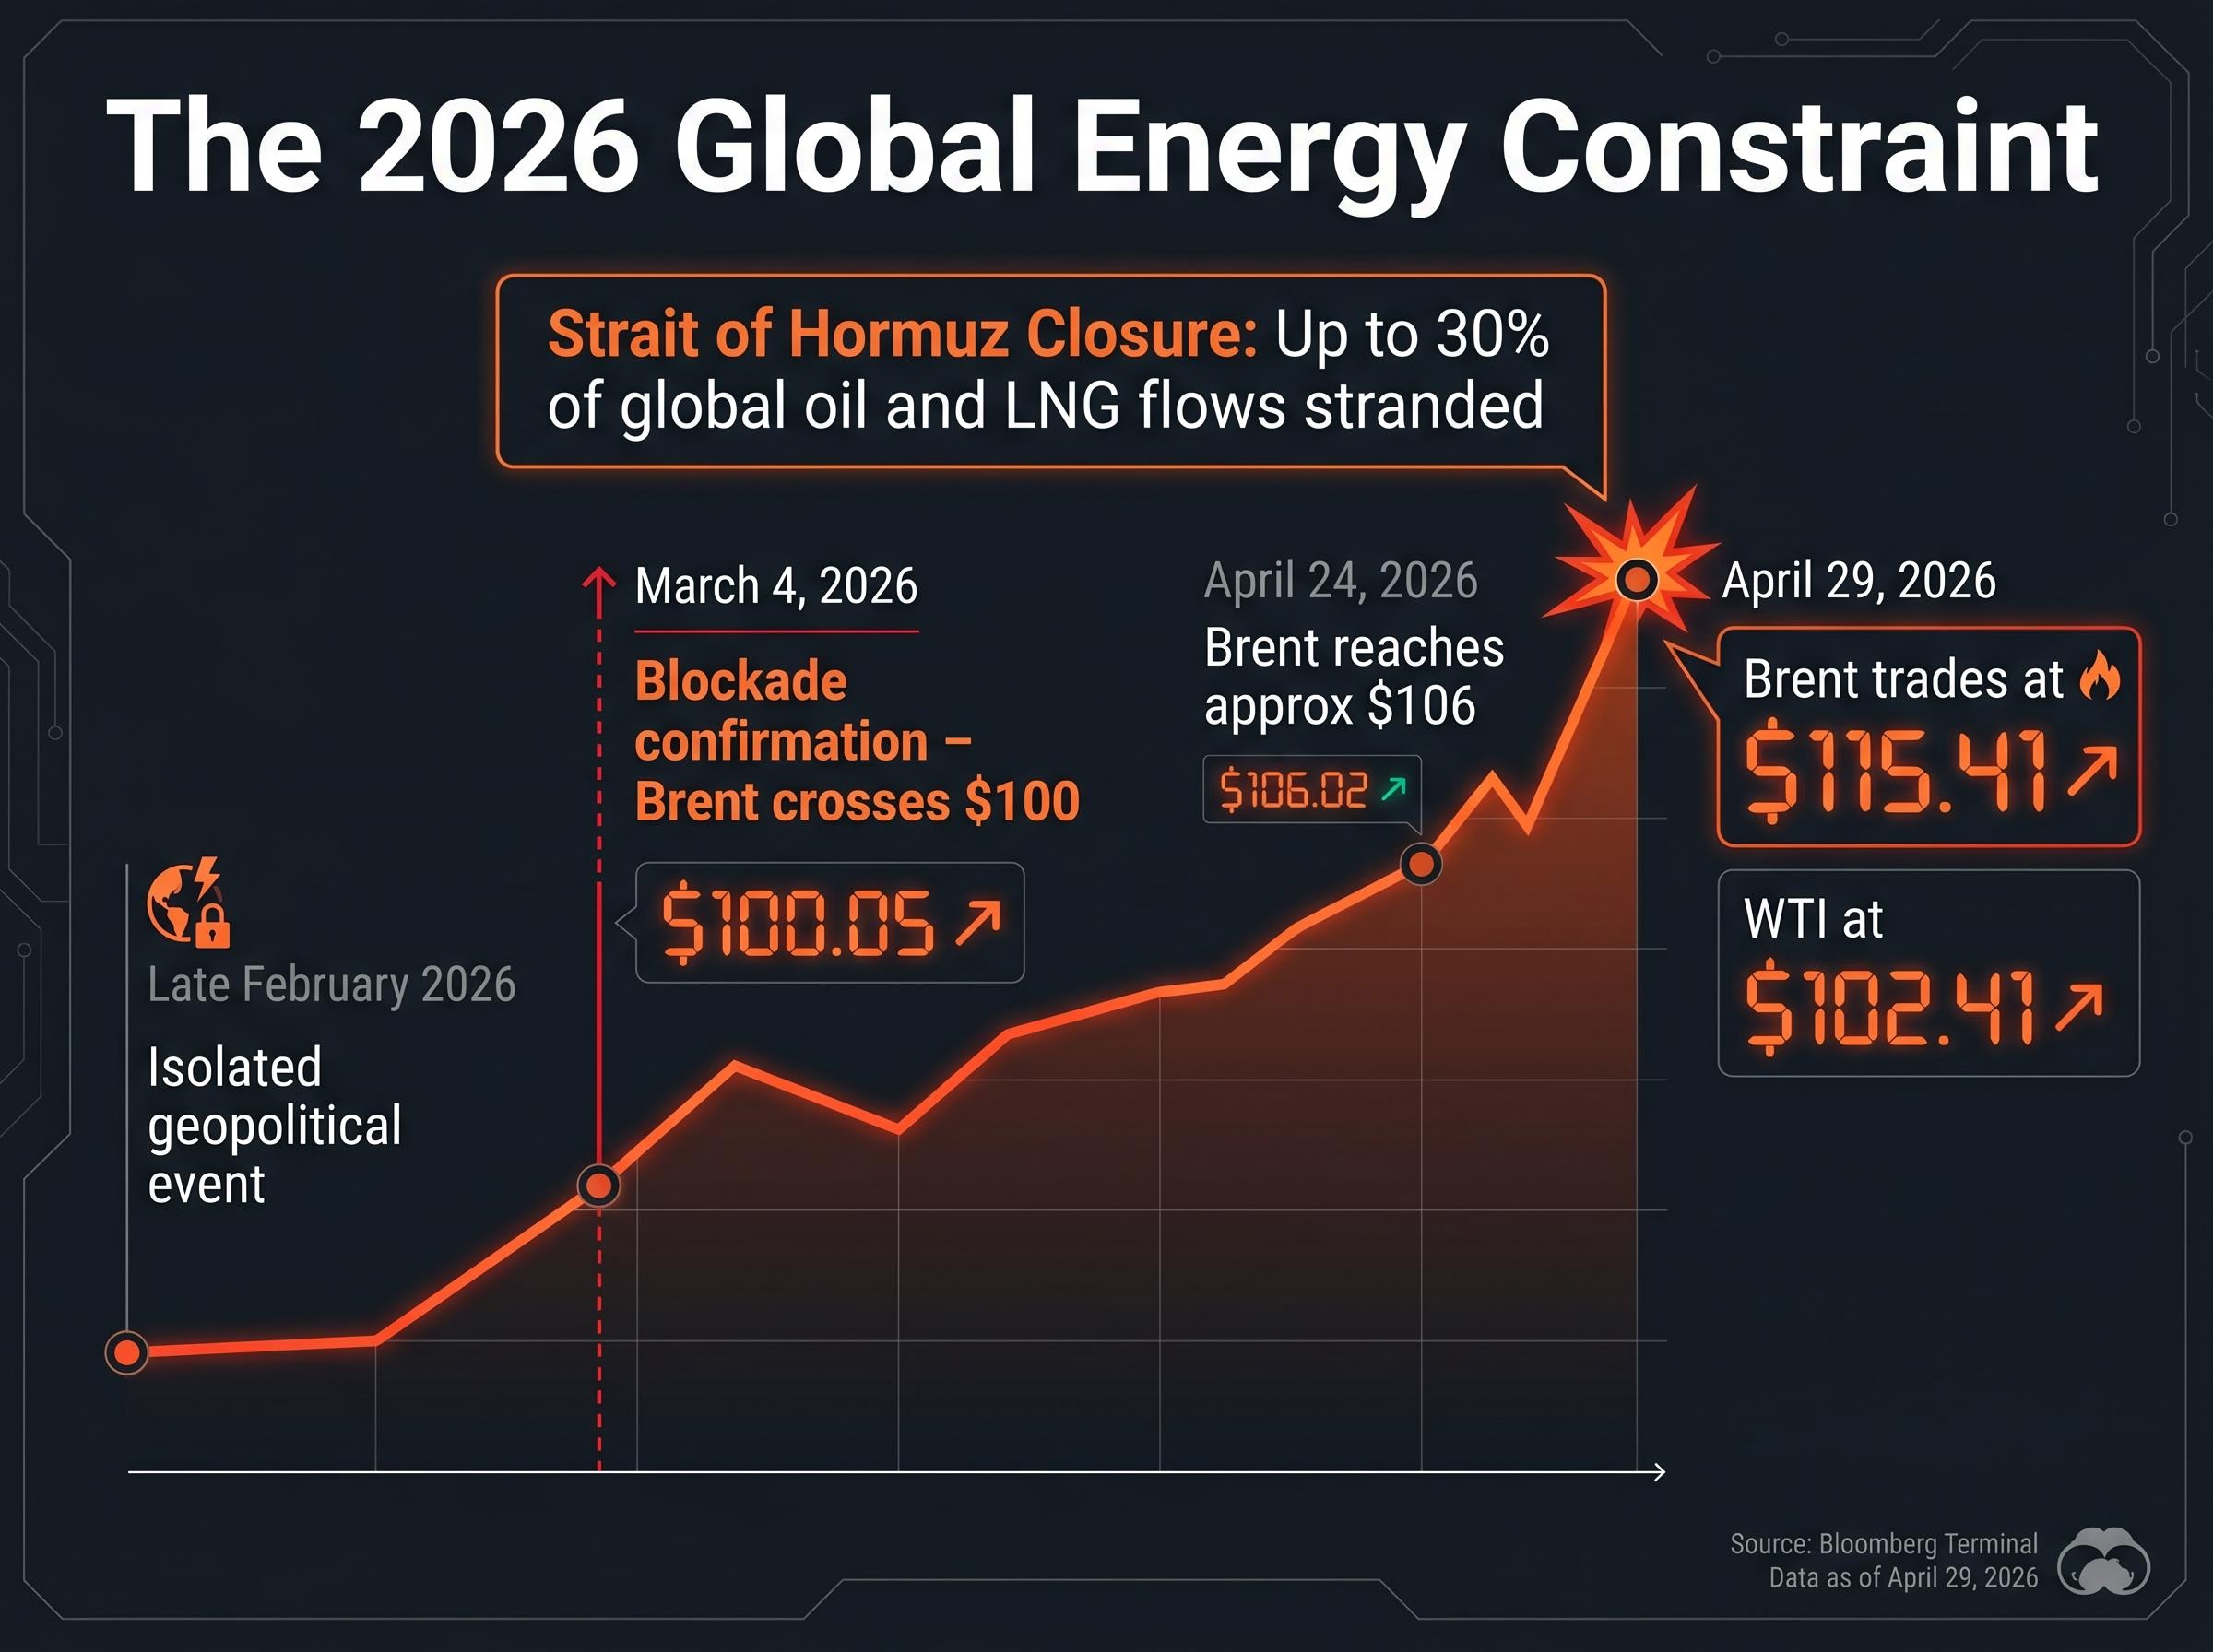
The unprecedented closure of the Strait of Hormuz in April 2026 has stranded up to 30% of global oil and liquefied natural gas flows. This bottleneck has triggered the most severe energy supply shock in modern history. As the regional conflict involving Iran deepens into a persistent stalemate, the resulting geopolitical disruption has fundamentally broken traditional macroeconomic assumptions.
Investors seeking reliable safe haven assets are discovering that the defensive strategies which protected portfolios over the last two decades are failing. These historical allocations are buckling under the weight of physical commodity shortages. This dynamic forces a complete reassessment of capital protection mechanics across all major markets.
Financial market resilience now depends entirely on exposure to energy independence and hard assets. The sheer scale of this shipping bottleneck requires a layered analytical approach. Investors must understand exactly why standard monetary crisis responses no longer apply to modern portfolios.
The crisis progressed rapidly from an isolated geopolitical event in late February 2026 to a permanent structural blockage by the end of April 2026. This sudden strangulation of critical shipping lanes fundamentally altered global trade, pushing international energy benchmarks to levels that threaten major economic contractions. The market has realised this is not a temporary geopolitical risk premium, but a sustained physical deficit.
The sheer volume of stranded energy has dictated staggering price surges across all major crude contracts.
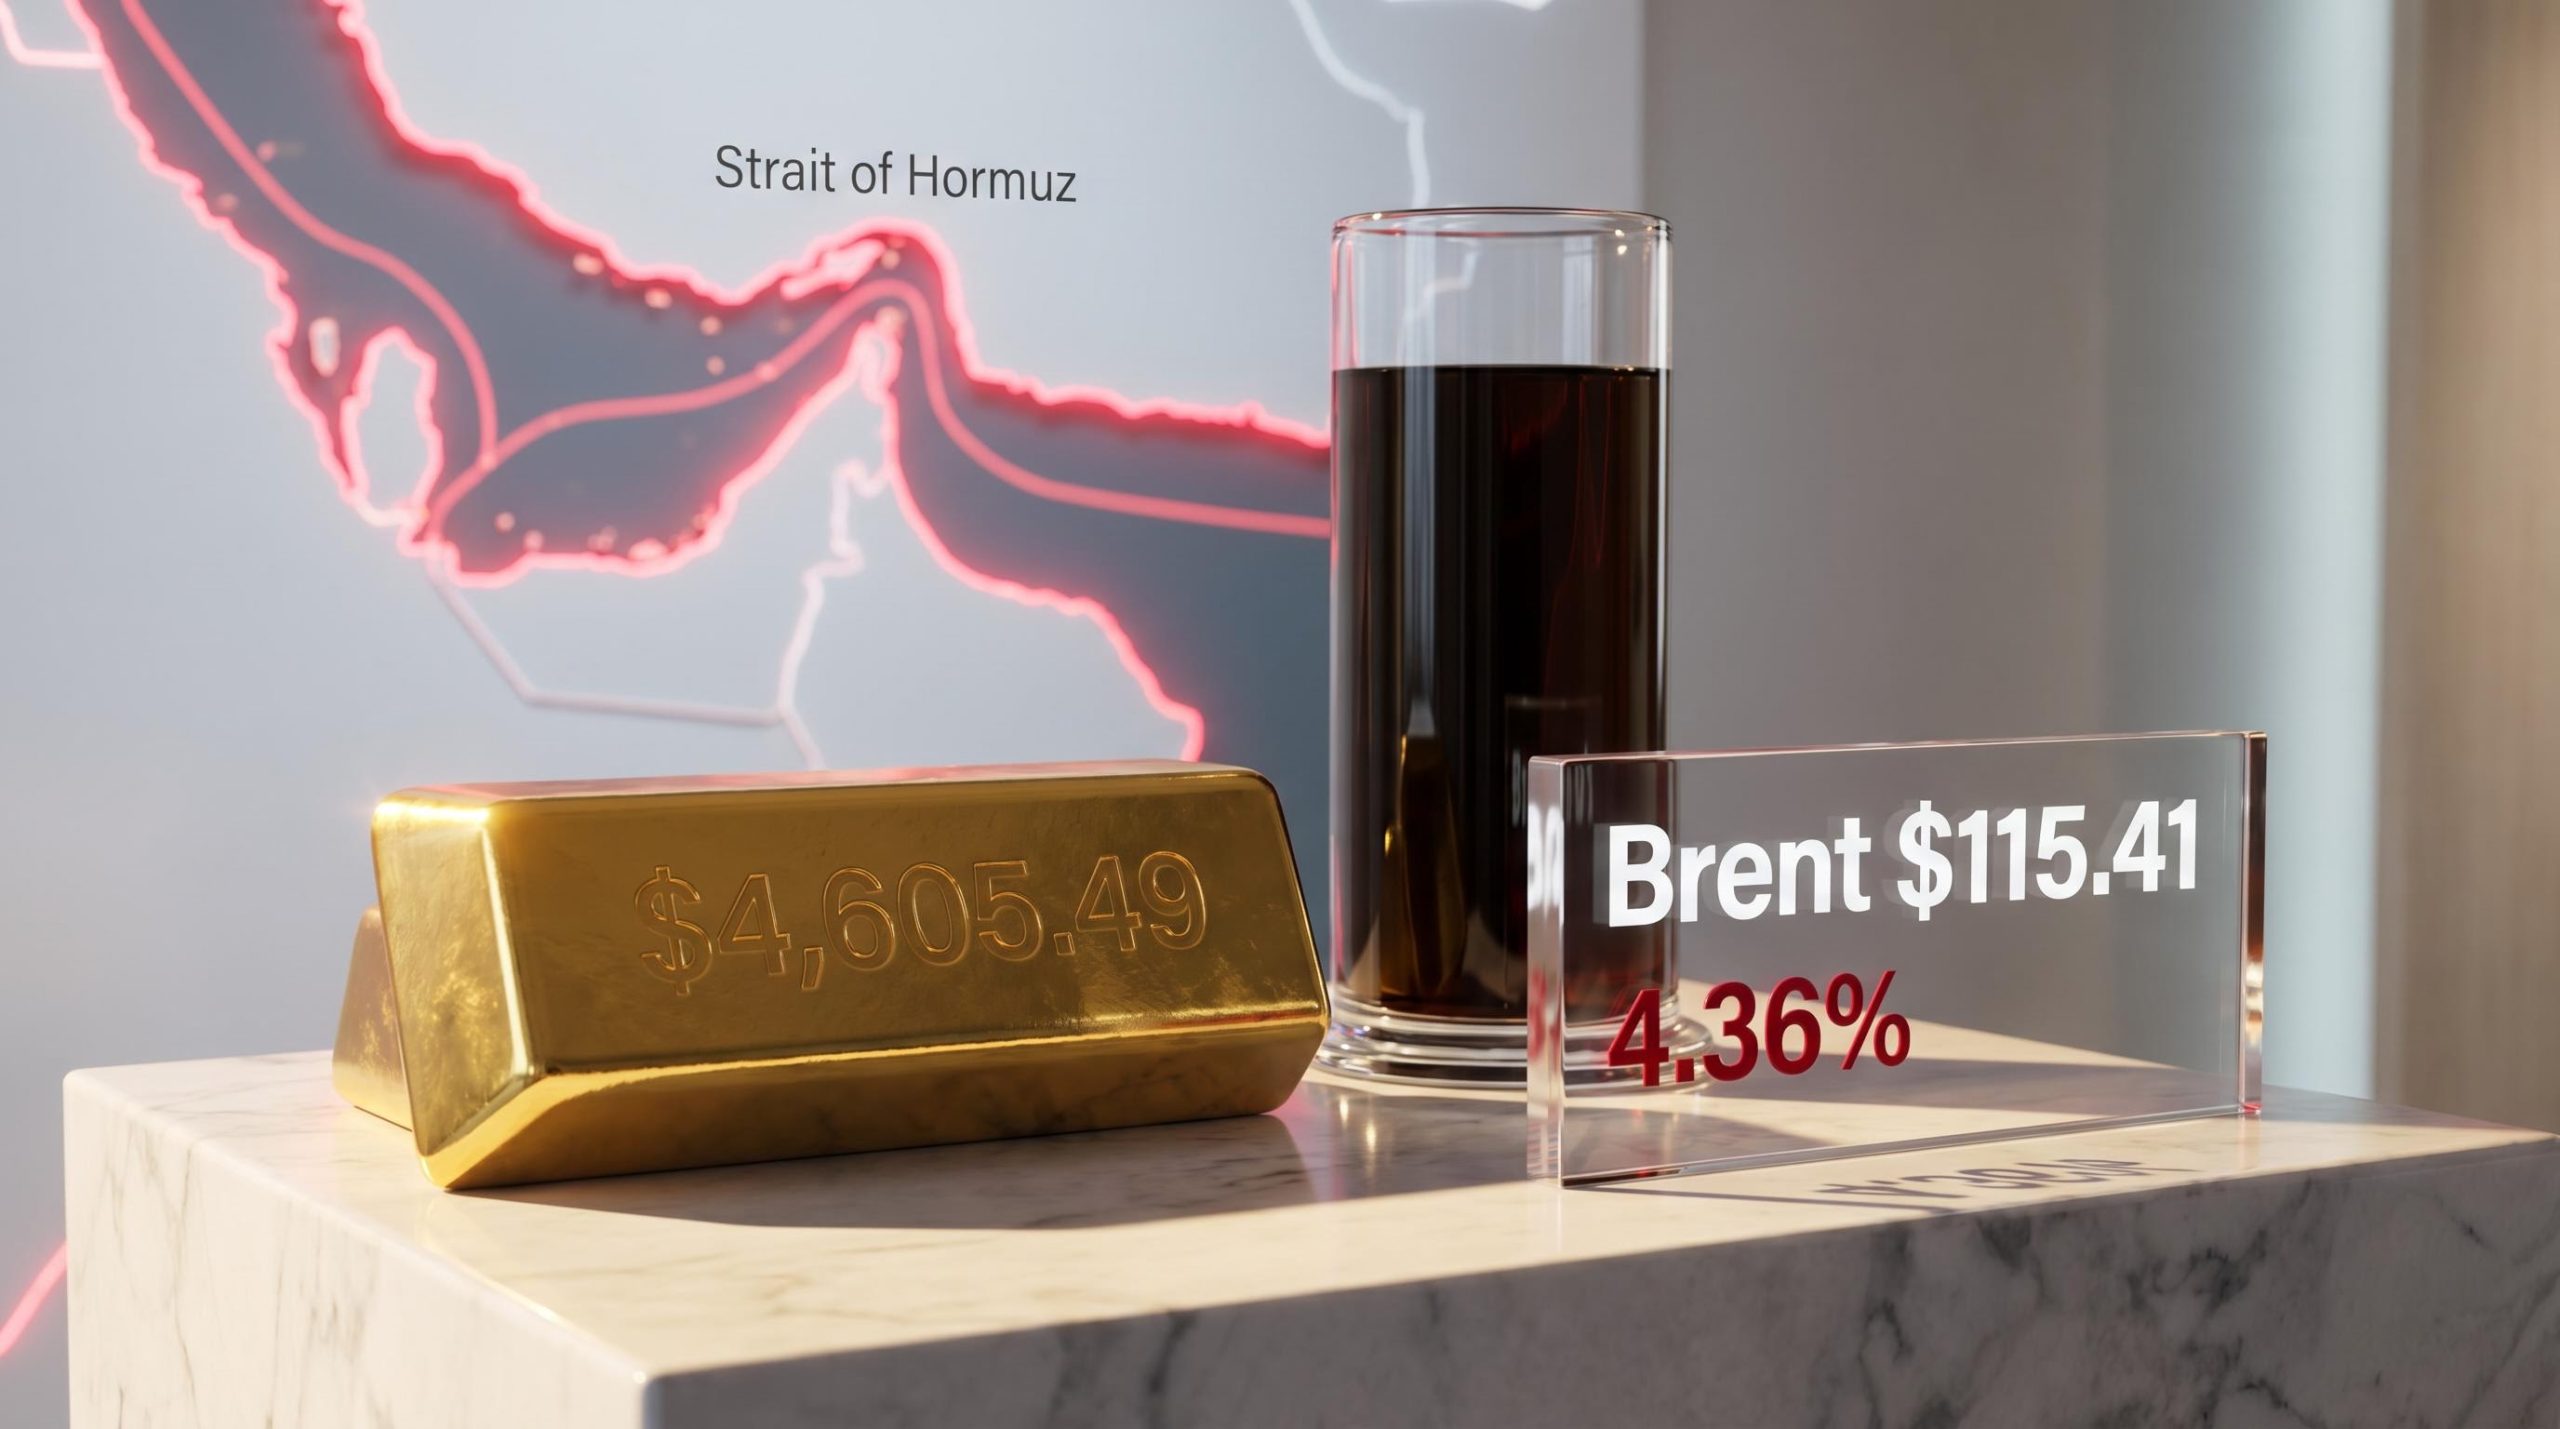
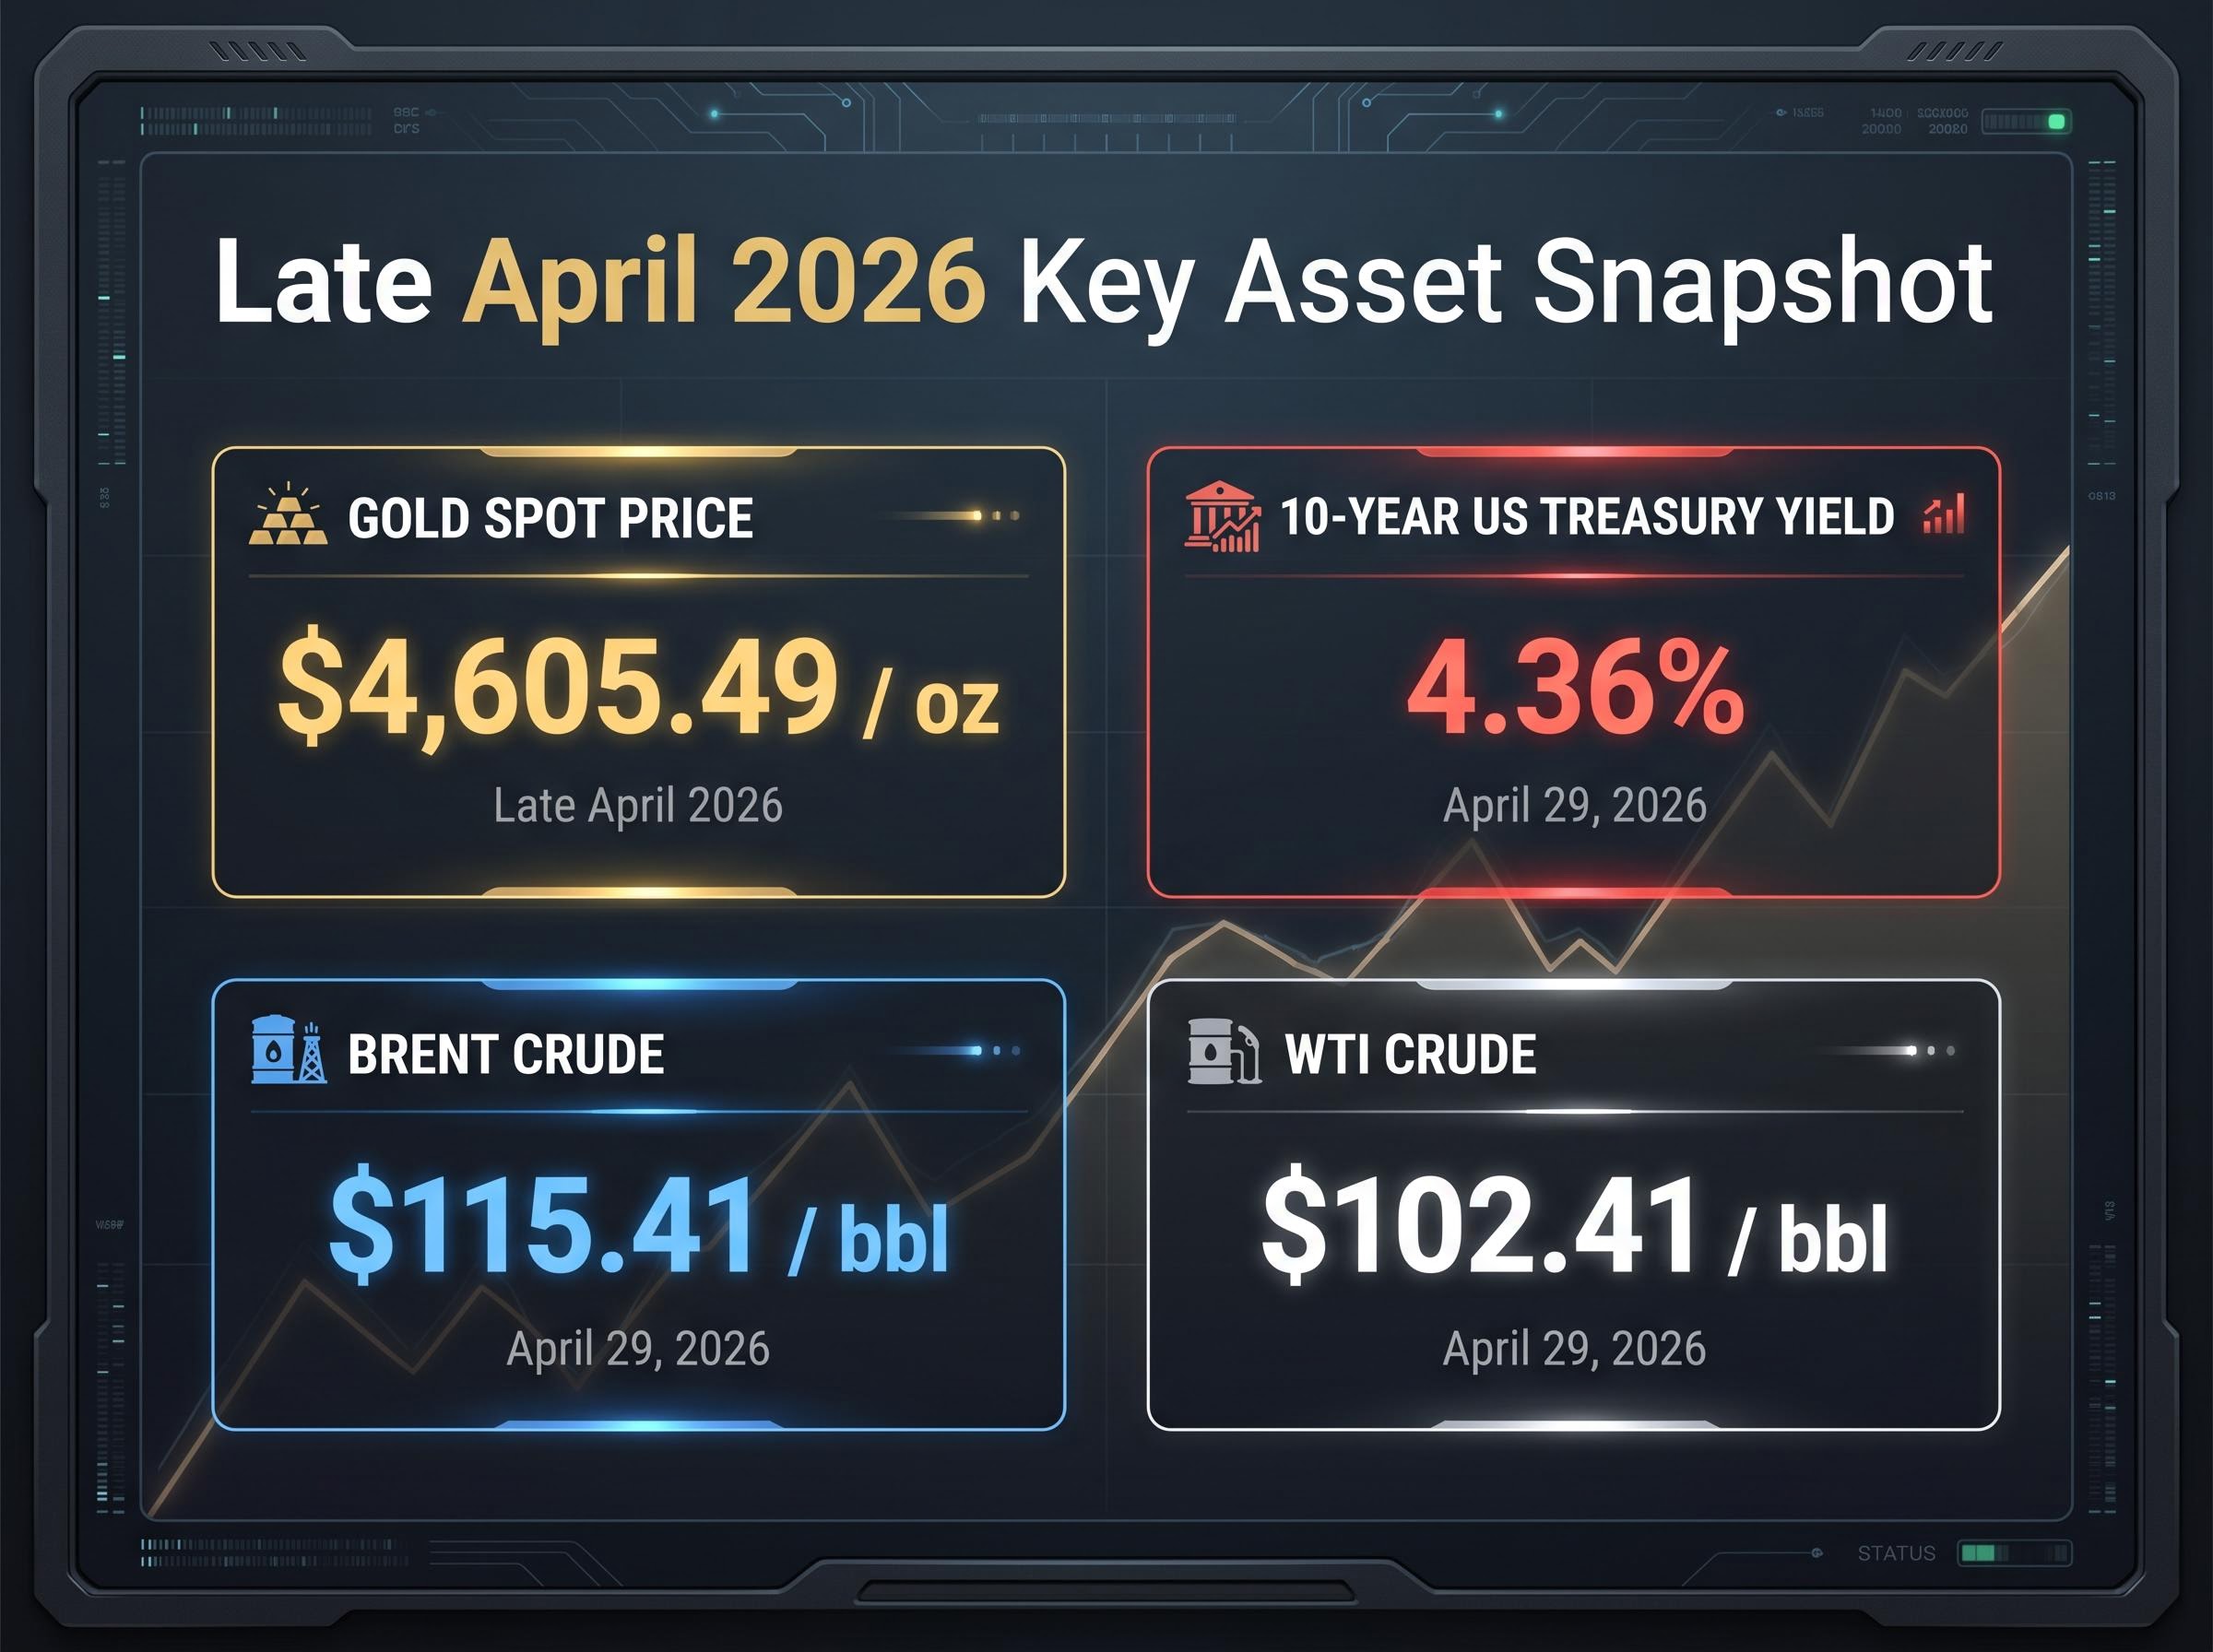
Following the initial blockade confirmation on March 4, 2026, Brent crude rapidly crossed the $100 threshold as acute supply shortage fears materialised. WTI crude absorbed a 10% upward re-rating within days of the initial regional strikes, settling well above historical averages. By April 24, 2026, persistent upward pressure pushed Brent crude to approximately $106 per barrel as shipping operators abandoned contingency routes. As of April 29, 2026, Brent trades at $115.41 per barrel, with WTI crude reaching $102.41 per barrel.
Minor portfolio adjustments are entirely insufficient when facing a macroeconomic environment dictated by pure supply scarcity. Understanding the sheer volume of stranded cargo provides the necessary context for why modern equity valuations face profound downward pressure.
The EIA Strait of Hormuz transit data confirms that this single maritime corridor historically processed approximately one-fifth of global liquefied natural gas trade, illustrating the mathematical impossibility of rerouting such massive physical quantities overnight.
“The de facto closure of the Strait of Hormuz has produced the largest supply disruption in the history of the global oil market, acting as a large, sudden tax on income for importing nations.”
The International Energy Agency assessment confirms that this constraint represents a new era of structural energy deficit.
To understand why historical market assumptions are currently failing, investors must distinguish between a demand destruction event and a supply disruption event. During the 2020 pandemic, global economies experienced severe demand destruction, where plunging commercial consumption naturally cooled commodity prices. The current blockade operates on the exact opposite mechanism, severely constraining physical supply while global consumption requirements remain intact.
This physical constraint removes the collapsing demand floor that typically buffers economies during geopolitical panics. The International Monetary Fund describes the current disruption as a large and sudden tax on income for energy-importing nations. The UN Trade and Development group further warns that these higher input costs will intensify cost-of-living pressures well beyond the energy sector.
| Crisis Type | Primary Driver | Inflation Impact | Typical Central Bank Response |
|---|---|---|---|
| Demand Destruction | Collapse in consumer and business spending | Deflationary pressures | Aggressive interest rate cuts and stimulus |
| Supply Disruption | Physical constraint of critical commodities | Severe inflationary spikes | Paralysed policy with limited easing options |
The combination of high recessionary risks and soaring fuel prices has revived the global macroeconomic conditions of the 1970s. This environment introduces a severe stagflation threat to modern markets. Central banks cannot simply lower interest rates to stimulate the economy when the underlying inflation is driven by physical supply shortages.
This policy paralysis removes the traditional safety net that equity markets have relied upon during the deflationary shocks of recent decades. Without the prospect of monetary easing to support valuations, investors must evaluate corporate earnings against a backdrop of persistently higher input costs. The Stimson Center observes that the market entered this crisis without collapsing demand, which significantly amplifies the resulting currency effects.
For readers interested in how these stubborn inflation metrics are freezing benchmark borrowing costs, our deep-dive into Federal Reserve rate paralysis models the exact pathways that will likely keep yields elevated well into 2027.
The supply shock has forced a dramatic bifurcation in global currency markets, separating nations by their resource extraction capabilities. Historically, investors treated the Japanese Yen and the Swiss Franc as reliable protective instruments during periods of geopolitical panic. Today, a nation’s domestic energy production capabilities govern its currency strength, overriding decades of established defensive reputations.
Historical NBER research on commodity market dynamics demonstrates that structural energy deficits fundamentally alter capital flows, stripping vulnerable importing nations of their traditional safe haven premium while rewarding sovereign producers.
This new paradigm is most visible in the stark divergence between the US Dollar and the Japanese Yen. The United States benefits from significant energy independence, which bolsters American currency valuations even amid profound global uncertainty. Conversely, Japan relies almost entirely on imported petroleum, leaving its economy fully exposed to surging fuel and freight costs.
The USD/JPY exchange rate reached 159.17 by late April 2026. This demonstrates how severe inflation from physical shortages has neutralised the Yen as a protective asset. Foreign exchange markets can now be categorised into three distinct groups based on resource infrastructure:
The Australian Dollar (AUD/USD) proved this resilience by trading at 0.716 on April 29, 2026, while the Canadian Dollar (CAD/USD) maintained strength at 0.720. Energy dependence is now the ultimate decider of foreign exchange stability, fundamentally altering the mechanics of international trade.
Government bonds have long served as the automatic safety net for diversified portfolios. The ongoing geopolitical crisis has severely challenged this expectation, turning a traditionally defensive asset class into a source of severe duration risk. Global bond markets are experiencing a relentless sell-off as persistent inflation fears drive yields higher and bond prices lower.
The 10-Year US Treasury Yield rose to 4.36% by April 29, 2026, reflecting a fundamental recalibration of borrowing costs worldwide. Anticipated central bank rate cuts have been postponed or entirely reversed. Monetary policymakers refuse to stimulate economic expansion while the global inflation threat remains acute.
This policy divergence is forcing a global reassessment of inflation trajectories, as persistent commodity price spikes compel central banks to prioritize price stability over near-term economic growth.
Investors demanding greater compensation for holding long-term debt are driving this historic yield expansion.
“The sustained physical constraint in global energy markets has forced institutional capital to abandon hopes for near-term monetary easing, leaving long-duration fixed income fully exposed to structural inflation risks.”
By understanding why fixed-income valuations are dropping, investors can differentiate between temporary price volatility and a permanent shift in income generation mechanics. Observations confirm that elevated borrowing costs actively discourage policymakers from stimulating economic expansion. The treasury trap occurs when capital assumes bonds will buffer equity losses, only to find both asset classes declining simultaneously under inflationary pressure.
While fiat currencies and sovereign debt struggle against inflationary pressures, precious metals have absorbed the vast majority of panic capital flows. Gold stands as the ultimate beneficiary of the current crisis, successfully isolating itself from the broader defensive asset struggle. The precious metal provides the clearest framework for identifying true resilience in a stagflationary environment.
The gold spot price reached a historic $4,605.49 per ounce by late April 2026. Investors rapidly shifted capital to physical metals amid the war-risk oil shocks, driving a massive rally that contrasts sharply with the struggles of government bonds. This performance confirms that tangible, non-yielding assets gain significant premiums when systemic inflation threatens the global trade balance.
Aggressive central bank gold accumulation has provided a massive structural price floor for the metal, demonstrating how sovereign nations are increasingly insulating their reserves from Western financial infrastructure.
Adapting to this environment requires a transition into broad portfolio positioning that emphasises corporate quality over speculative growth. Institutional portfolios are targeting quality-focused investment vehicles that exhibit specific defensive traits:
Low absolute debt levels to mitigate the impact of higher sustained borrowing costs over the coming decade. Strong, predictable cash flows capable of surviving a period of central bank policy paralysis. * Demonstrable pricing power that allows the passing of inflated energy input costs directly to consumers.
These characteristics define the new standard for equity resilience when traditional safety nets fail to perform.
Navigating a supply-constrained global economy requires a permanent analytical shift. The breakdown of traditional asset correlations during this energy shock proves that investors cannot rely on the defensive assumptions of the past two decades. Historical patterns of conflict resolution suggest that global trade routes will eventually normalise, but the timeline for the Strait of Hormuz remains highly uncertain.
This environment demands structural portfolio diversification rooted in resource independence, corporate pricing power, and tangible assets. Capital protection now requires actively evaluating how every holding responds to sustained physical commodity deficits.
Forward-looking allocators are employing a barbell investment strategy to balance these immediate energy shocks against powerful, long-term technological disinflationary forces.
This article is for informational purposes only and should not be considered financial advice. Investors should conduct their own research and consult with financial professionals before making investment decisions. Past performance does not guarantee future results, and forward-looking economic assessments are subject to rapidly changing geopolitical conditions.
Historically, safe haven assets include gold, government bonds, and certain currencies. However, in 2026, the Strait of Hormuz crisis has shifted the definition, with energy independence now governing currency strength and gold performing exceptionally while traditional bonds struggle.
These assets are struggling because the current crisis is a supply disruption, not a demand destruction event, leading to severe inflation from physical commodity shortages. This dynamic paralyzes central bank policy and devalues currencies of energy-importing nations.
Precious metals, particularly gold, have seen a massive rally, reaching historic highs. Currencies of energy-independent nations like the US Dollar and commodity exporters like the Australian and Canadian Dollars are also showing resilience due to domestic production buffers.
Investors should focus on broad portfolio positioning that emphasizes corporate quality, low absolute debt levels, strong and predictable cash flows, and demonstrable pricing power to navigate persistently higher input costs and policy paralysis.
The 'treasury trap' occurs when investors expect government bonds to buffer equity losses, but both asset classes decline simultaneously under inflationary pressure. This is relevant now because persistent inflation fears are driving bond yields higher and prices lower, challenging bonds' traditional defensive role.