The Case for Beaten-Down Consumer Stocks in a Pricey Market
6 mins ago

A covered call ETF promising roughly double the yield of its index-proxy peers sounds like a straightforward upgrade for income investors. The reality, as verified performance data reveals, is considerably more complicated.
In the current yield-seeking environment, both concentrated covered call ETFs (holding 10-20 individual positions) and index-proxy alternatives (writing calls on the S&P 500 or Nasdaq-100) are attracting record retail inflows. The choice between them represents one of the most consequential structural decisions an income-focused investor can make in 2026. What follows is an analysis of what the data actually shows about the yield gap, total return differences, cost drag, and market-regime behaviour of each approach, giving income investors a framework for evaluating trade-offs rather than chasing headline numbers.
The promotional pitch is familiar: concentrated covered call strategies deliver yields of approximately 21.6%, roughly double the 11.86% cited for index-proxy peers. The verified data tells a different story.
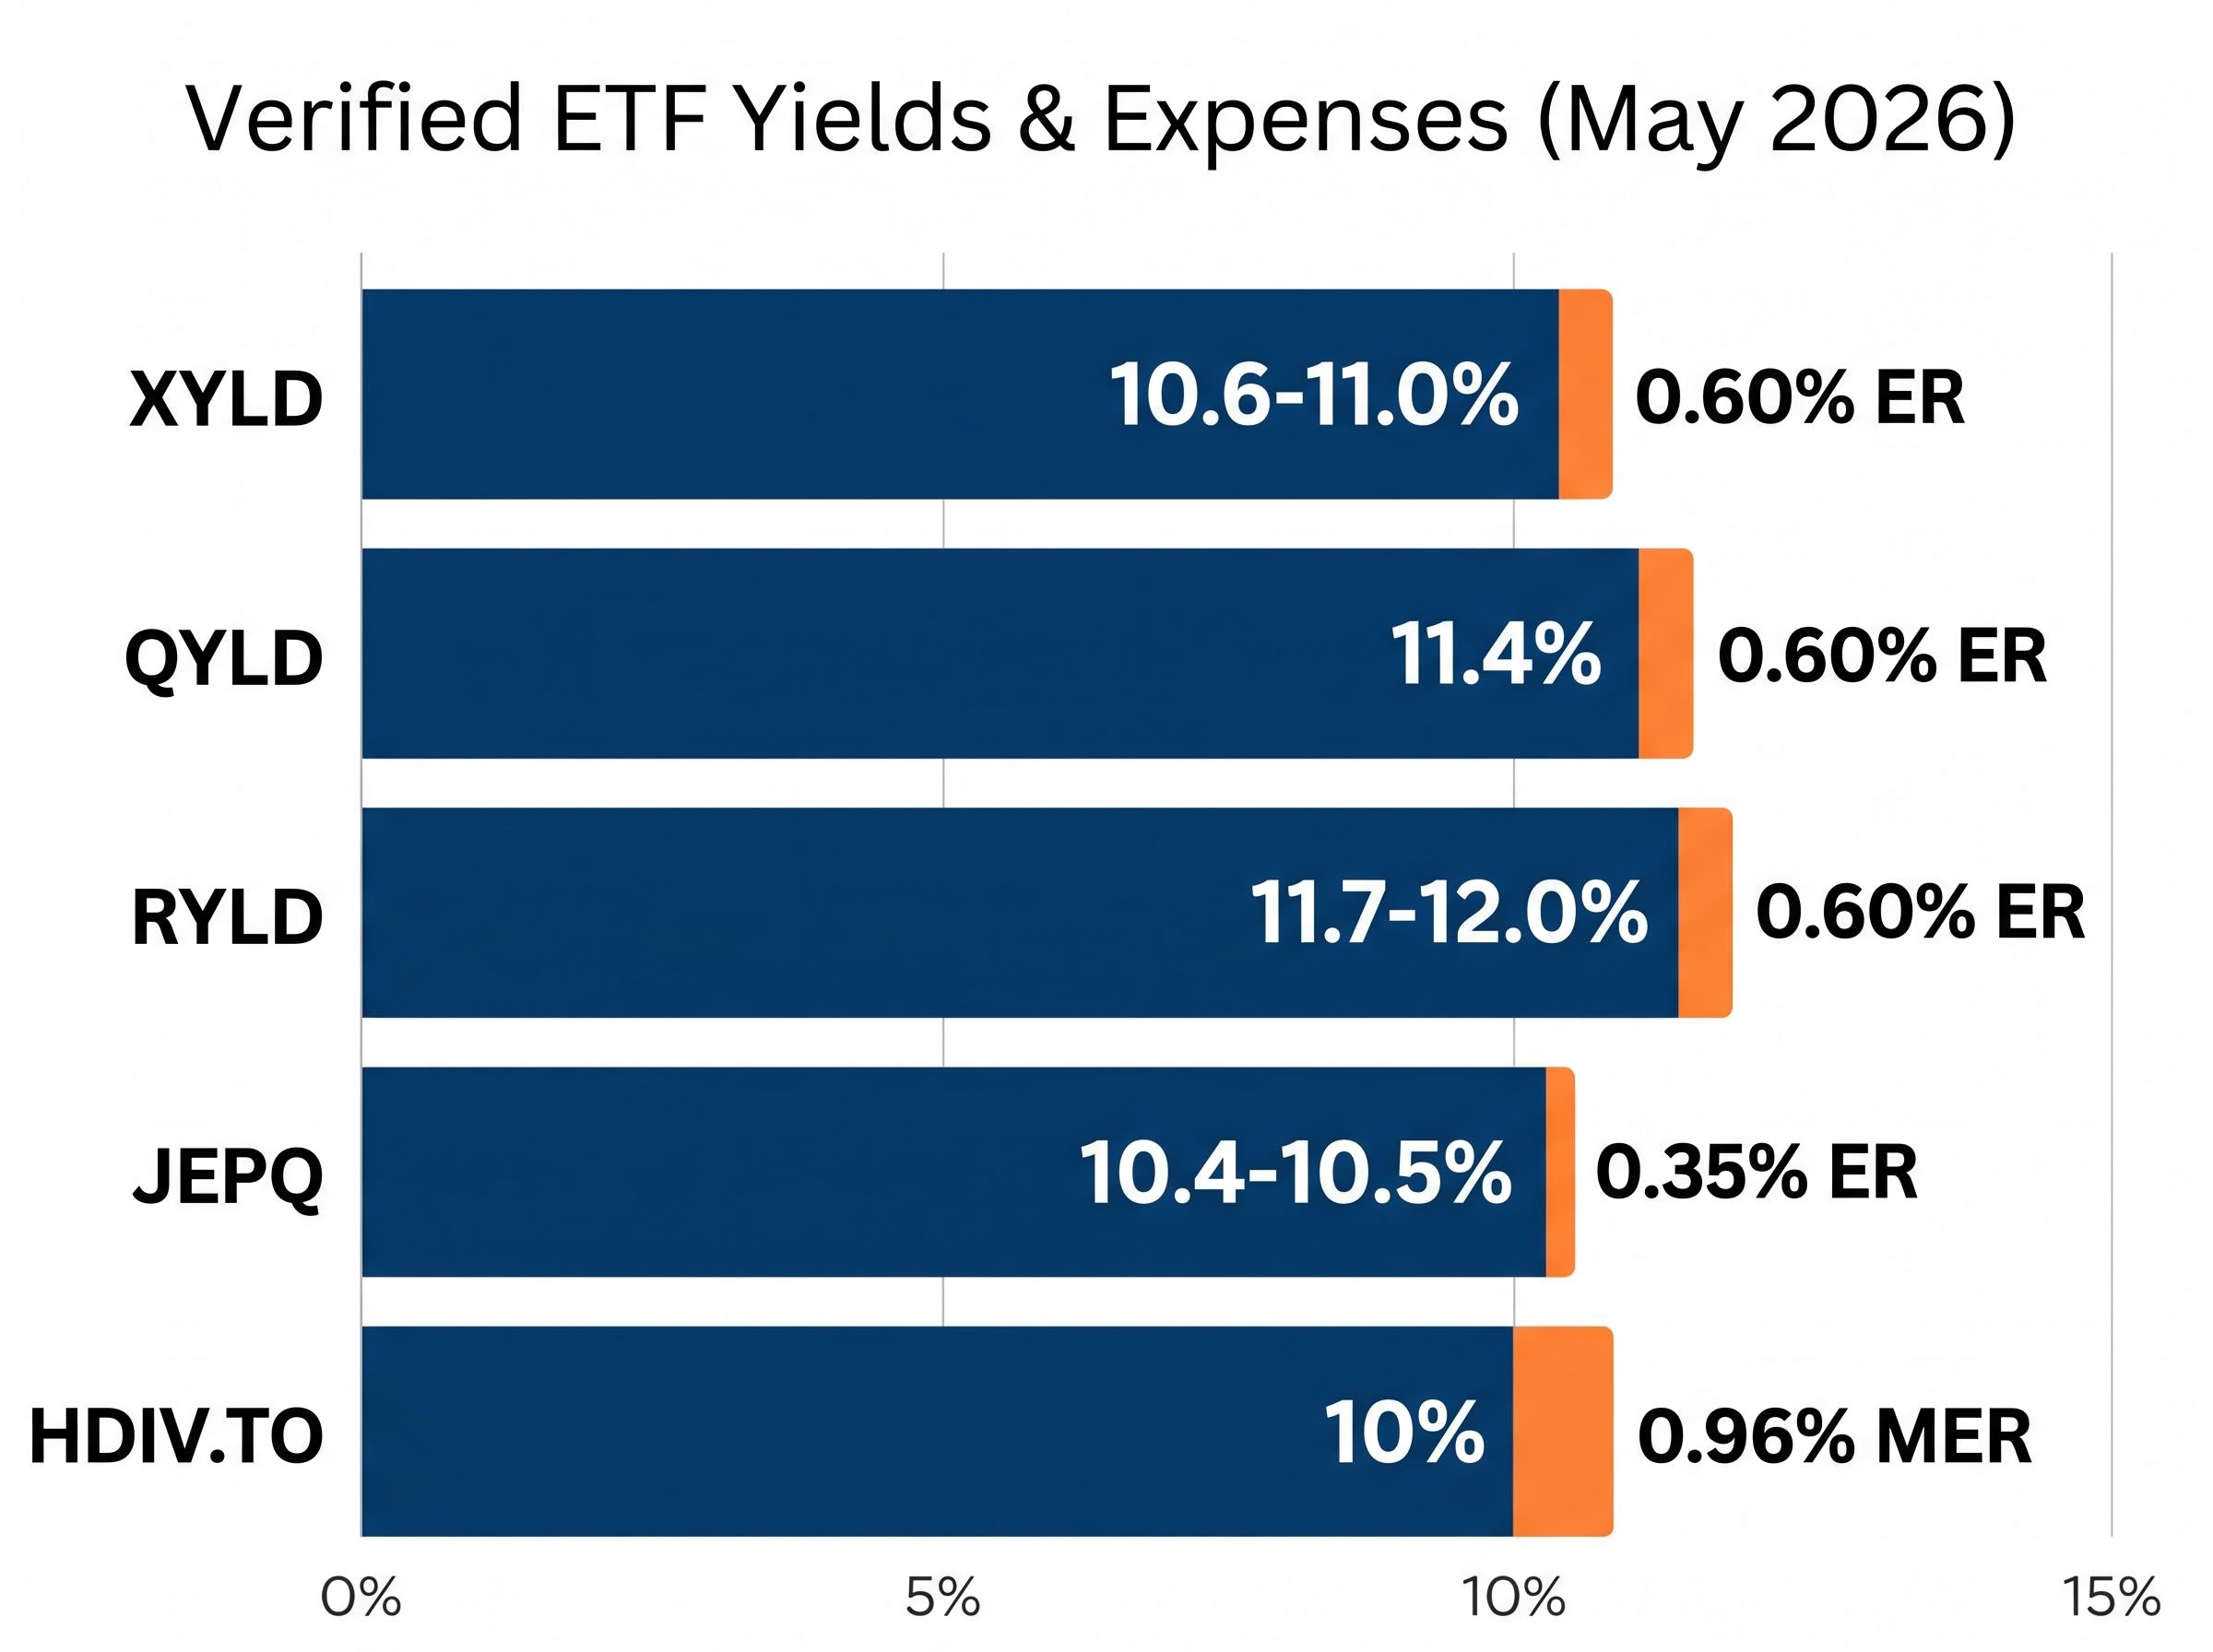
As of May 2026, the major index-proxy funds sit in a tight band. XYLD (S&P 500) yields approximately 10.6-11.0%. QYLD (Nasdaq-100) yields approximately 11.4%. RYLD (Russell 2000) yields approximately 11.7-12.0%. On the concentrated side, HDIV.TO, a Canadian multi-sector concentrated fund, yields approximately 10%.
| ETF | Category | Verified Yield | Expense Ratio | Exchange |
|---|---|---|---|---|
| XYLD | Index-proxy | 10.6-11.0% | 0.60% | NYSE |
| QYLD | Index-proxy | ~11.4% | 0.60% | NYSE |
| RYLD | Index-proxy | ~11.7-12.0% | 0.60% | NYSE |
| JEPQ | Index-proxy (active) | ~10.4-10.5% | 0.35% | NYSE |
| HDIV.TO | Concentrated | ~10% | 0.96% (MER) | TSX |
Both concentrated and index-proxy covered call ETFs deliver verified yields in the 10-12% range as of May 2026, despite marketing materials suggesting differentials of nearly double.
The yield premium in concentrated strategies is structurally real but far more modest than promotional figures suggest. It exists because writing calls on individual high-volatility stocks generates richer premiums than writing a single option on a broad, lower-volatility index. Higher implied volatility in individual names is the legitimate mechanical driver of any yield edge. The unverified 21.6% figure cited in some equally weighted concentrated portfolios should be stress-tested against fund provider disclosures before informing any allocation decision.
A covered call strategy works by holding an equity position and simultaneously selling a call option against it. The fund collects the option premium as income, but in exchange, it caps its upside: if the stock or index rises above the option’s strike price, the fund does not participate in further gains.
For an index-proxy fund like XYLD, this means writing one option on the entire S&P 500, a broad benchmark with relatively lower implied volatility. For a concentrated fund holding 10-20 individual stocks, the manager writes separate options on each position, each carrying its own, often higher, implied volatility profile.
The structural distinctions between these two approaches come down to three features:
Concentration risk and premium richness are two sides of the same coin. The higher volatility that generates better premiums also means the underlying positions can move more violently against the fund.
XYLD and its peers write calls at fixed intervals regardless of whether current implied volatility is elevated or compressed. During a volatility spike, when option premiums are at their richest, these funds cannot opportunistically increase their premium capture; the rules are preset.
Actively managed alternatives like JEPQ, which uses an equity-linked note (ELN) structure rather than direct call writing, have more latitude to adjust strike levels and timing. This is a material structural distinction for income sustainability: an active manager can lean into periods of elevated volatility, while a systematic fund writes at the same cadence whether premiums are rich or thin.
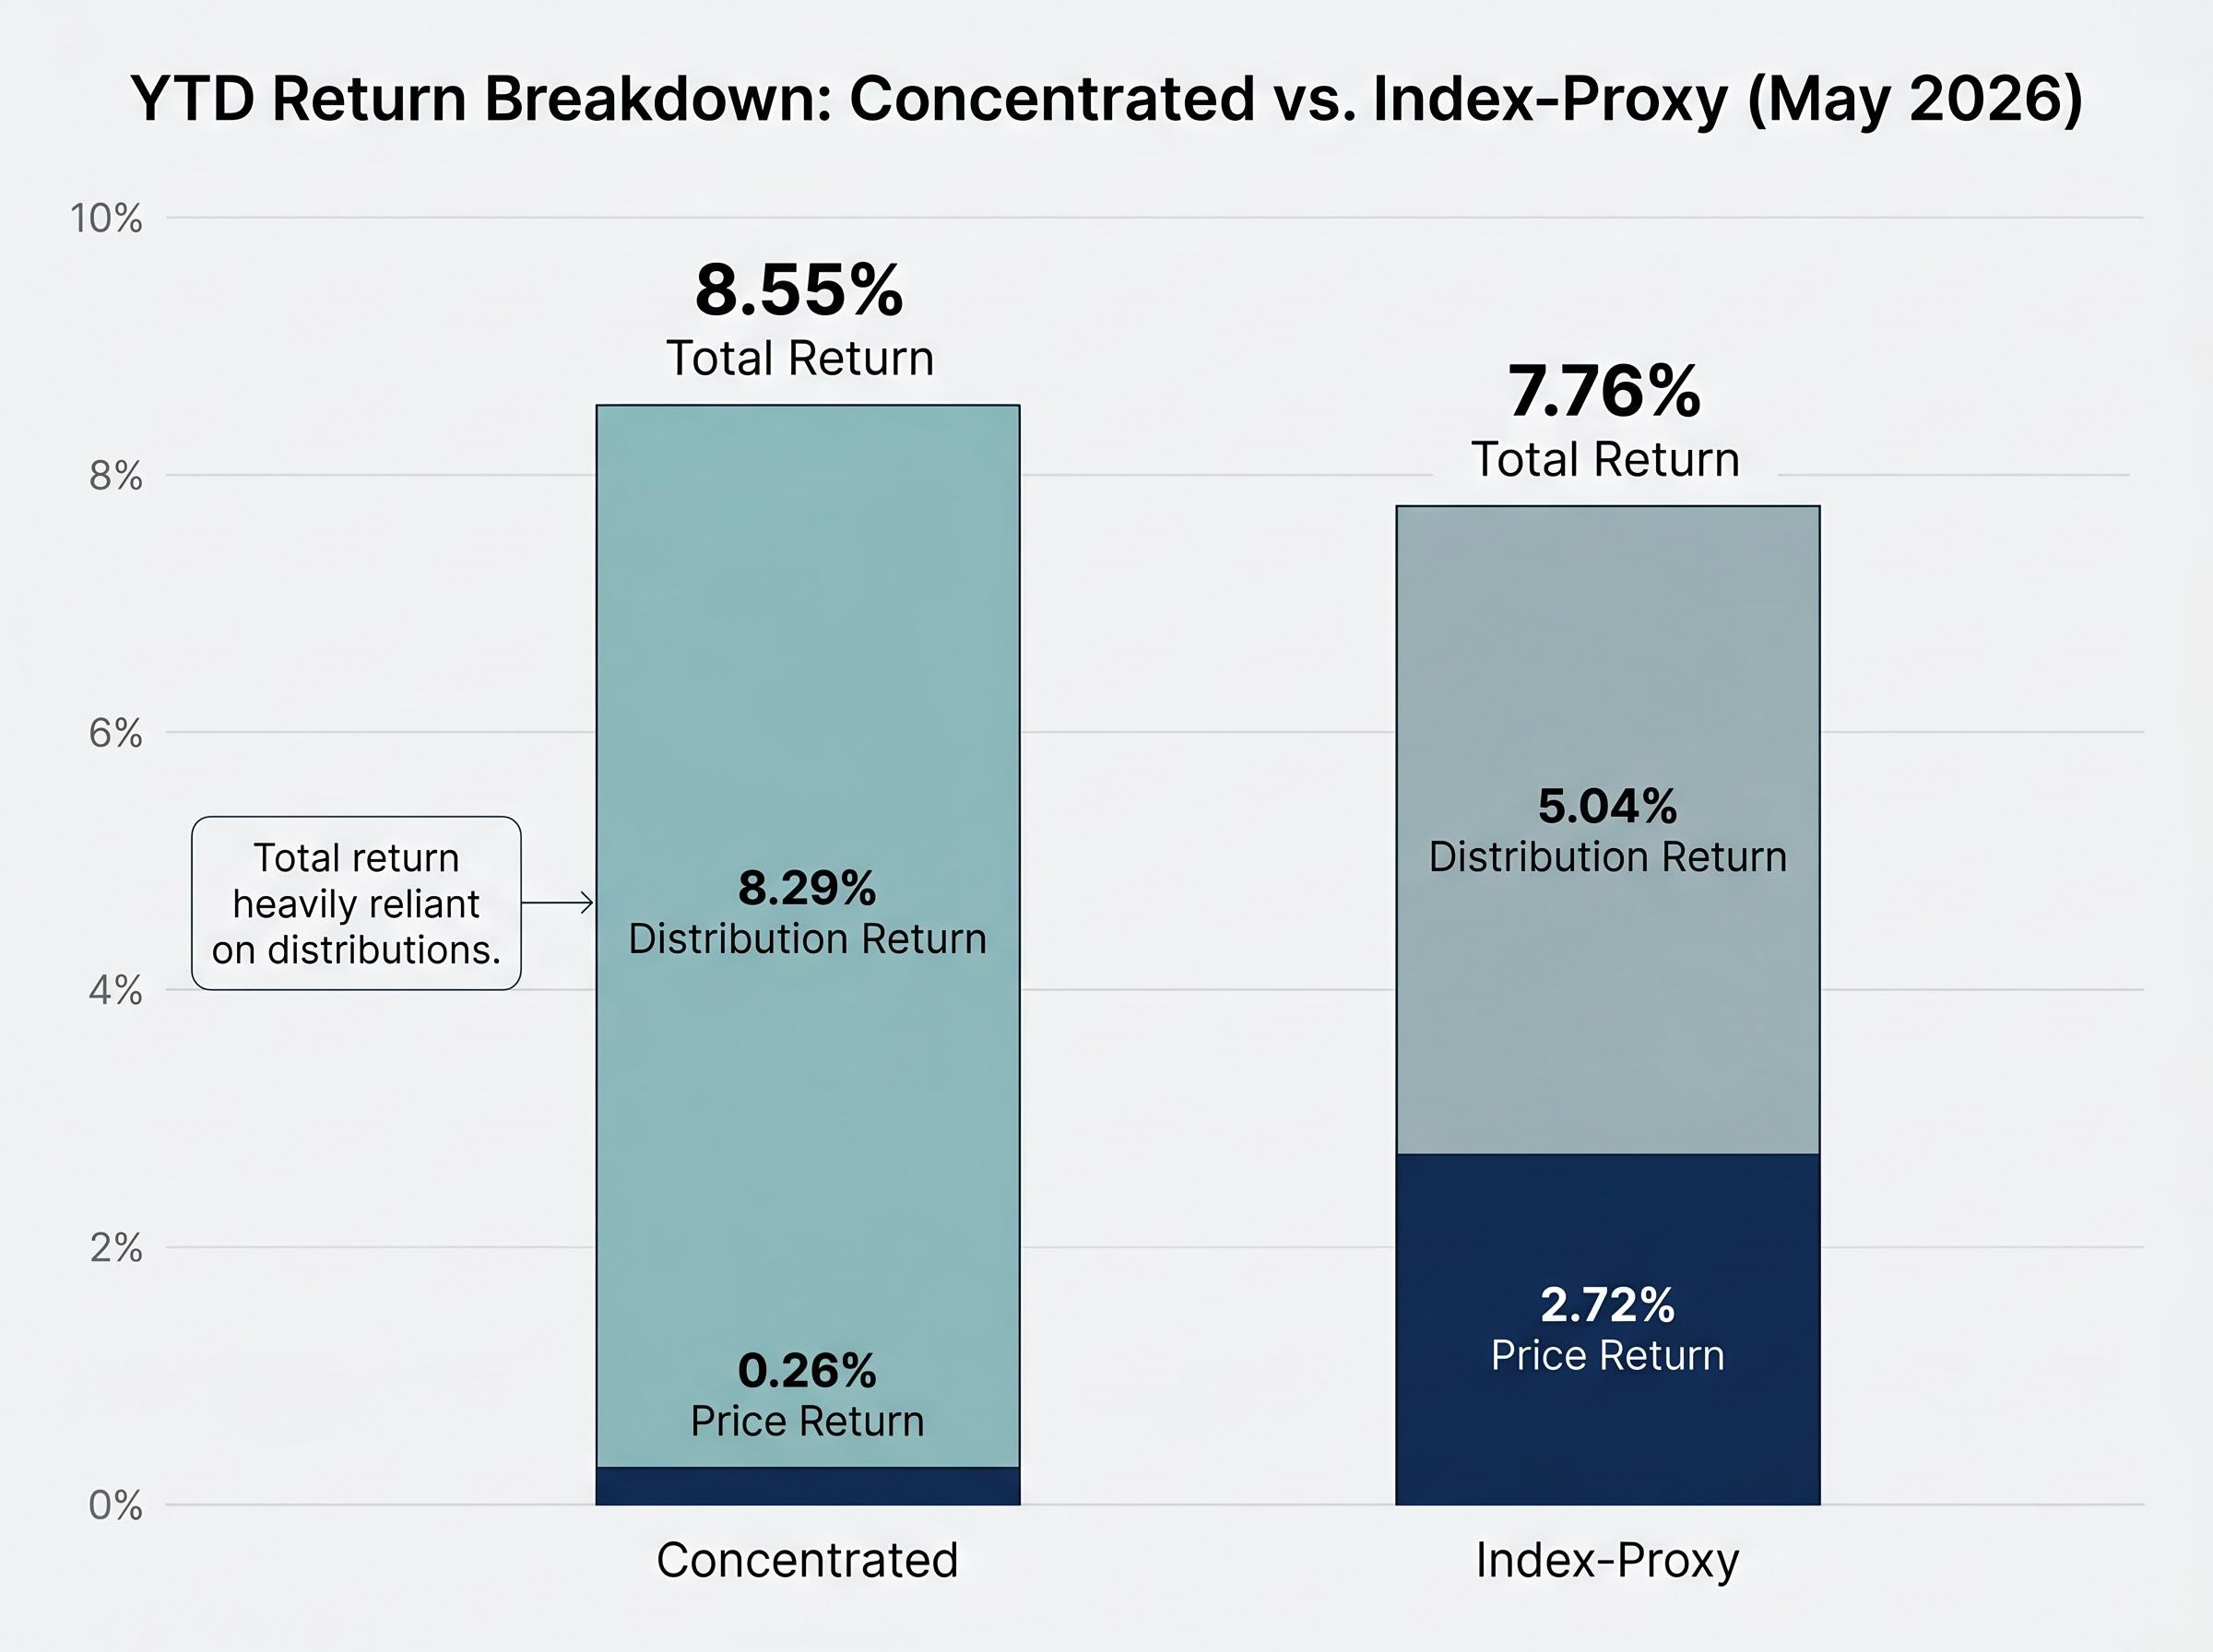
The concentrated portfolio that appears to win on yield often loses on total return. The year-to-date numbers illustrate this directly.
Through May 2026, the concentrated portfolio delivered approximately 8.55% in total return but only 0.26% in price appreciation. The index-proxy portfolio delivered approximately 7.76% in total return with 2.72% in price appreciation.
| Portfolio Category | YTD Price Return | YTD Total Return | 6-Month Subset Return |
|---|---|---|---|
| Concentrated | ~0.26% | ~8.55% | ~5.2% |
| Index-proxy | ~2.72% | ~7.76% | ~8.91% |
The distinction matters. Concentrated funds deliver nearly all of their return through distributions, which carry ordinary income tax treatment and compounding limitations. Index-proxy funds retain a larger share of total return in net asset value (NAV), meaning the fund’s price holds up better over time.
In 2023, XYLD delivered approximately 11.1% total return while SPY returned approximately 26.2%, a gap of 15 percentage points that illustrates how the call-writing cap creates structural underperformance during sustained bull markets.
XYLD’s 2026 year-to-date return of approximately 2.9% reflects the same dynamic in a more moderate environment. Income investors who focus only on distribution yield without accounting for NAV erosion may be drawing down capital rather than earning income, a distinction that materially affects long-term portfolio sustainability.
Neither category dominates across all market environments. The evidence reveals three distinct regime behaviours:
The investor holding exclusively one category through an extended bull market faces a quantifiable opportunity cost. The investor expecting downside protection from either category faces a structural misunderstanding.
As retail capital flows into covered call ETFs grow, the supply of call options being sold increases. Greater supply of options may progressively compress premiums over time, reducing forward yields across both concentrated and index-proxy funds.
This is not a confirmed trend as of May 2026, but it is a structural risk worth monitoring through distribution history and fund disclosures. If premiums compress, the income advantage that makes covered call ETFs attractive relative to traditional dividend strategies narrows accordingly.
Financial Times reporting on options-selling ETF inflows and VIX compression documented that the rapid accumulation of assets in these strategies was beginning to dampen the CBOE Volatility Index, providing early empirical evidence that the structural risk of premium compression from growing retail participation is more than theoretical.
The cost differential between categories is substantial at realistic portfolio sizes. The Global X suite (XYLD, QYLD, RYLD) charges 0.60% in expense ratios. JEPQ charges 0.35%. HDIV.TO, a concentrated Canadian fund, carries a 0.96% management expense ratio (MER), with total costs potentially reaching 2.67-2.84% once additional fees are included.
On a $100,000 position, the annual fee difference between JEPQ at 0.35% and HDIV.TO at 2.67% total costs equals approximately $2,320 paid before a single return dollar is earned.
Three practical considerations shape the portfolio construction decision:
The distinction between ELN-based funds like JEPQ and FLEX options funds affects far more than mechanics: covered call ETF structure determines whether distributions are classified as ordinary income taxed immediately or as return of capital deferred until sale, a difference that can outweigh a 1-2 percentage point yield gap for investors in higher tax brackets.
Return-of-capital risk adds another layer. High distribution yields can partially represent return of capital rather than earned premium, eroding NAV over time. Investors should review distribution tax slips and fund disclosures to assess how much of their income represents actual option premium.
The evidence does not crown a winner. Concentrated funds offer modestly higher yield potential with meaningfully higher cost drag, NAV erosion risk, and distribution-dependent total returns. Index-proxy funds offer lower costs, better price appreciation retention, and more predictable systematic income, with capped bull-market participation as the trade-off.
The blended portfolio framework emerges as the evidence-supported conclusion: index-proxy funds for core U.S. or global equity income exposure, concentrated funds for targeted sector yield where the investor has conviction and full cost transparency.
Investors seeking to close the yield gap further without abandoning index diversification have increasingly turned to leveraged covered call ETFs, which combine 1.25x equity exposure with a call-writing overlay to deliver a portfolio delta of approximately 0.92 and yields above 13%, though leverage amplifies drawdowns in ways that the premium collected only partially offsets.
The individual decision should be driven by four variables:
An approximate annual distribution on $100,000 falls in the range of $10,600-12,000 from index-proxy funds. Concentrated funds may deliver more if their verified yields hold, but the unverified 21.6% figure should be independently confirmed through fund provider disclosures before informing any allocation.
This article is for informational purposes only and should not be considered financial advice. Investors should conduct their own research and consult with financial professionals before making investment decisions. Past performance does not guarantee future results. Financial projections are subject to market conditions and various risk factors.
Concentrated covered call ETFs hold 10-20 individual stock positions and write separate call options on each, generating higher implied volatility premiums. Index-proxy alternatives like XYLD or QYLD write a single option on a broad index such as the S&P 500 or Nasdaq-100, offering greater diversification but typically lower option premiums.
As of May 2026, both categories deliver verified yields in the 10-12% range, with index-proxy funds like QYLD at approximately 11.4% and RYLD at approximately 11.7-12.0%, meaning the yield gap is far more modest than promotional figures suggesting differentials of nearly double.
Both concentrated and index-proxy covered call ETFs sacrifice upside participation during sustained bull markets because the call-writing cap limits gains above the option strike price; for example, XYLD captured roughly half of the S&P 500's approximately 26.2% return in 2023.
The cost gap is significant: index-proxy funds like JEPQ charge 0.35% while some concentrated funds like HDIV.TO carry total costs of up to 2.67-2.84%, meaning on a $100,000 position an investor could pay approximately $2,320 more per year in fees before any return is earned.
The evidence supports a blended approach: using index-proxy funds for core broad equity income exposure due to their lower costs and better NAV retention, while adding concentrated funds for targeted sector yield only where the investor has high conviction and full cost transparency.