Why SaaS Valuations Are Pricing Impairment That Hasn’t Arrived
29 mins ago

The BetaShares Asia Technology Tigers ETF (ASX: ASIA) returned 32.82% in the year to 31 March 2026, yet most Australian investors have never allocated a single dollar to the region powering that return. Australian portfolios remain structurally overweight domestic banks, miners, and, increasingly, US mega-cap technology. The technology buildout across Taiwan, South Korea, China, and Southeast Asia sits almost entirely off the radar. With the ASIA ETF now managing A$1.252 billion and trading near A$19.68, investor interest is clearly growing. But many retail investors still lack a clear framework for evaluating whether this exposure belongs in their portfolio. This analysis walks through what the fund actually holds, why the return profile looks the way it does, what the genuine risks are, and how to think about sizing Asian tech alongside a domestic and US-heavy allocation.
The typical Australian self-directed portfolio tells a familiar story. The ASX 200 is dominated by financials and materials, so the default domestic allocation concentrates capital in banks, iron ore producers, and resource services. Where technology exposure does exist, it almost always arrives through US-focused vehicles, whether that is an S&P 500 ETF, a Nasdaq 100 fund, or direct holdings in Apple and Microsoft.
The result is a portfolio with three structural underweights:
As BetaShares has noted, Asian tech is “under-represented in the Australian sharemarket.” The ASIA ETF’s growth to A$1.252 billion in funds under management suggests institutional and retail recognition is building, but it remains early relative to the capital allocated to US-centric alternatives. Understanding this structural gap before evaluating the fund itself prevents the common mistake of treating ASIA as a momentum trade rather than a diversification decision.
The abstract phrase “Asian tech” resolves into something quite specific once the fund’s composition is visible. The ASIA ETF tracks the Solactive Asia Ex-Japan Technology and Internet Tigers Index, which captures the 50 largest technology and online retail stocks across Asia, deliberately excluding Japan. The exclusion reflects a distinct regional thesis: Japan’s mature, domestically oriented technology sector operates on different growth dynamics to the semiconductor and consumer internet ecosystems further south.
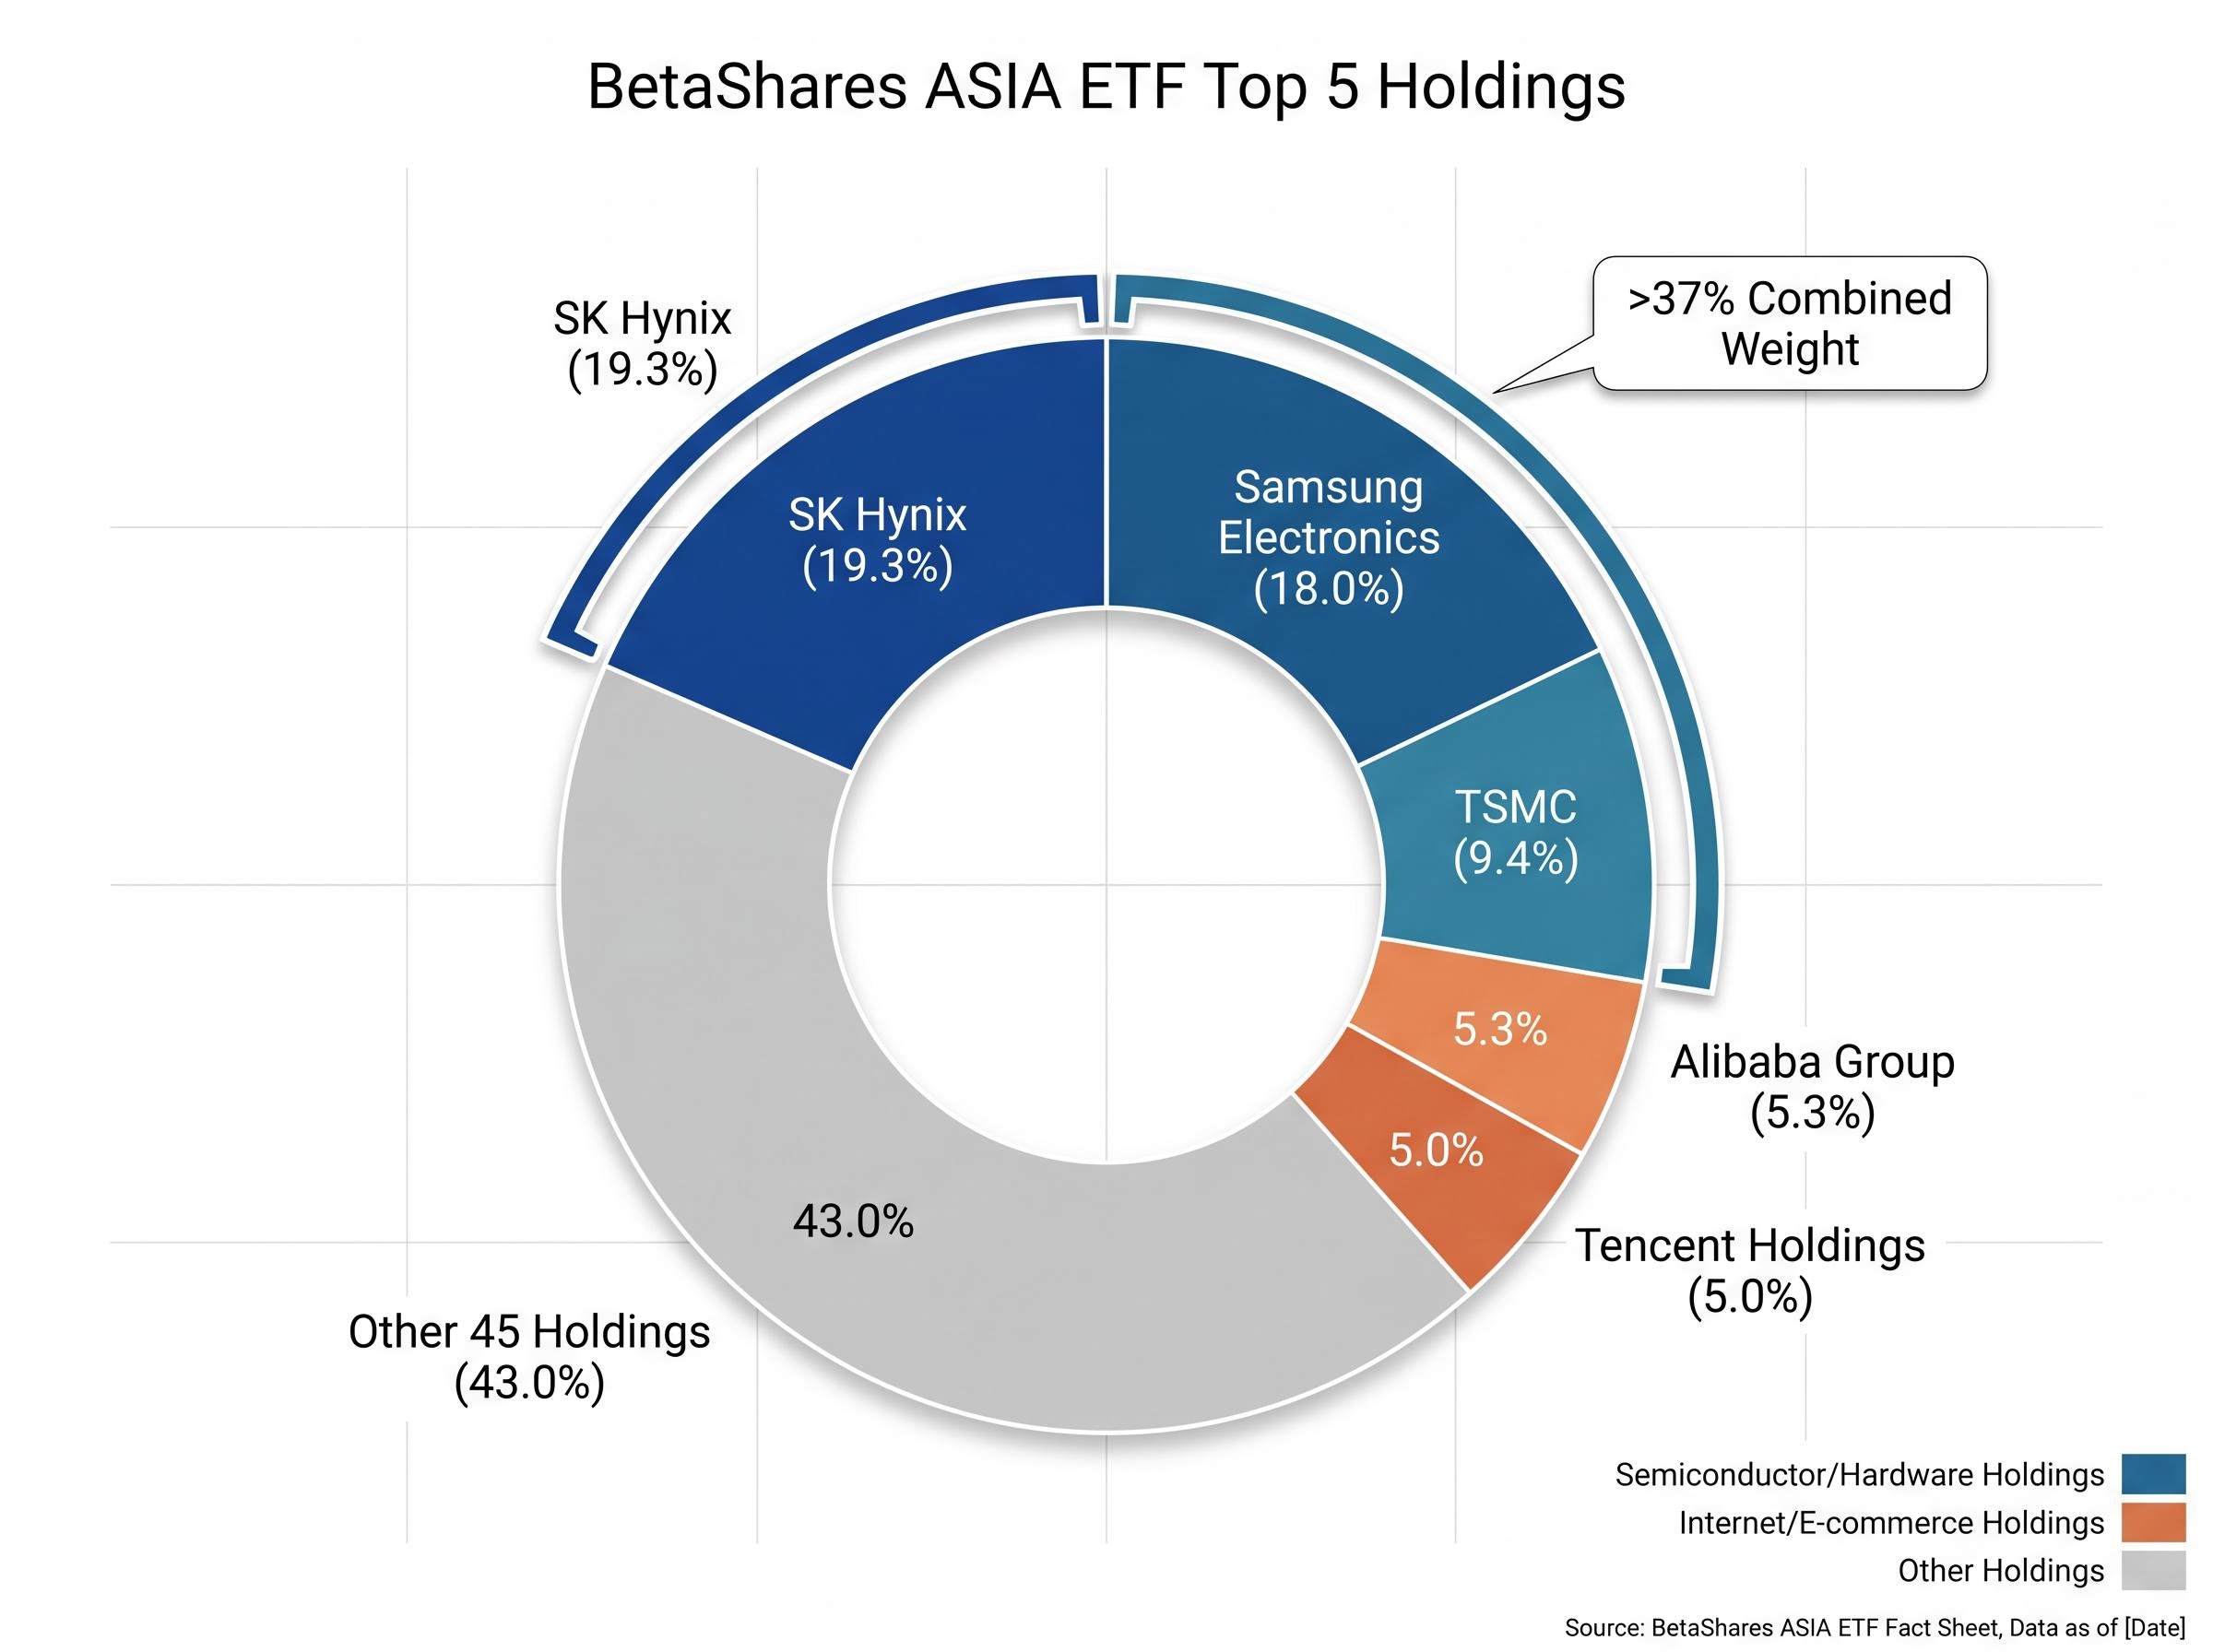
The top five holdings reveal where the fund’s weight actually sits.
| Company | Geography | Sector | Weight |
|---|---|---|---|
| SK Hynix | South Korea | Semiconductors (memory) | 19.3% |
| Samsung Electronics | South Korea | Semiconductors / electronics | 18.0% |
| TSMC | Taiwan | Semiconductor foundry | 9.4% |
| Alibaba Group | China | E-commerce / cloud | 5.3% |
| Tencent Holdings | China | Internet platforms / payments | 5.0% |
SK Hynix and Samsung together represent over 37% of the portfolio. That concentration makes the ASIA ETF significantly more semiconductor-weighted than its name might imply. This is not a broad Asian growth fund or a pure China consumer play; it is a concentrated position in the hardware infrastructure underpinning global AI and consumer electronics, with a secondary layer of Chinese internet platforms.
The broader portfolio spans five sector themes:
The management fee sits at 0.67% per annum, and the 12-month distribution yield is 0.7% (paid semi-annually). The yield confirms what the holdings suggest: this is primarily a capital growth vehicle. Income-focused investors will find little here.
The ASIA ETF follows the same structural logic as any ASX-listed fund: units trade on exchange throughout the day, the management fee of 0.67% is deducted from the fund’s net assets rather than charged separately, and the underlying index rebalances periodically to maintain its target exposure. ETF mechanics for Australian investors, including how NAV is calculated, how distributions flow through, and what the tax treatment of capital gains looks like, are worth understanding before committing capital to any thematic fund.
The ASIA ETF’s 32.82% one-year return and 24.08% three-year annualised return (both to 31 March 2026) did not arrive from a single source. Two distinct structural tailwinds are at work, and they carry different weightings within the fund.
TSMC operates the world’s most advanced chip foundry. Every major hyperscaler building AI data centres, from US cloud providers to Chinese platforms, requires TSMC’s manufacturing capacity. SK Hynix supplies high-bandwidth memory (HBM), a component that has become a bottleneck in AI server production. Together, these two companies sit directly in the path of global AI infrastructure spending.
The AI boom in Asian semiconductor markets produced a striking divergence in early 2026: South Korea’s Kospi gained approximately 57% in the first four months of the year while the S&P 500 gained just 5.6%, a gap explained almost entirely by the concentration of AI hardware demand flowing to Samsung, SK Hynix, and TSMC at a time when these companies traded at roughly half the forward P/E multiple of their US-listed peers.
The performance numbers reflect that positioning. TSMC’s NYSE-listed ADR returned approximately +125.97% over the year to roughly 6 May 2026, making it the single largest contributor to the ASIA ETF’s one-year result. SK Hynix, as the fund’s largest holding at 19.3%, further amplifies the semiconductor theme.
The second layer of the thesis runs through Alibaba, Tencent, and PDD Holdings. Rising middle-class consumption across Asia continues to drive e-commerce adoption, while digital payment ecosystems, including Tencent’s WeChat Pay and Alibaba’s Alipay, deepen financial digitalisation.
The returns here tell a more modest story. Alibaba’s one-year return was approximately +6.26%, while Tencent posted approximately -4.90% over the same period. The intra-ETF divergence is instructive: the semiconductor holdings have powered recent performance, while the consumer internet layer has lagged.
Motley Fool Australia named the ASIA ETF a top pick to “beat the market in 2026,” citing underappreciated Asian tech relative to stretched US valuations. Webull Australia described it as a strong candidate to “buy in 2026 and hold to 2036.”
Australian financial commentary has also highlighted the valuation argument: Asian tech trades at a meaningful discount to US tech peers on comparable growth profiles, creating a potential multiple-expansion opportunity if global capital rotates.
The three structural growth themes are:
Investors evaluating ASIA should recognise which thesis they are primarily buying into. The weighting structure means this is a semiconductor trade first, with consumer internet as a secondary position.
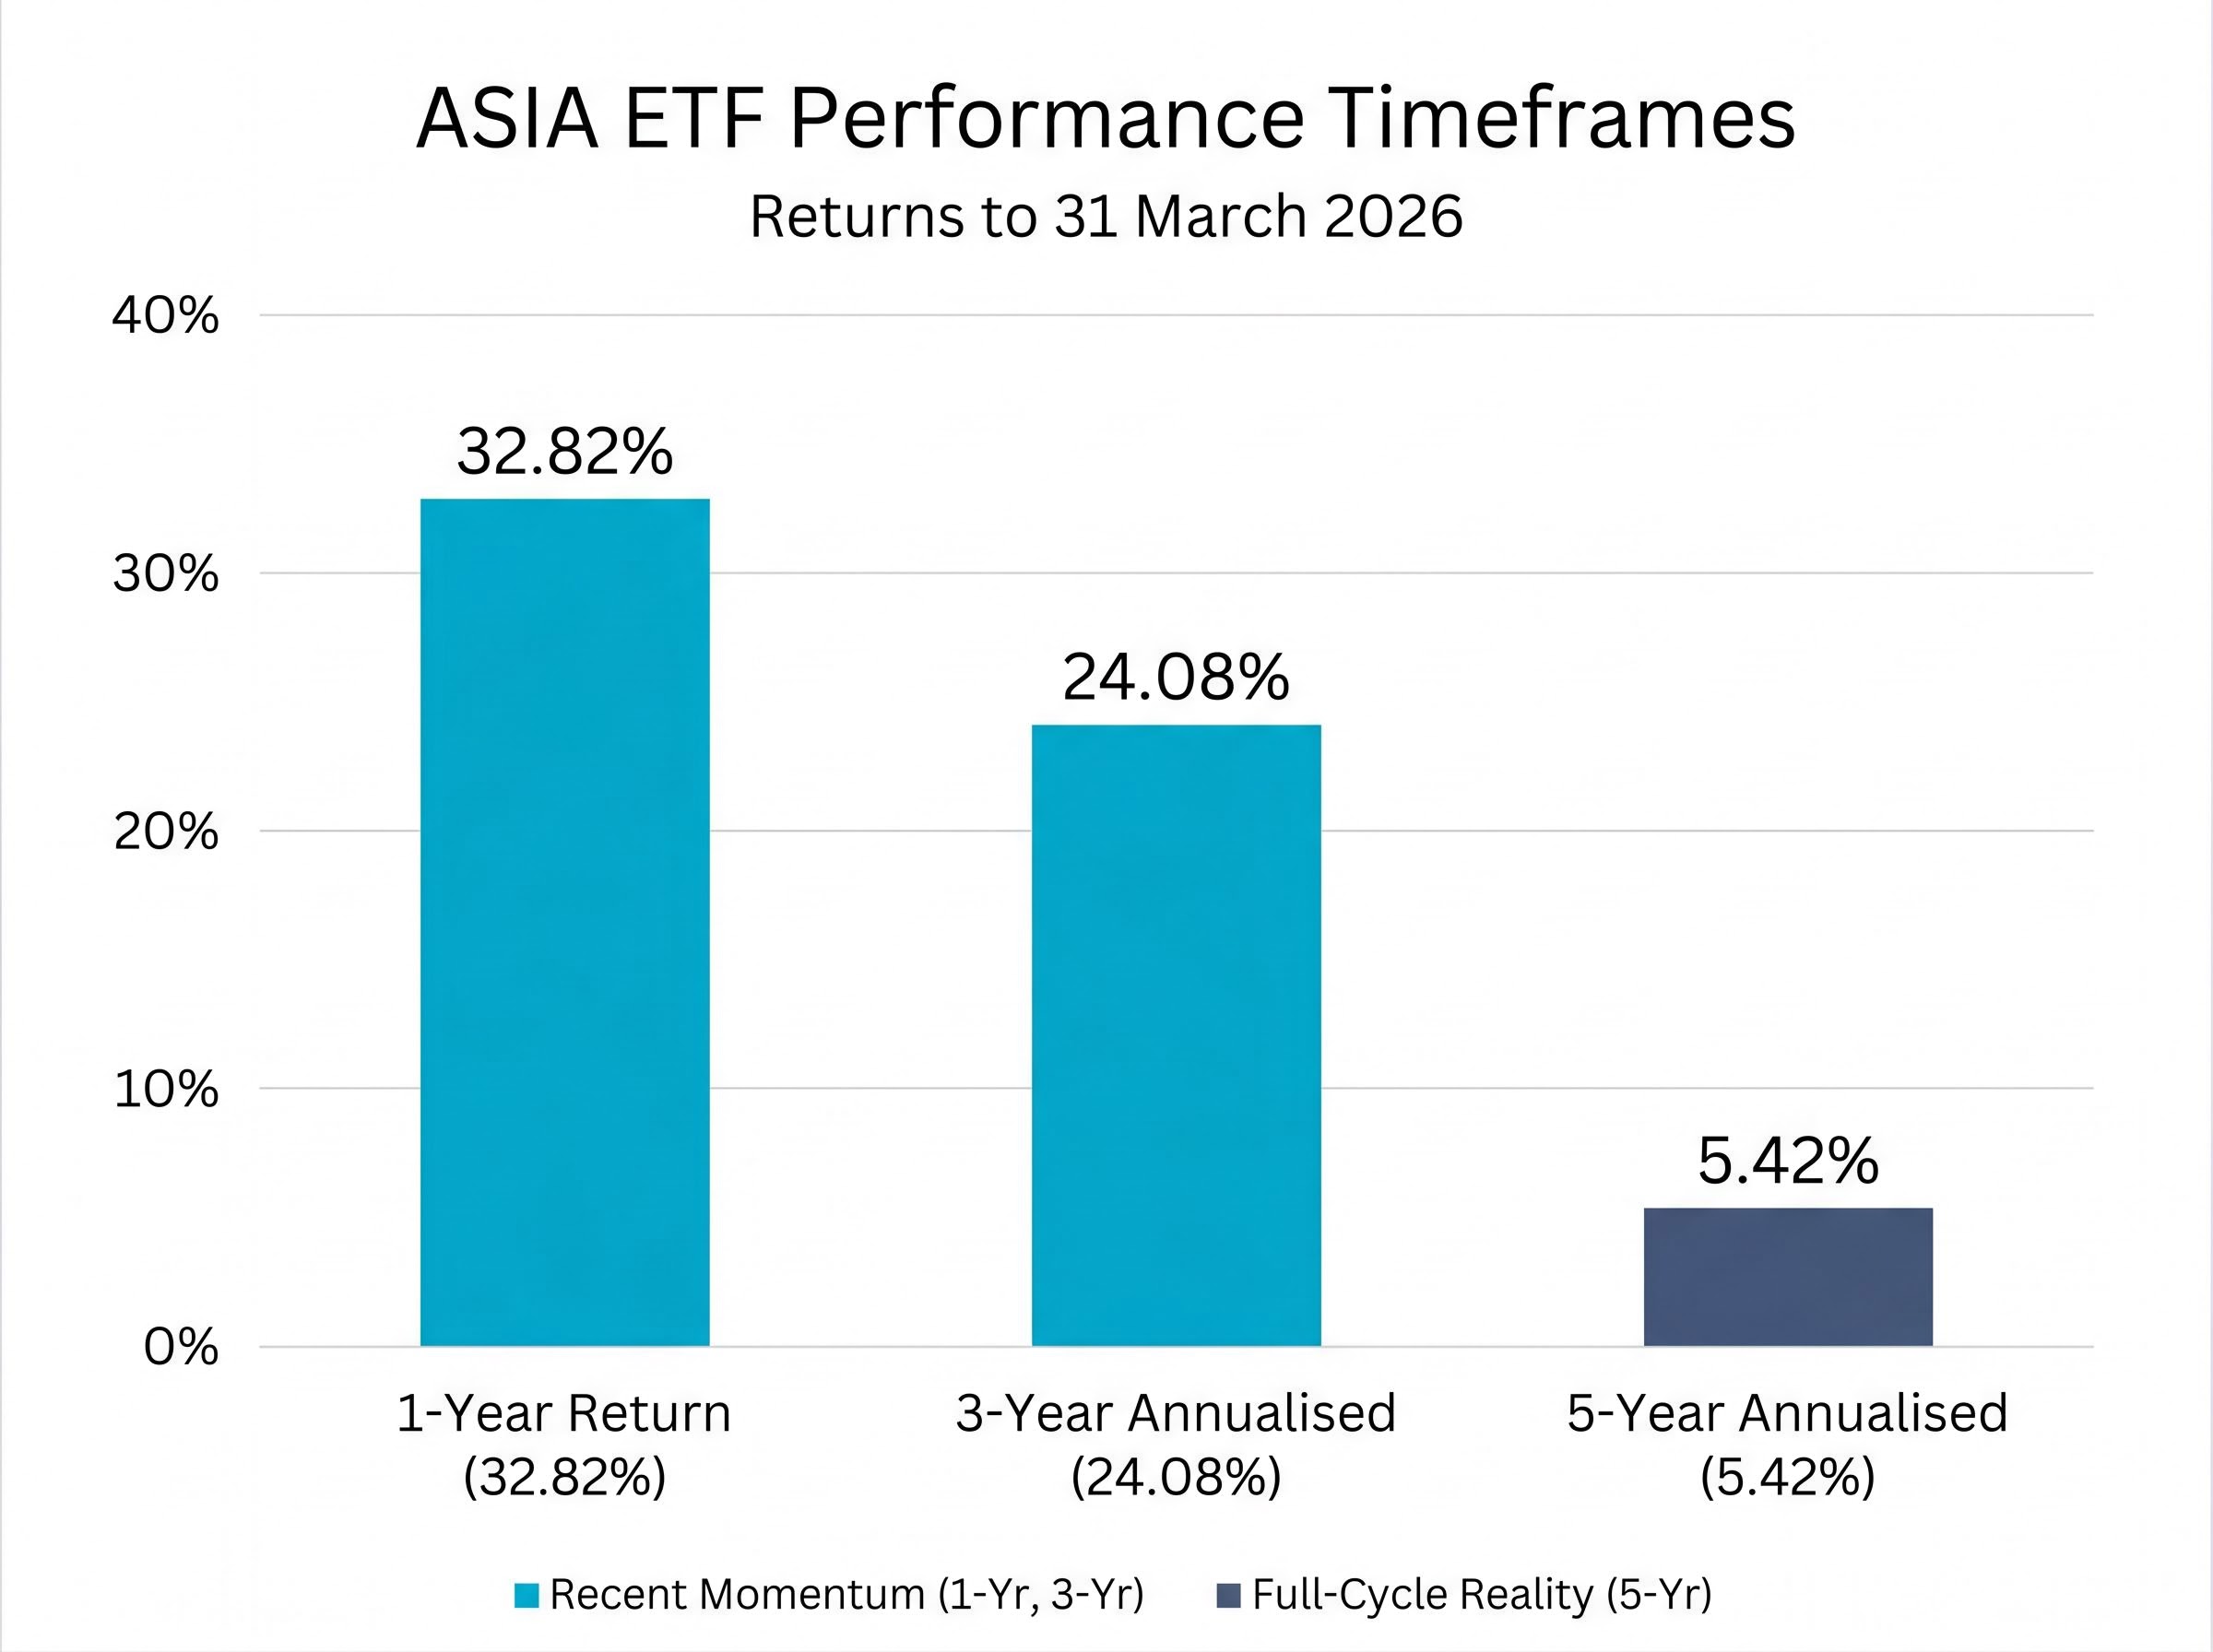
The one-year return of 32.82% captures the best recent chapter. The five-year annualised return tells the fuller story.
The full-cycle figure: The ASIA ETF’s 5-year annualised return of 5.42% (to 31 March 2026) captures the complete period including COVID recovery, the 2021-2022 Chinese regulatory crackdowns, and the subsequent AI-driven rebound. Investors entering now are not buying a fund with a clean track record; they are buying into a story that already includes one major drawdown episode.
Four specific, currently active risk factors sit beneath the recent performance.
| Risk Type | Specific Exposure | Potential Impact |
|---|---|---|
| Geopolitical (Taiwan Strait) | TSMC at 9.4% weight; tensions remain unresolved as at May 2026 | Direct NAV impact from any escalation; broader regional sentiment contagion |
| Currency (AUD unhedged) | Unhedged exposure to CNY, TWD, KRW, and HKD | A strengthening AUD erodes returns even if underlying stocks perform well |
| Concentration (memory semiconductors) | SK Hynix (19.3%) + Samsung (18.0%) = over 37% | Single-theme exposure to memory chip cycles and US export control policy |
| Regulatory (China platform economy) | Tencent (5.0%), Alibaba (5.3%) | Renewed Beijing intervention on platform companies remains possible |
Tencent’s approximate -4.90% one-year return and Alibaba’s modest +6.26% gain illustrate that the Chinese internet holdings are not simply riding the same AI wave. Geopolitical dynamics, regulatory memory, and consumer spending patterns all shape their trajectories independently.
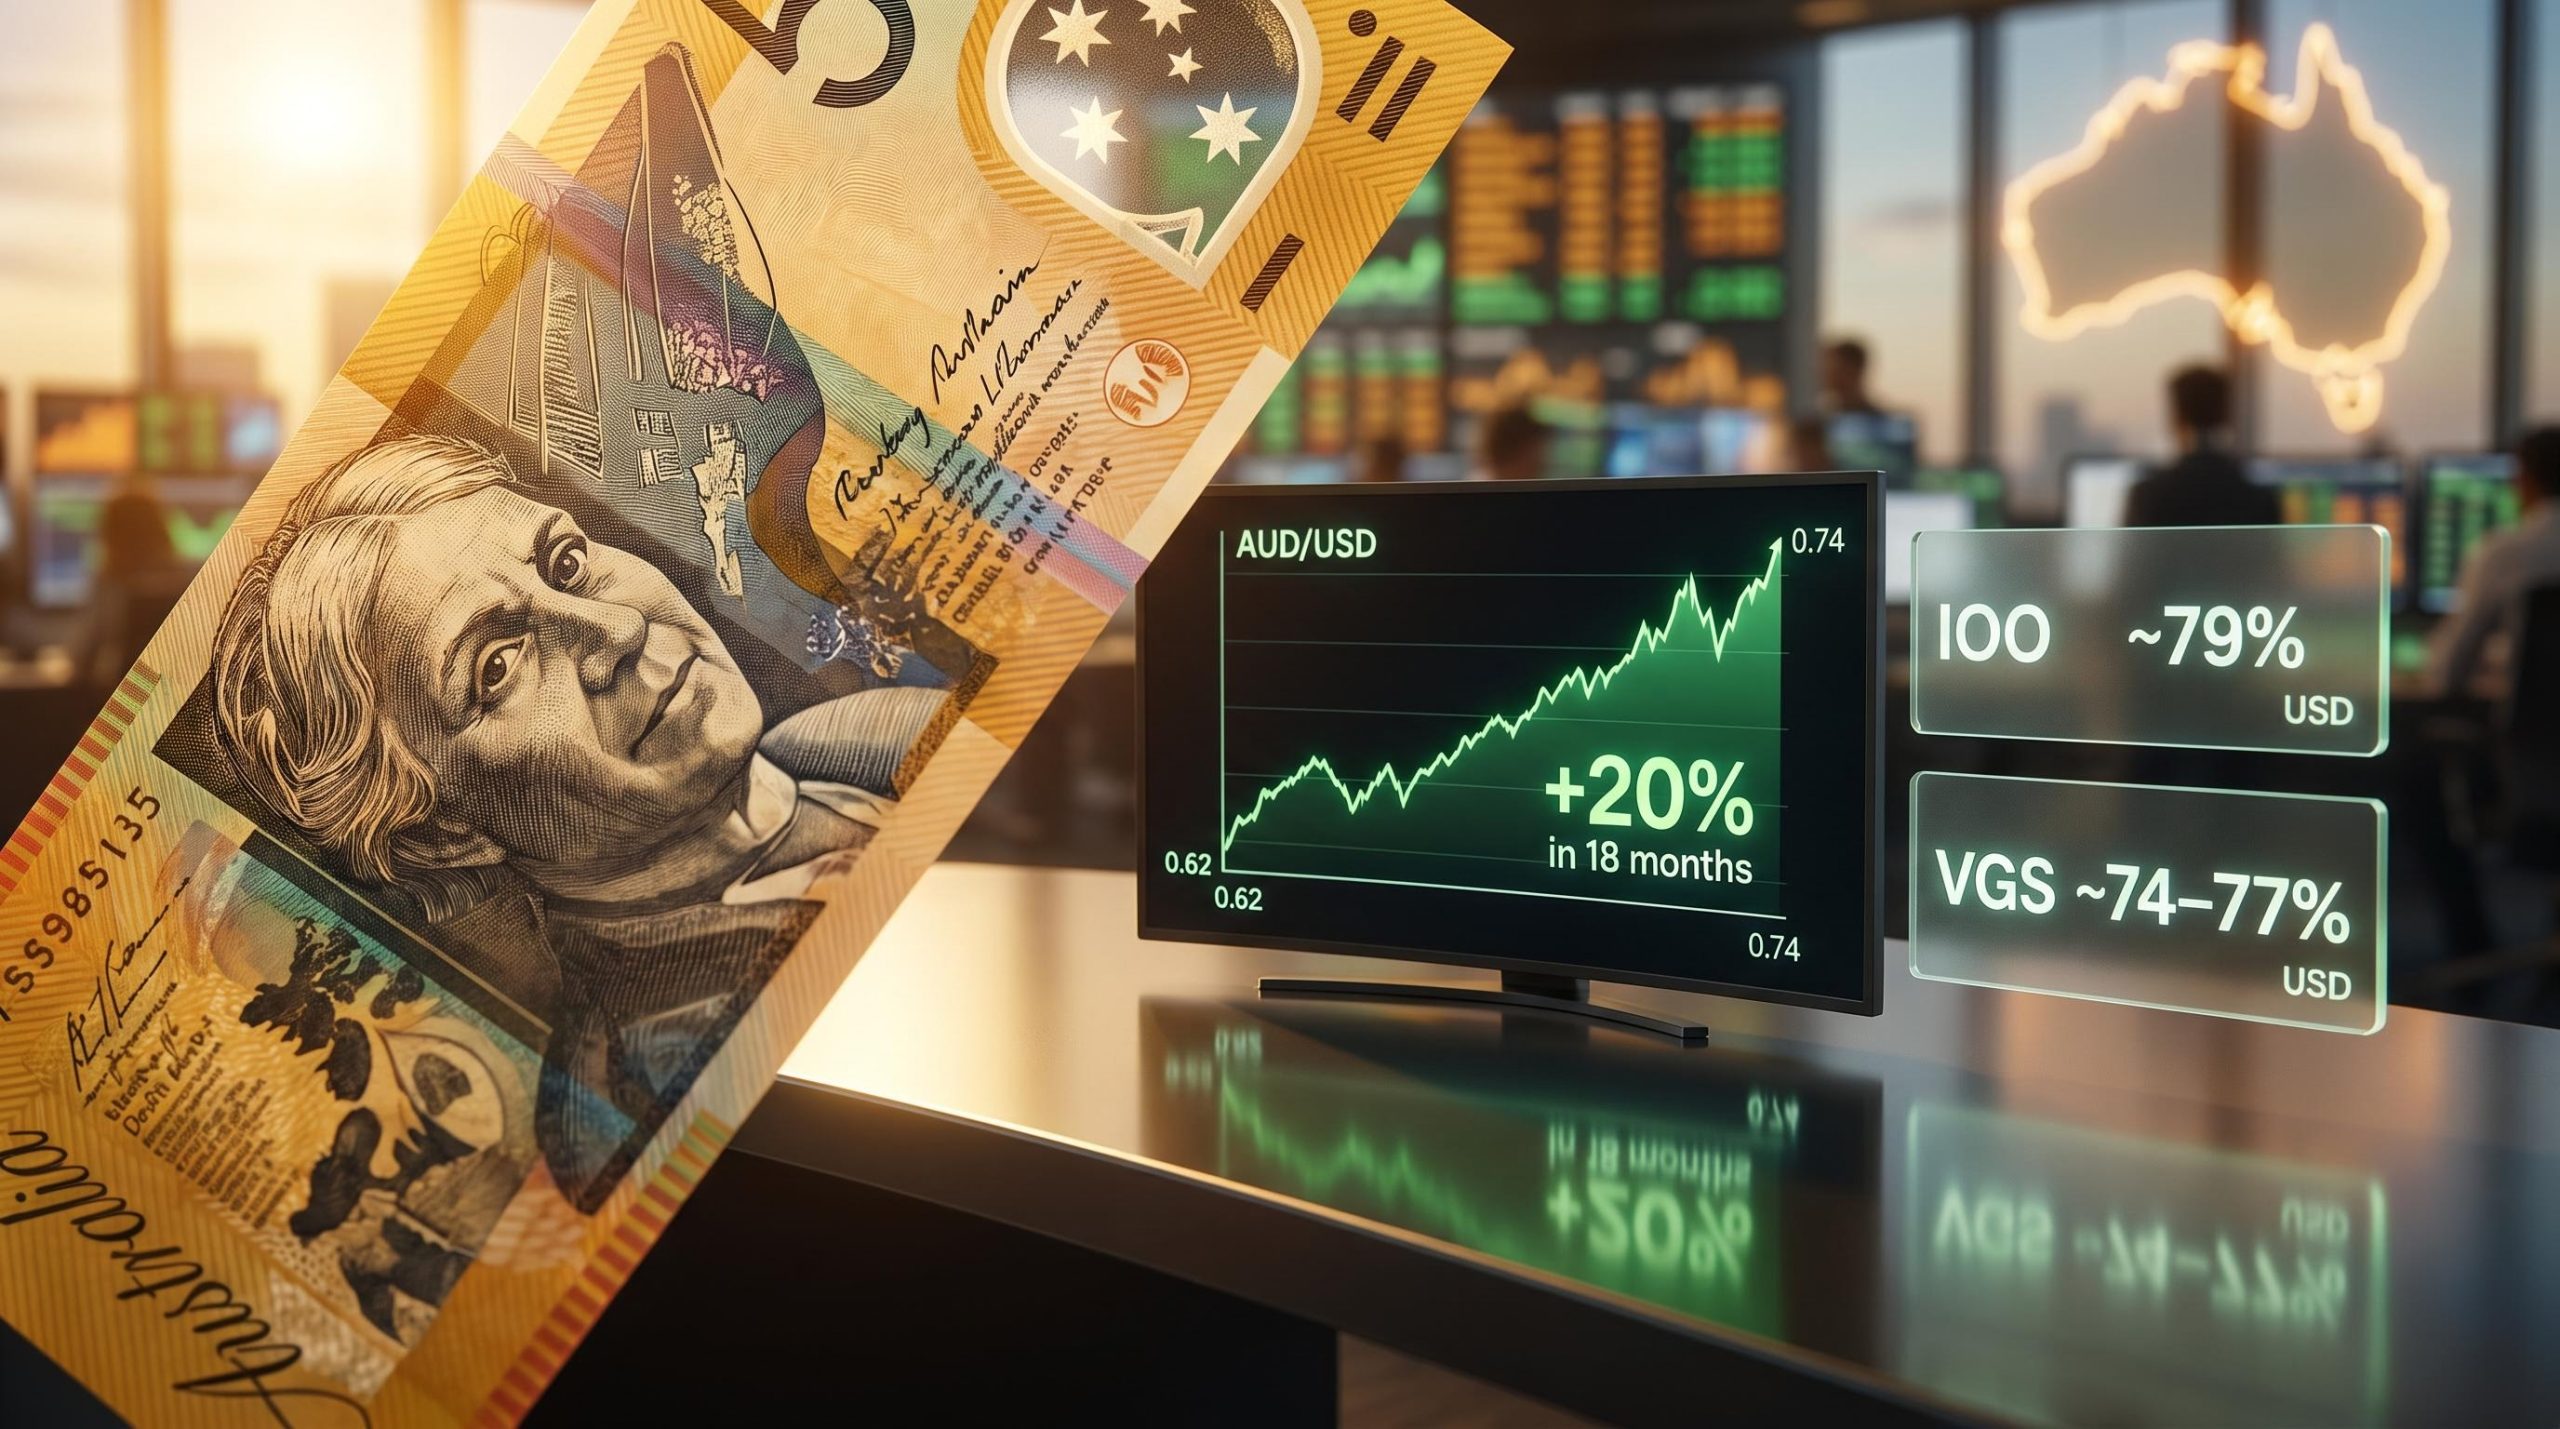
The currency risk deserves particular attention for Australian investors. The ETF carries no AUD hedging. In periods where the Australian dollar strengthens against Asian currencies, the fund’s returns in AUD terms compress, regardless of how the underlying stocks perform.
Hardware spending sustainability is the central question for the ASIA ETF’s semiconductor holdings: if hyperscalers revise 2027 capital expenditure downward because generative AI applications remain structurally unprofitable at inference scale, then SK Hynix and Samsung face an abrupt demand reversal that their combined 37% weight in the fund would transmit directly into NAV.
ASIC RG 282 ETF disclosure obligations require issuers of foreign asset funds to clearly communicate exchange rate risk to retail investors, a standard directly relevant to unhedged vehicles like the ASIA ETF where AUD movements can compress returns independent of underlying stock performance.
The ASIA ETF functions best as a satellite allocation within a core-satellite portfolio structure. It complements domestic equities and broad international exposure rather than replacing either.
Core-satellite ETF construction is the framework that makes ASIA most legible as an allocation: a low-cost broad market core (such as an S&P 500 or all-world fund) absorbs the portfolio’s volatility baseline, while a satellite like ASIA contributes thematic return potential without requiring the investor to abandon diversification across the total portfolio.
Before allocating, three questions help frame the decision:
The investor profile best suited to this ETF typically includes:
The fund’s current NAV sits at A$18.48 (as at 5 May 2026), while the last traded price was A$19.68, indicating it is trading at a premium to NAV. The three-year annualised return of 24.08% provides the medium-term recovery track record since the 2021-2022 trough, while the A$1.252 billion in funds under management confirms institutional-scale validation.
The structural underrepresentation of Asian tech in Australian portfolios is real. The growth thesis, anchored in AI semiconductor demand and Asian consumer digitalisation, is credible. The risks, from Taiwan Strait tensions to unhedged currency exposure to a 37% concentration in two South Korean memory chip makers, are also real and currently active. They are not historical footnotes.
The ASIA ETF is not a simple “Asian growth” allocation. It is a semiconductor-weighted, geopolitically exposed, unhedged AUD vehicle with a specific set of tailwinds and vulnerabilities. Investors who understand both the opportunity and the risk structure are better positioned to make a sizing decision that reflects their portfolio architecture rather than recent performance momentum.
The three-year annualised return of 24.08% represents the post-crackdown recovery that defined the current investment case; the five-year figure of 5.42% represents the full cycle. Both numbers matter.
This article is for informational purposes only and should not be considered financial advice. Investors should conduct their own research and consult with financial professionals before making investment decisions. Past performance does not guarantee future results.
The BetaShares ASIA ETF (ASX: ASIA) tracks the Solactive Asia Ex-Japan Technology and Internet Tigers Index, which holds the 50 largest technology and online retail stocks across Asia excluding Japan, with major positions in South Korean memory chip makers SK Hynix and Samsung, Taiwanese foundry TSMC, and Chinese internet platforms Alibaba and Tencent.
The ASIA ETF returned 32.82% over the one year to 31 March 2026, driven largely by semiconductor holdings, but its five-year annualised return of 5.42% over the same date reflects the full cycle including the 2021-2022 Chinese regulatory crackdowns and subsequent recovery.
The four key risks are: concentrated exposure to South Korean memory semiconductors (SK Hynix and Samsung together exceed 37% of the portfolio), unhedged currency risk across CNY, TWD, KRW, and HKD, Taiwan Strait geopolitical tension affecting TSMC, and the possibility of renewed Chinese regulatory intervention on Alibaba and Tencent.
The ASIA ETF works best as a satellite allocation within a core-satellite portfolio structure, complementing a low-cost broad market core such as an S&P 500 or all-world fund, and is most suited to investors with a five-plus year time horizon, a growth focus, and tolerance for geopolitical and currency volatility.
The ASIA ETF charges a management fee of 0.67% per annum and has a 12-month distribution yield of 0.7% paid semi-annually, confirming it is primarily a capital growth vehicle with minimal income for investors.