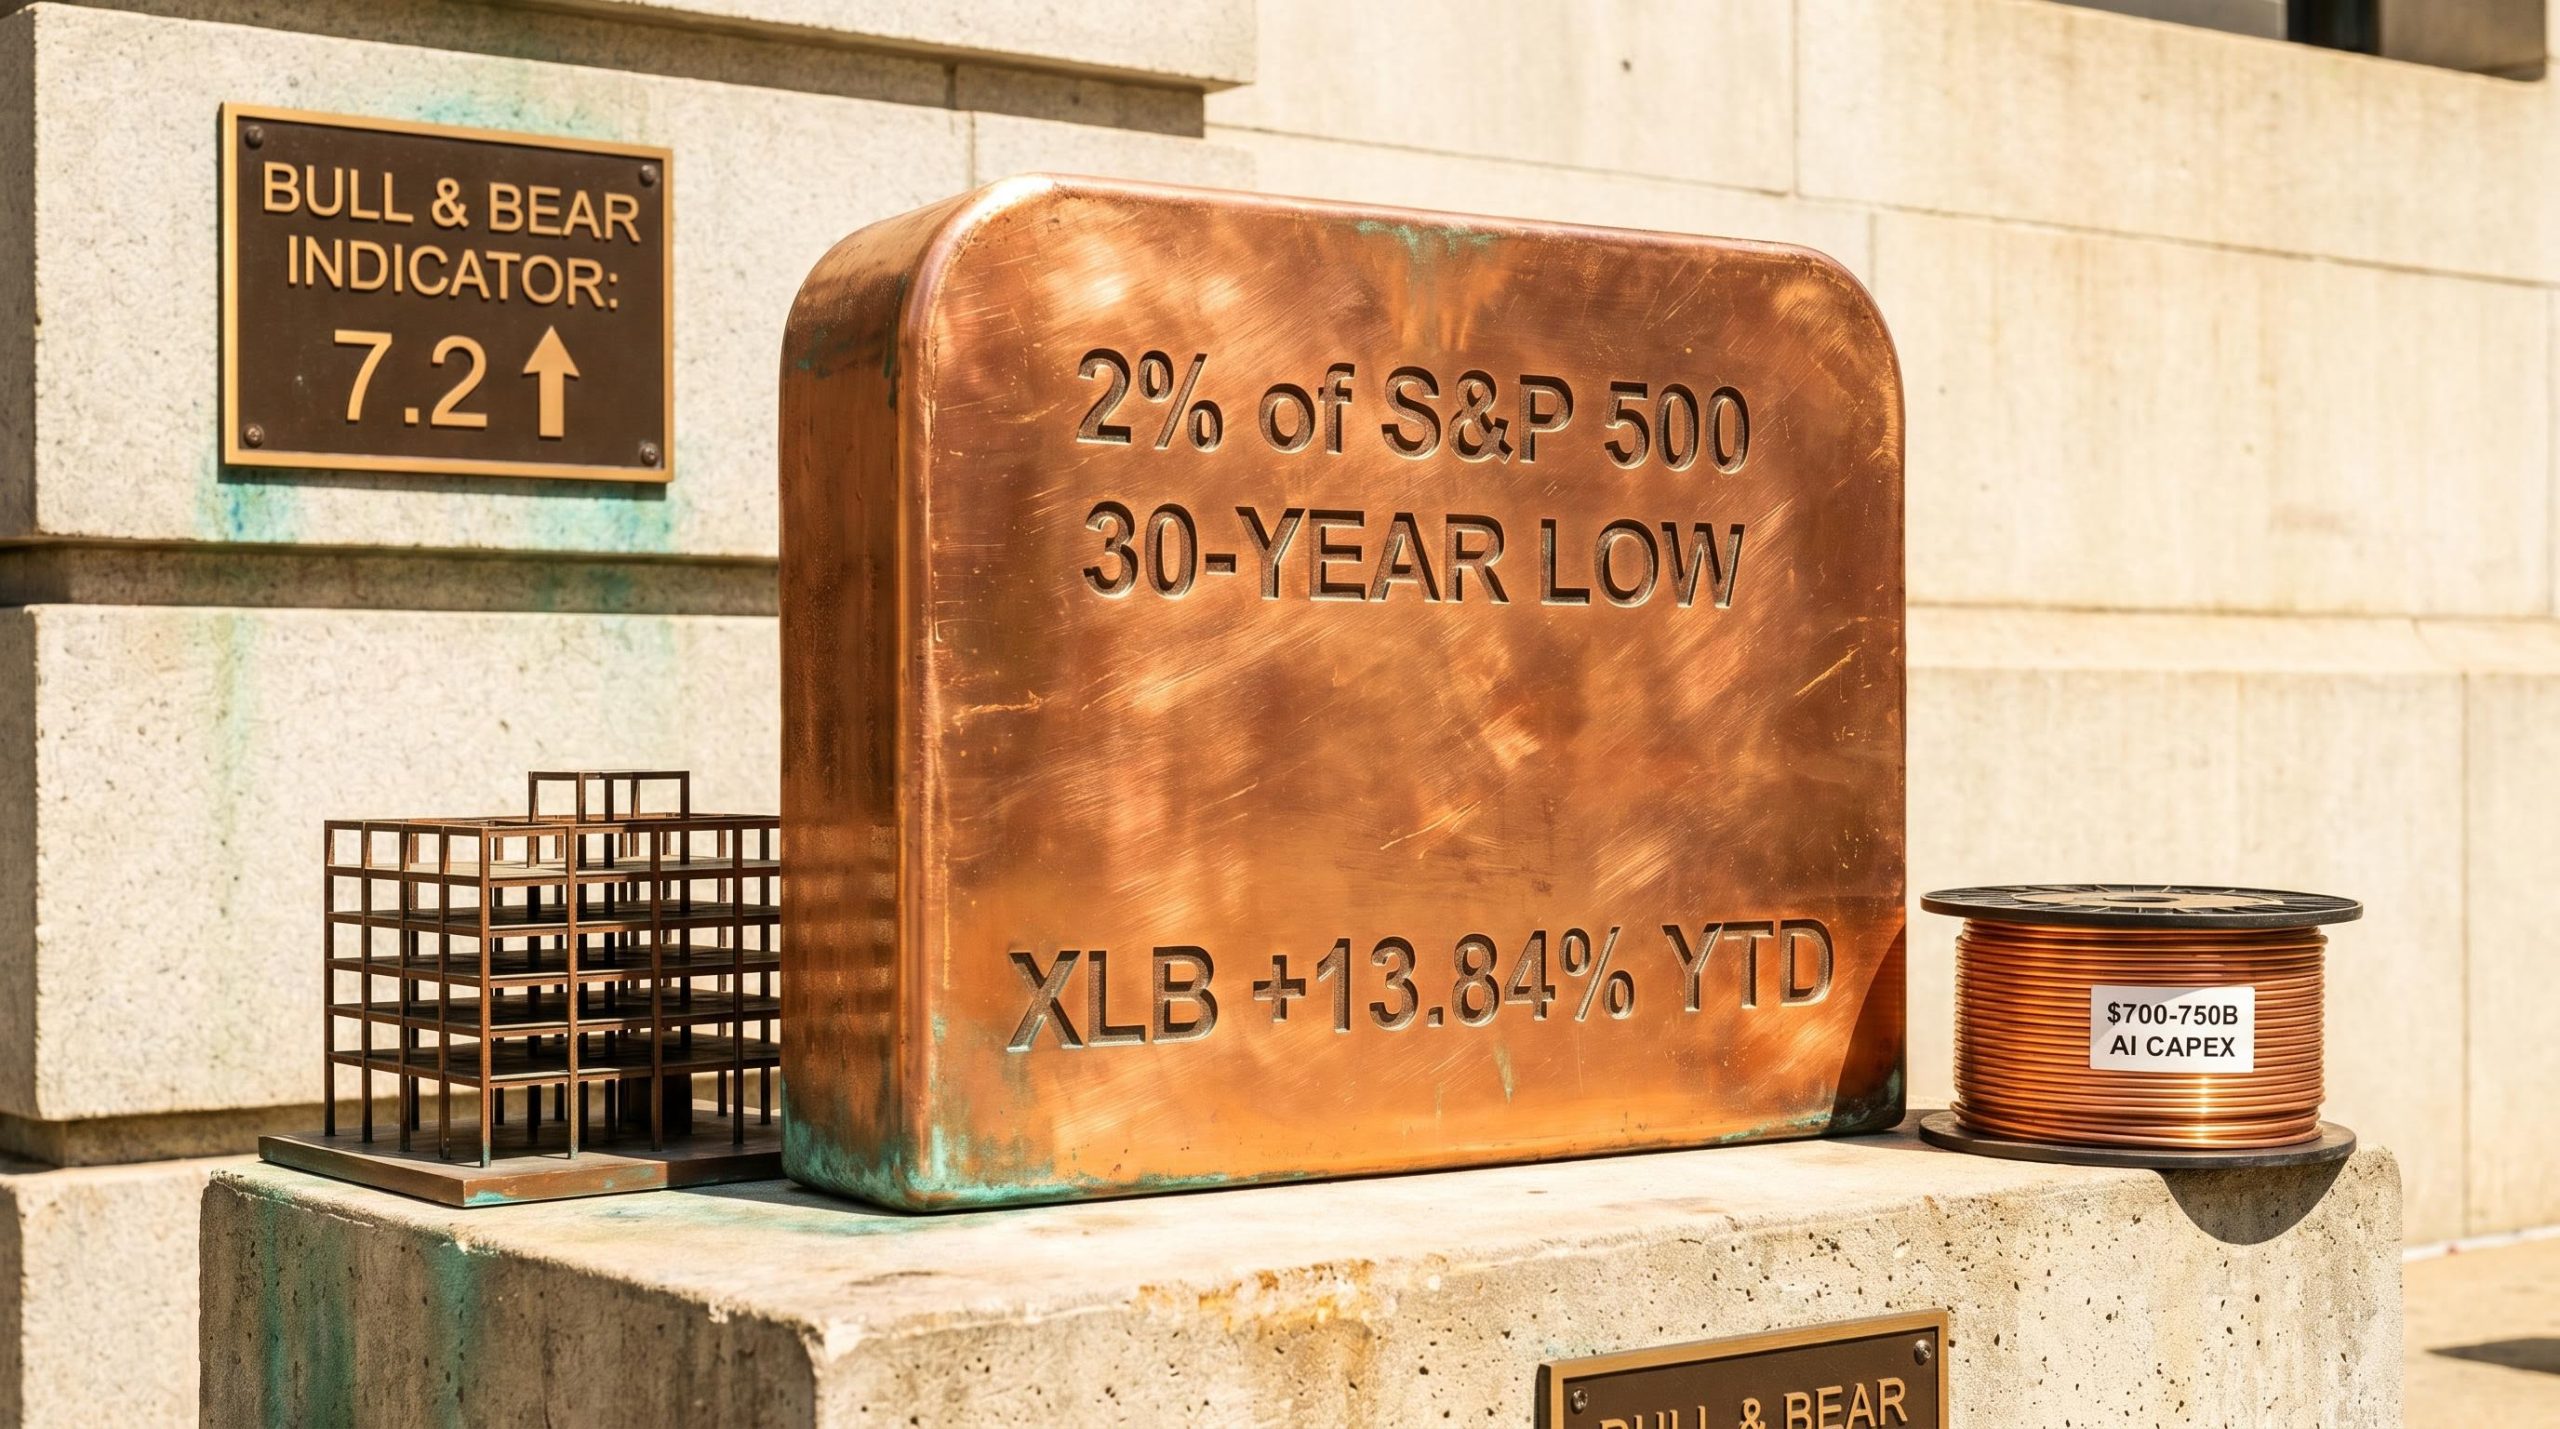
Tesla at 189x Earnings: a Guide to Valuing Transition Stocks
9 mins ago

At roughly $424 per share in early May 2026, Tesla trades at approximately 90x its estimated 2026 earnings per share. That multiple makes sense only if the company successfully transforms into an AI and robotics platform. If it does not, the numbers suggest every projected return under a realistic bear case is negative.
Tesla’s Q1 2026 earnings beat expectations on revenue ($22.4 billion, up 16% year over year), gross margin (21.7% versus a 17% consensus estimate), and adjusted EPS ($0.40 versus $0.35 expected). The beat prompted modest analyst target upgrades from Morgan Stanley ($415) and Goldman Sachs ($420). Yet Wedbush maintains a $600 target while JPMorgan-style bear models imply fair value well below current prices. The same stock, the same earnings, and a gap of hundreds of dollars between reasonable analyst targets: this is what happens when a company sits in the middle of a business model transition.
This guide uses Tesla’s Q1 2026 situation as a real-world teaching case to show investors how to build and interpret bull and bear scenarios, how to select valuation frameworks appropriate for transitioning companies, and why the price paid at entry may be the single most consequential variable in determining whether an investment succeeds.
A price-to-earnings ratio works when the earnings being measured reflect the business the market is pricing. For Pfizer at roughly 15x forward P/E, or Coca-Cola at roughly 20x, that condition holds. Earnings from pharmaceutical patents and global beverage distribution are the business. The multiple captures the growth rate, the margin profile, and the competitive position of the company as it exists today.
Tesla at approximately 90x estimated 2026 EPS breaks that logic. The core auto and energy segment represents an estimated 70-75% of 2026 revenue, yet the share price implies the market is already pricing revenue streams, autonomous driving and robotics, that do not yet appear in the financial statements.
“The market is pricing a future state, but the financial statements describe a present state.”
This is the core valuation problem for any company mid-transformation. Standard shortcuts fail because each one assumes the current financials are a reasonable proxy for the future business:
P/E ratio limitations become most consequential at the extremes: when a multiple exceeds 50x, the denominator is no longer a description of the business but a projection of a future that may or may not arrive, and any error in that projection compounds across the entire valuation.
Investors who apply these metrics to transitioning companies often either dramatically overpay for a future that never arrives or dismiss the stock entirely because the current numbers look expensive. Both errors stem from the same mistake: using a tool designed for a settled business on a company whose business model is still being decided.
Three frameworks handle the uncertainty of a business model transition more honestly than standard shortcuts. Each serves a different analytical need, and for a stock like Tesla, combining them produces a more complete picture than any single approach.
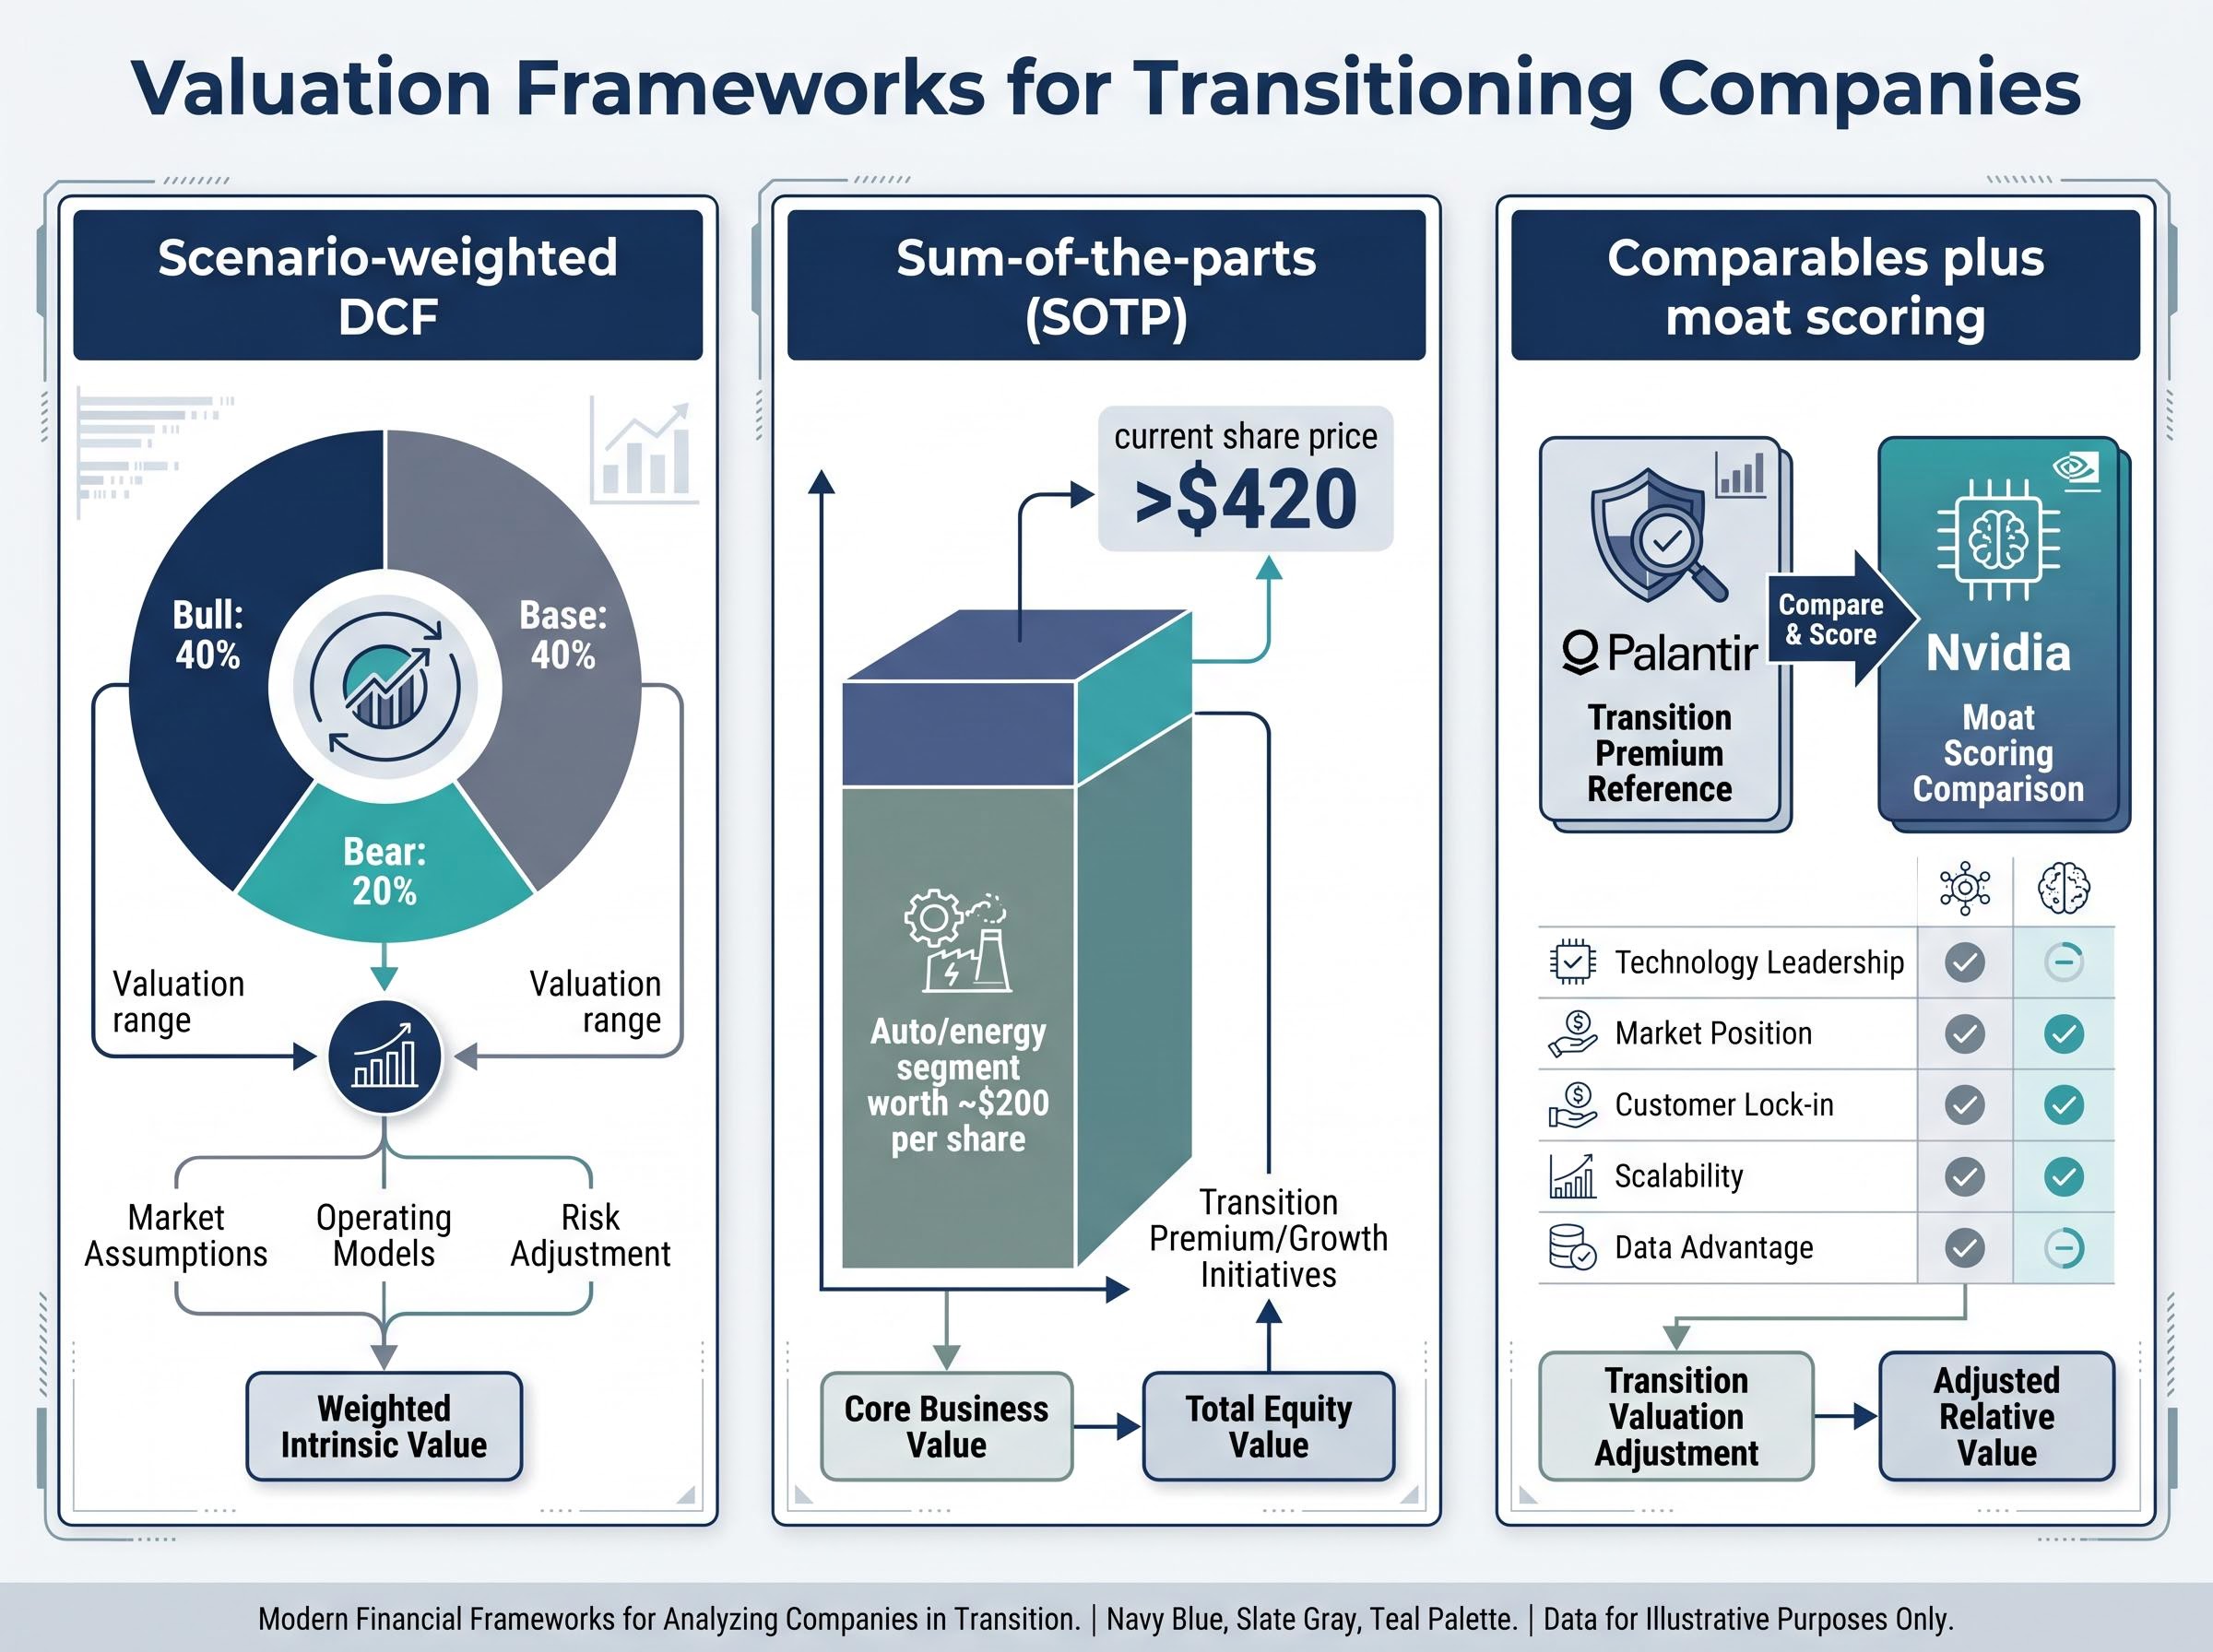
| Framework | Best used when | Tesla application |
|---|---|---|
| Scenario-weighted DCF | A company has two or more plausible futures with very different financial outcomes | Assign probabilities to autonomy scaling (bull), steady auto business (base), and delays (bear), then blend discounted cash flows into a single expected value |
| Sum-of-the-parts (SOTP) | One established business coexists with one or more speculative future businesses | Value the auto/energy segment conservatively, then ask what the remaining share price is paying for |
| Comparables plus moat scoring | High-growth names trade at wide EV/Revenue multiples (40-100x) and need qualitative differentiation | Compare Tesla’s AI-transition premium to Palantir and Nvidia, adjusted for data moat strength and regulatory positioning |
Scenario-weighted DCF is the primary tool. Rather than forcing a single set of assumptions about revenue growth and margins into one model, it assigns probabilities to multiple futures. A commonly cited illustrative weighting: 40% bull (autonomy scales), 40% base (auto business holds steady), 20% bear (delays and margin compression). The blended output captures the range of outcomes rather than pretending certainty exists.
Aswath Damodaran, NYU finance professor, has emphasised the discipline of including an explicit failure probability in scenario models for AI-pivot companies. His March 2026 commentary specifically addressed this approach, arguing that omitting the possibility of an AI thesis failing entirely produces valuations that systematically overstate fair value.
For Tesla, a sum-of-the-parts analysis starts with the core auto and energy business. Analyst frameworks suggest this segment is worth roughly $200 per share at 15-20x free cash flow, reflecting a strong but ultimately conventional electric vehicle manufacturer with above-average margins.
The gap between that $200 floor and the current share price above $420 represents what the market is paying for autonomous driving and robotics revenue that does not yet exist in Tesla’s financials. That remainder is optionality value, a bet on a specific set of outcomes. The frameworks above give investors a structured way to hold that uncertainty honestly, assigning value to the speculation without pretending it is certainty.
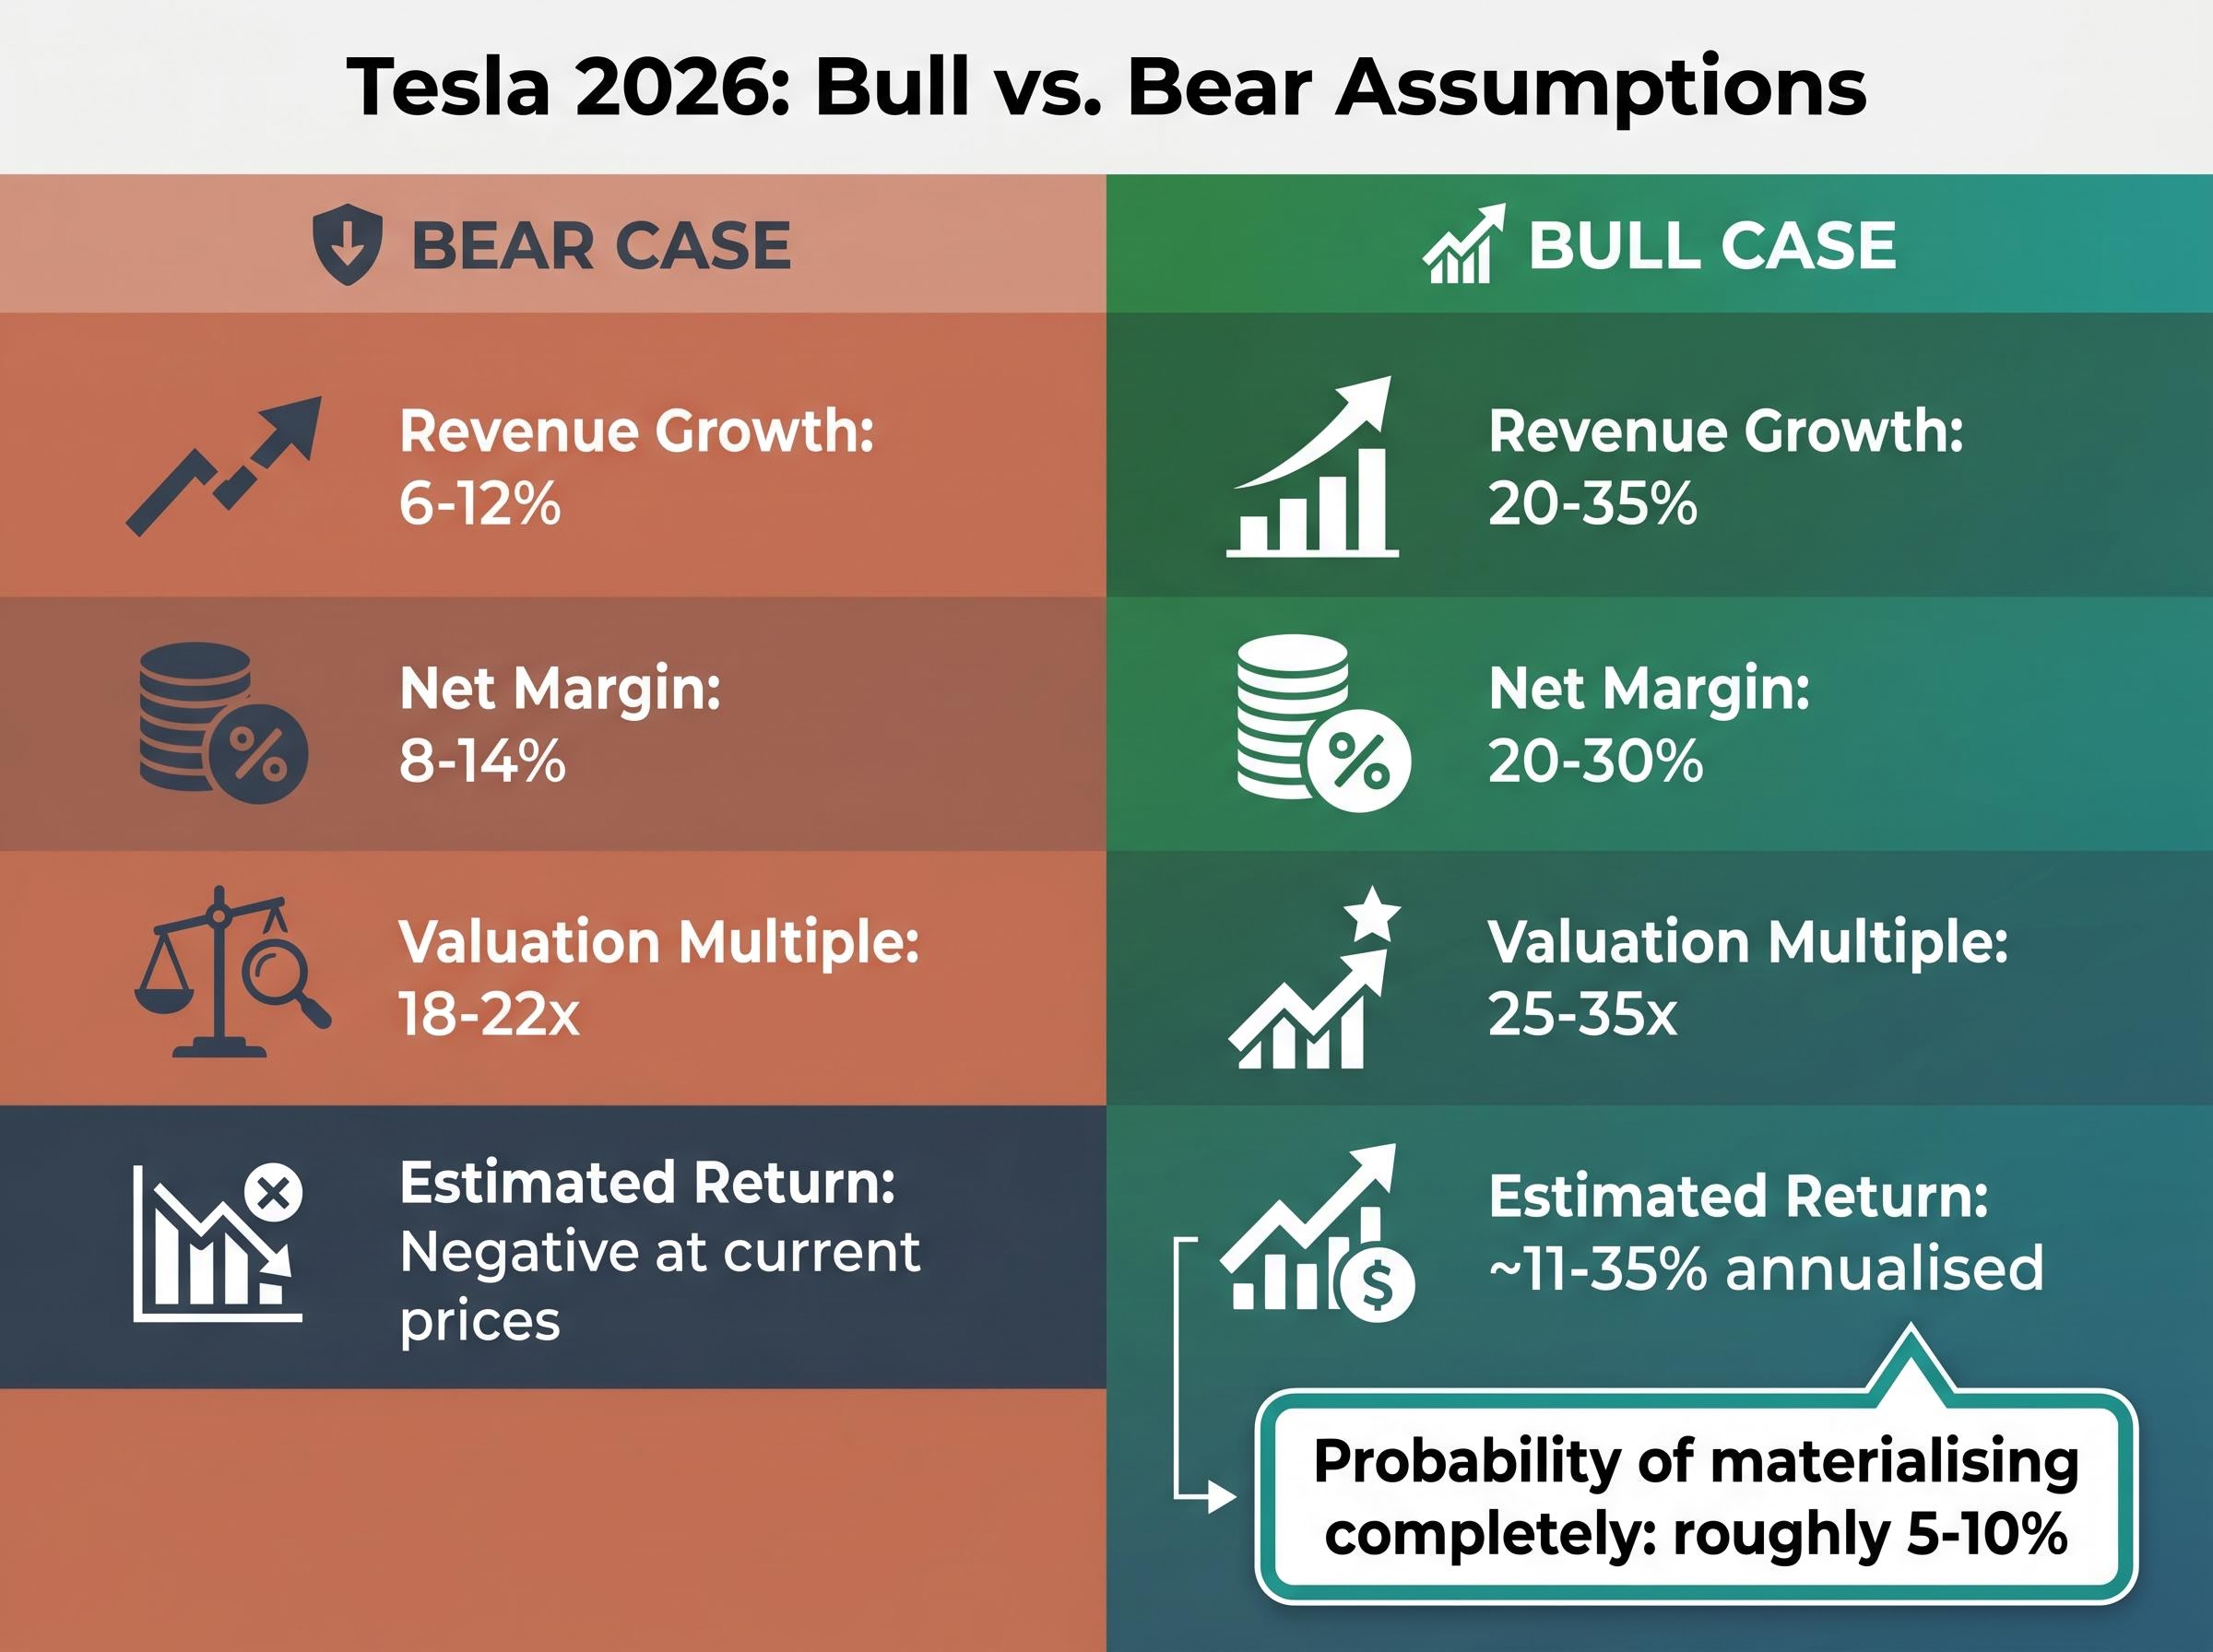
The bear case does not require Tesla to fail. It requires only that the company remains what it is today: a strong electric vehicle manufacturer with above-average automotive margins, but one where autonomous driving and robotics do not contribute meaningful revenue by 2030.
Under this scenario, the assumptions move in sequence. Revenue growth slows to a range of 6-12% annually (midpoint approximately 9%), reflecting intensifying competition. BYD has already surpassed Tesla in global EV volume, and JPMorgan-style models cap 2026 revenue near $90 billion under margin compression. Net profit margins settle between 8-14%, well above the auto industry average but well below the software-like margins the bull case requires. The market re-rates the stock to 18-22x earnings, a premium to legacy automakers but far below the current 90x.
BYD surpassing Tesla in global EV volume in 2025 marked a structural shift in the competitive landscape, with BYD recording higher full-year sales figures and reinforcing the bear case assumption that pricing pressure and market share erosion will cap revenue growth in Tesla’s core automotive segment.
| Assumption category | Low end | Midpoint | High end |
|---|---|---|---|
| Revenue growth (annual) | 6% | 9% | 12% |
| Net profit margin | 8% | 11% | 14% |
| Valuation multiple | 18x | 20x | 22x |
Run those inputs through a simple earnings-based model, and the result is consistent across the range.
“At approximately $375 per share, every projected return outcome under bear case assumptions was negative.”
Even the high-end bear case, 12% revenue growth with 14% margins and a 22x multiple, does not produce a positive return from a $375 entry point over a 10-year horizon. The current share price above $420 deepens that deficit further. The bear case teaches investors to ask the question that matters most: at the current price, what am I actually buying? If the transformation does not happen, the answer is a business worth considerably less than what the market is charging for it today.
The bull case deserves genuine analytical respect because it is not irrational. It is specific, and specificity is what makes it testable.
Under the bull scenario, Tesla achieves full Level 4 autonomous capability, deploys a profitable Robotaxi network at scale, and generates material commercial revenue from Optimus humanoid robots. The business transitions from hardware-centric automotive margins to software-like recurring revenue. Revenue growth accelerates to 20-35% annually (midpoint approximately 27%). Net profit margins expand to 20-30%, compared to the current 7-10% range. The market rewards this transformation with a 25-35x earnings multiple, and estimated annualised returns over a 10-year horizon fall in the range of approximately 11-35%.
| Scenario | Revenue growth | Net margin | Multiple | Estimated return |
|---|---|---|---|---|
| Bear case | 6-12% | 8-14% | 18-22x | Negative at current prices |
| Bull case | 20-35% | 20-30% | 25-35x | ~11-35% annualised |
The probability question matters. Analysts and valuation specialists estimate the full bull case has roughly a 5-10% probability of materialising completely, which means the return potential must be large enough to justify that risk-weighted bet.
Rather than holding a bull thesis on faith, investors can monitor a specific set of milestones that signal whether the transformation is progressing or stalling:
California DMV’s updated AV regulations, adopted in April 2026, strengthened oversight and enforcement requirements for autonomous vehicle operators while also expanding the categories of vehicles eligible for testing and deployment permits, setting the regulatory baseline that any commercial Level 4 rollout in the state must satisfy.
Each missed milestone should prompt a thesis reassessment rather than a rationalisation. Elon Musk’s own timeline track record provides useful calibration: a 2016 claim that all Tesla hardware was full-autonomy ready, a 2019 prediction of one million Robotaxis by end of 2020, and a 2021 statement that Optimus would be deployment-ready in 2022. None materialised on schedule.
Howard Marks of Oaktree Capital warned in a December 2025 memo about AI bubble parallels, drawing comparisons to prior technology cycles. The cautionary cases are already visible in 2026: Snowflake is down approximately 35% year-to-date on concerns about AI spending relative to revenue growth, UiPath has seen RBC cut its price target to $17 amid a challenged pivot from robotic process automation to AI, and C3.ai reported a 46% revenue decline in Q3 fiscal 2026. High-multiple transformation names compress sharply and quickly when milestones are missed.
AI valuation frameworks applied across the broader market in 2026 produce notably split verdicts: the Shiller CAPE ratio at 40.11 sits at levels historically associated with prior bubble peaks, yet combined hyperscaler capital expenditure of approximately $705-725 billion and measurable earnings growth distinguish the current cycle from prior episodes where the underlying revenues were largely theoretical.
The question is not whether Tesla is a good company. The question is whether Tesla is a good investment at this price.
Consider two investors. One purchased shares a few years prior at approximately $100 per share. The other is evaluating an entry today at $424. The underlying business is identical. The autonomous driving programme is the same. The Optimus roadmap is the same. The bull and bear case assumptions are the same. Yet the probability-weighted expected returns for these two investors are completely different, because entry price transforms the risk and return mathematics even when nothing else changes.
At 90x estimated 2026 earnings, the current share price has already priced in a very large portion of the expected good news. The forward analyst consensus projects EPS growing more than 5x from current levels. That is the embedded assumption; it is what the buyer at $424 is paying for. If that growth materialises, the upside is compressed because it was already in the price. If it does not, the stock peaked near $450 per share, and analyst EPS estimates have previously declined more than 90% from peak before recovering, illustrating how violently the projections embedded in high-multiple stocks can collapse.
Before paying a premium multiple for any transitioning company, four questions deserve answers:
Dollar-cost averaging into a high-multiple position reduces the risk that a single entry price locks in the worst possible return distribution, though the historical data shows lump-sum deployment outperforms staged entry in approximately 68-73% of periods, making the decision between them as much about behavioural risk tolerance as mathematics.
“Even a company that executes its transformation perfectly can be a poor investment if the stock price already priced in that success before you bought.”
This is the single most consequential variable in the guide. Knowing the business is necessary. Knowing what you are paying for it determines whether the investment succeeds.
The bull and bear scenario methodology applied to Tesla here works for any company whose current valuation embeds a future that has not happened yet, from AI infrastructure plays to biotech pipeline companies to early-stage fintech names. The ticker changes; the discipline does not.
Three steps carry forward to the next investment decision:
Before buying any high-multiple stock, an investor should be able to describe, in one sentence, the specific milestone that would tell them the bull case is off track. If that sentence cannot be written, the position is a belief, not a thesis.
Valuation is not about finding the right answer. It is about understanding which question the current stock price is asking you to answer.
This article is for informational purposes only and should not be considered financial advice. Investors should conduct their own research and consult with financial professionals before making investment decisions. Past performance does not guarantee future results. Financial projections are subject to market conditions and various risk factors.
A scenario-weighted DCF assigns explicit probabilities to multiple future outcomes, such as a bull, base, and bear case, and blends the discounted cash flows into a single expected value. A standard DCF forces one set of assumptions into a single point estimate, which can be misleading for companies whose business model is still being decided.
P/E ratios assume the current earnings being measured reflect the business the market is pricing, but for a transitioning company trading at a high multiple, the price already embeds future revenue streams that do not yet appear in the financial statements, making the ratio a projection rather than a description of the current business.
Entry price transforms the risk and return mathematics even when the underlying business is identical; a buyer at a high price has already paid for a large portion of the expected good news, compressing upside if growth materialises and deepening losses if it does not.
Sum-of-the-parts valuation separates an established business from speculative future segments, assigning conservative multiples to the known business and treating the remaining share price as optionality value; it is most useful when one mature segment coexists with one or more unproven future revenue streams.
Investors should monitor specific, testable milestones such as gross margin trends, regulatory approvals for new products or services, progress from internal pilots to external revenue-generating contracts, competitive cost comparisons, and free cash flow inflection points within a defined timeframe.