How Zero Commissions Changed the Maths on Thematic ETFs
4 hrs ago
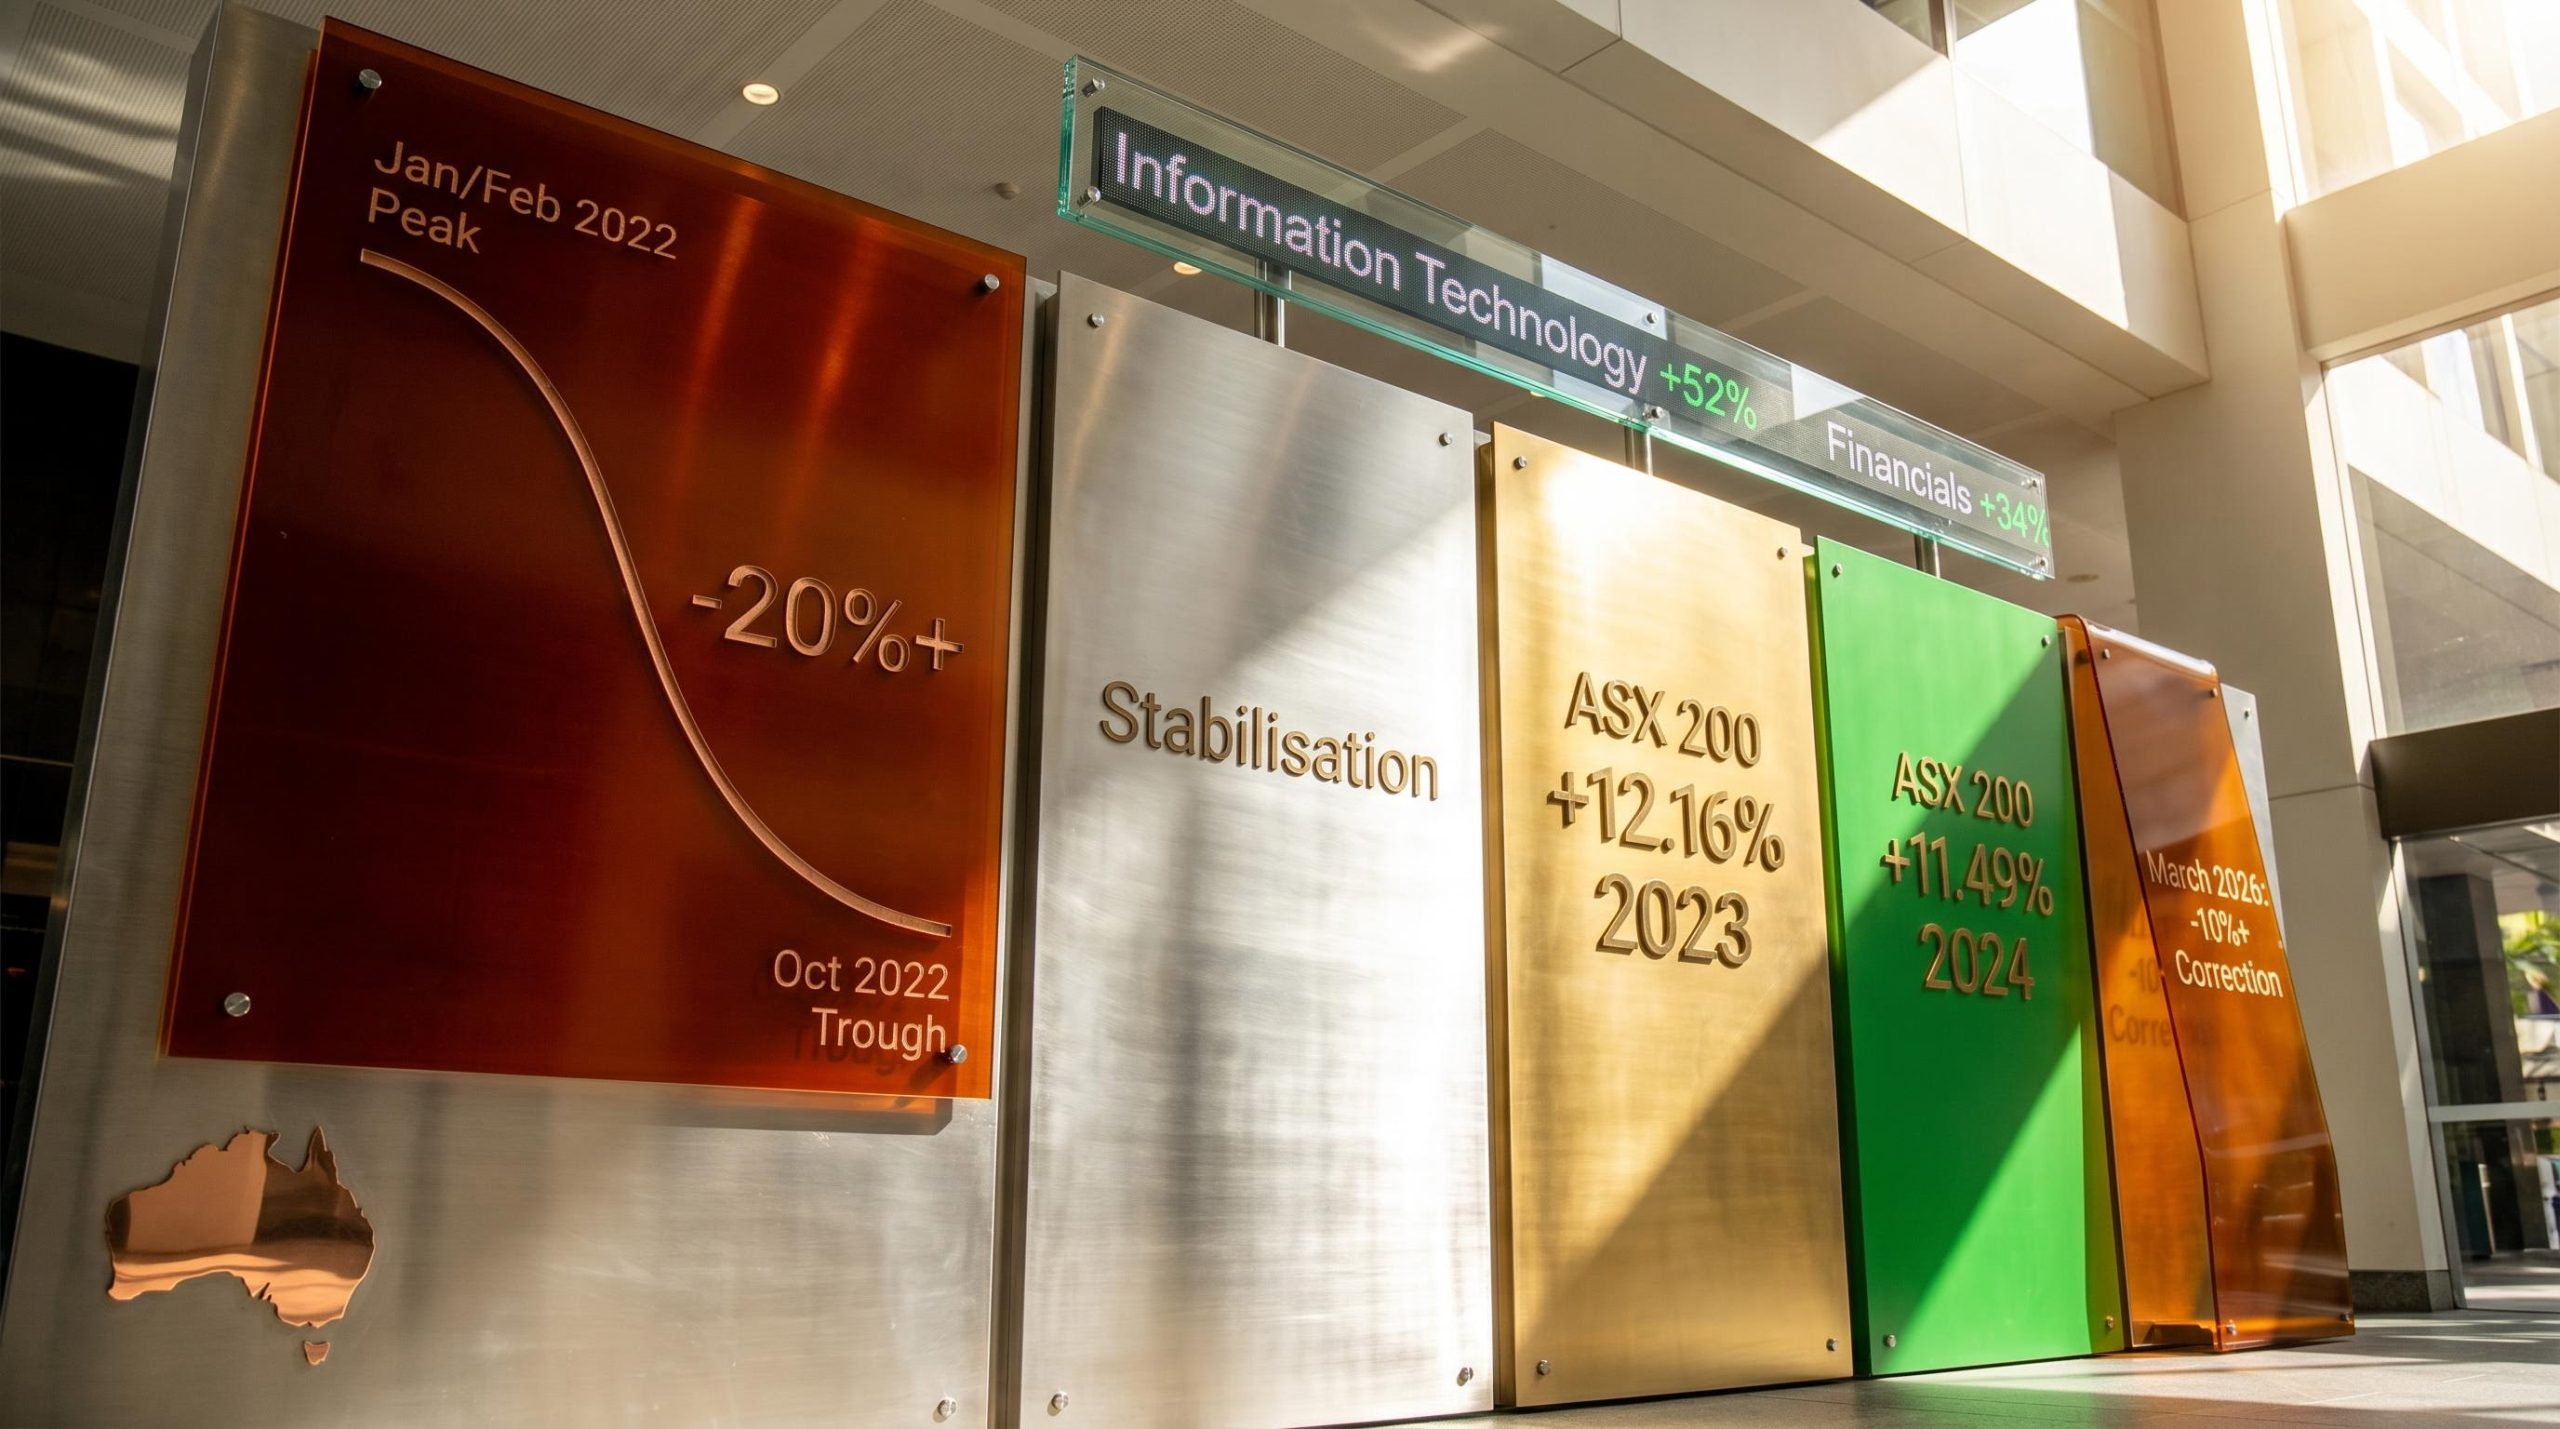
In 2022, Australian investors experienced one of the rare market environments where equities and bonds fell simultaneously, stripping away the diversification buffer that most portfolios relied on. The ASX 200 slid from its early-year peak to an October 2022 trough while the Reserve Bank of Australia (RBA) raised rates at the fastest pace in a generation. That year marked the beginning of a complete ASX market cycle, one that moved through the full sequence of drawdown, stabilisation, early recovery, and sustained rebound within a compressed timeframe. For investors trying to understand how cycles work in practice rather than in theory, the 2022-to-2024 window is the case study closest to hand.
What follows traces how each phase of that cycle unfolded, what drove the transitions between phases, which sectors led and which lagged, and how investor behaviour shaped outcomes at every turn. The result is a concrete framework for reading the next cycle, grounded in events that most Australian investors either lived through or can now examine with the benefit of hindsight.
The standard assumption behind most Australian retail portfolios is straightforward: when equities fall, bonds rise, and the blend cushions the blow. In 2022, that assumption broke. Equities and fixed income declined together, leaving portfolios with nowhere to hide. The result was not simply a bad year for returns; it was a structural failure of the diversification model that most investors had relied on for decades.
Several forces converged to produce this outcome:
Broad global indices fell more than 20% from prior highs during the year, confirming the conventional bear market threshold. The ASX 200 bear market ran from approximately its January-February 2022 peak to its October 2022 trough.
The ASX 200’s heavy weighting toward financials and materials gave the domestic index a distinct risk profile relative to a more technology-heavy benchmark like the S&P 500. Financials faced pressure from rising borrowing costs and cyclical sensitivity to economic slowdown risk. Technology names, though a smaller share of the ASX, absorbed the sharpest declines as discount rate mechanics worked against growth valuations.
Materials and energy, however, provided relative outperformance during the early rate-hiking phase. Commodity price dynamics, driven partly by the same geopolitical forces that were causing broader damage, offered partial domestic insulation that was unavailable in markets with heavier technology exposure.
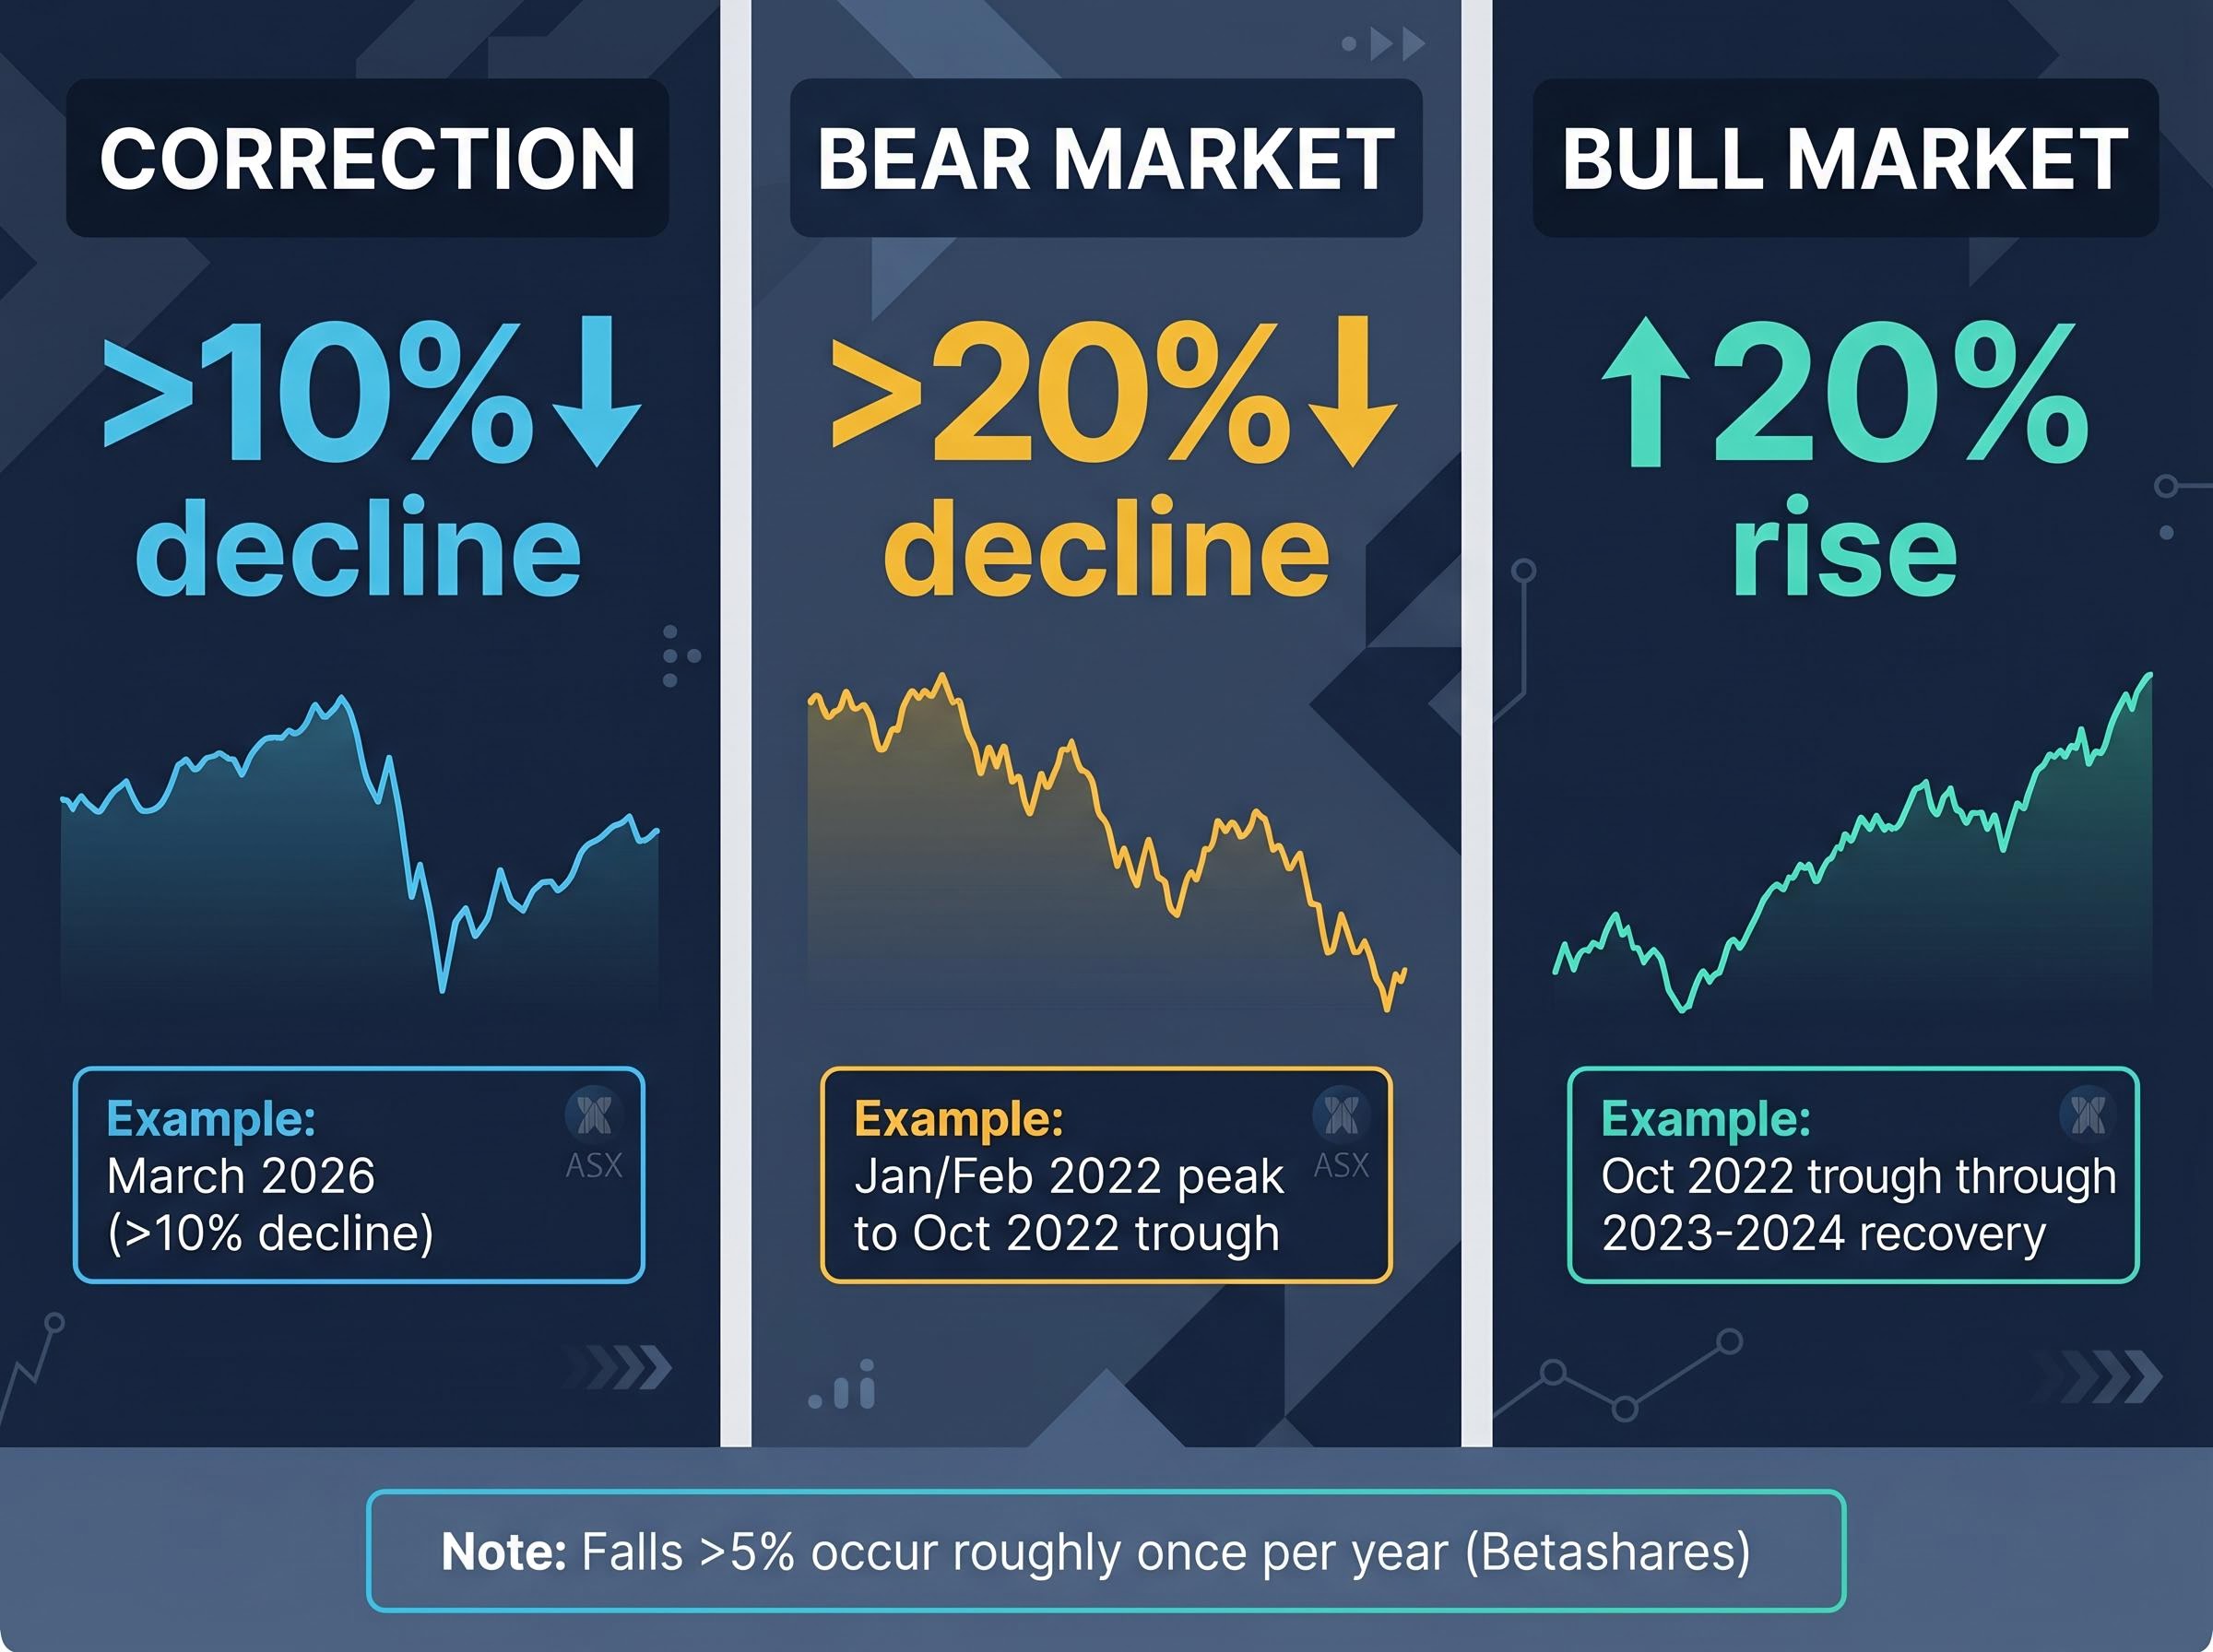
A bear market is conventionally defined as a decline of 20% or more from a recent peak, sustained over time rather than recovered within days or weeks. The threshold is a convention, not a mechanical trigger; no alarm sounds when an index crosses 20%, and markets do not behave differently at 19.9% versus 20.1%. But the label matters because it signals a shift in the character of the decline, from a temporary pullback to a sustained cycle-phase transition.
A bear market is conventionally defined as a decline of 20% or more from a recent peak, sustained over time. A bull market is confirmed when prices rise 20% or more from a prior trough. These thresholds are conventions, not precise mechanical triggers.
A correction, by contrast, is a decline of 10% or more, typically shorter-lived and less likely to signal a fundamental shift in the market’s direction. According to Betashares, falls of more than 5% occur roughly once per year on average, meaning some degree of volatility is a normal feature of equity markets rather than a warning sign in itself.
| Phase | Threshold | Typical Duration | ASX 2022-2024 Example |
|---|---|---|---|
| Correction | 10%+ decline from peak | Weeks to months | March 2026: 10%+ decline |
| Bear Market | 20%+ decline from peak | Months to over a year | Jan/Feb 2022 peak to Oct 2022 trough |
| Bull Market | 20%+ rise from trough | Years (typically longer than bear phases) | Oct 2022 trough through 2023-2024 recovery |
For calibration, the 2020 COVID crash saw the ASX 200 fall approximately 35% before recovering fully in around 13 months. The 2022 downturn was shallower but more psychologically corrosive, because it unfolded gradually and removed the bond hedge that had worked reliably in 2020.
The headline numbers told a clear recovery story. The ASX 200 delivered a total return of 12.16% in 2023 and 11.49% in 2024, confirming that the bear market phase had ended and a sustained rebound was under way. At the index level, the recovery was real and substantial.
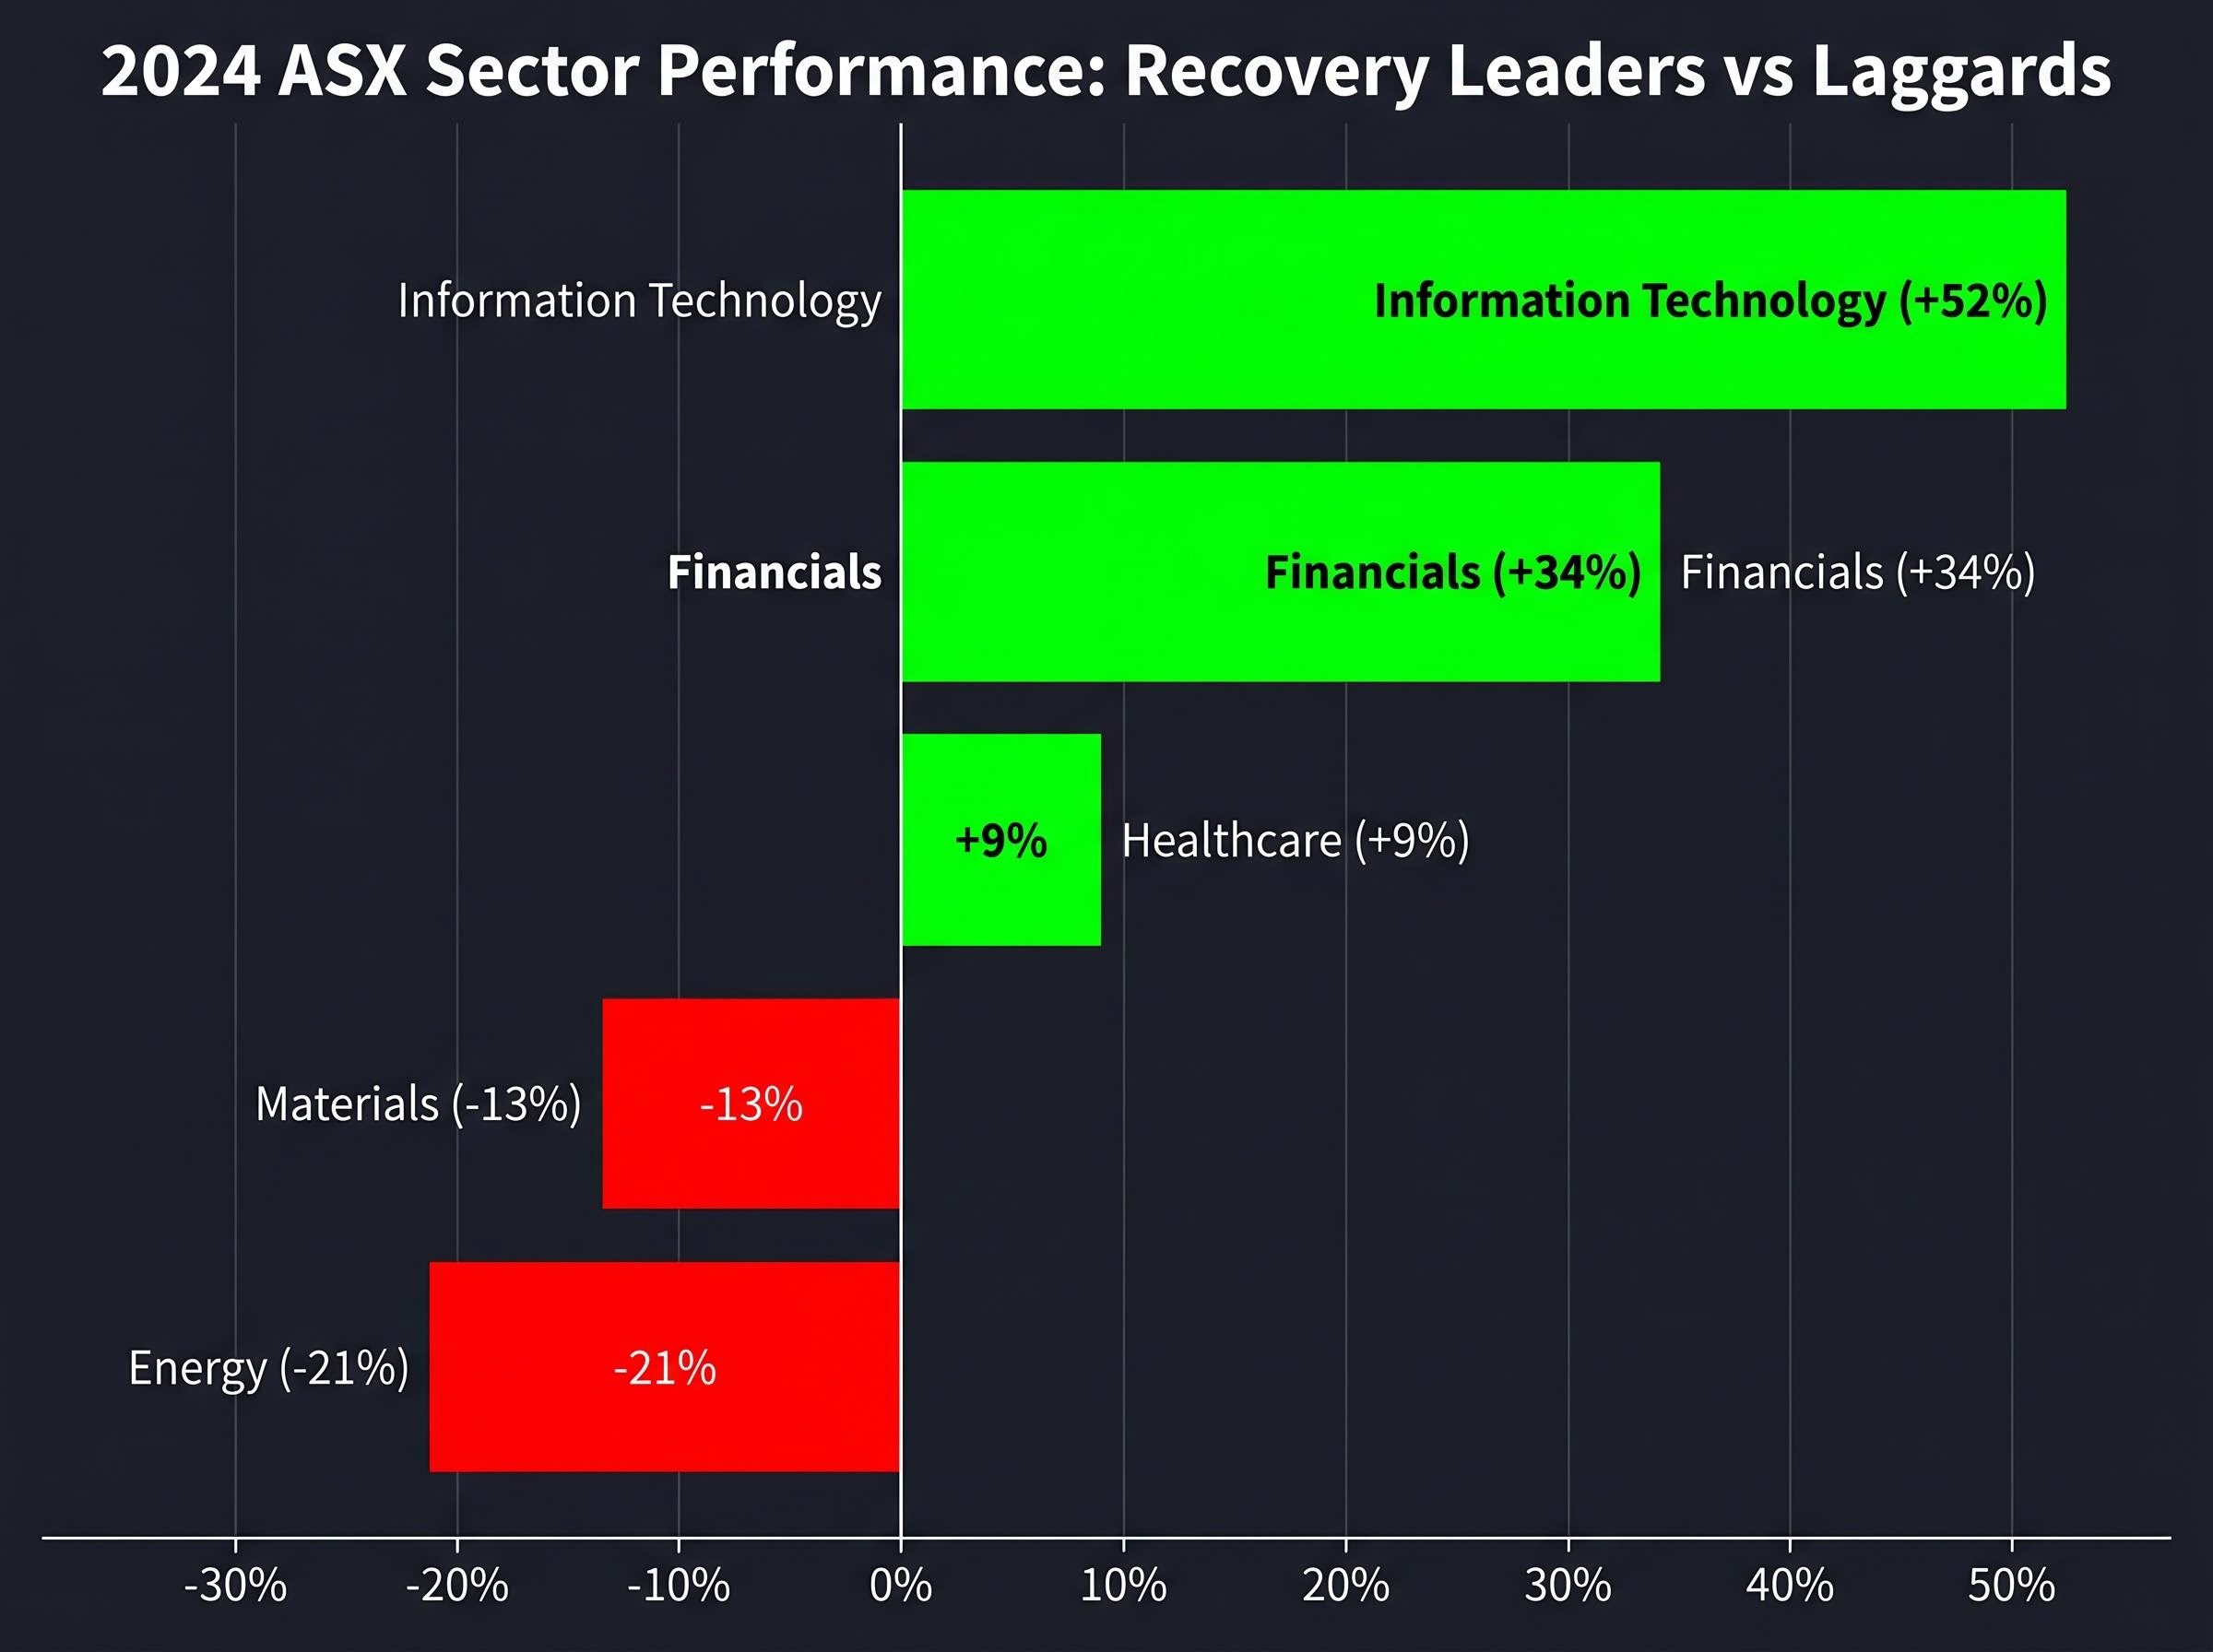
Beneath the surface, the picture was far less uniform. The sectors that had provided shelter during the 2022 downturn became laggards, and the sectors that had absorbed the worst damage led the rebound.
Information Technology returned +52% on the ASX in 2024, the single largest sector gain during the recovery and a measure of how dramatically the rotation reversed the downturn’s dynamics.
The mechanism behind this rotation was the unwinding of the same discount rate compression that had caused the damage. As rate-hike expectations peaked and began reversing, the present value of future earnings for growth stocks recovered, re-rating technology and financials upward. Financials returned +34% in 2024, while Healthcare gained +9%.
Energy and materials, the sectors that had benefited from commodity price tailwinds during the rate-hiking phase, moved in the opposite direction. Energy fell -21% in 2024 and Materials declined -13%, as the macro conditions that had supported commodity prices shifted.
| Sector | 2024 Return (%) | Phase Role |
|---|---|---|
| Information Technology | +52% | Recovery leader |
| Financials | +34% | Recovery leader |
| Healthcare | +9% | Moderate recovery |
| Energy | -21% | Laggard (shelter in 2022 downturn) |
| Materials | -13% | Laggard (shelter in 2022 downturn) |
This rotation is one of the most consistent patterns across market cycles. Investors who recognised the mechanism, rising rates compressing growth valuations and falling rates expanding them, could have positioned more deliberately at the transition point rather than waiting for broad index confirmation.
The 2022-2024 cycle illustrates the sector rotation risk that concentrated thematic exposure creates: Australian ETF investors holding technology-themed products faced up to 25% drawdowns in 2026 while the same rotation that drove those losses simultaneously delivered triple-digit returns in resources and energy, a pattern that broad market ETFs navigated automatically through index rebalancing.
The ASX 200’s 2023-2024 recovery was strong in absolute terms. In relative terms, it lagged meaningfully behind the S&P 500, and the gap was not random. It reflected a structural difference in index composition that left Australian investors underexposed to the dominant theme driving global equity returns.
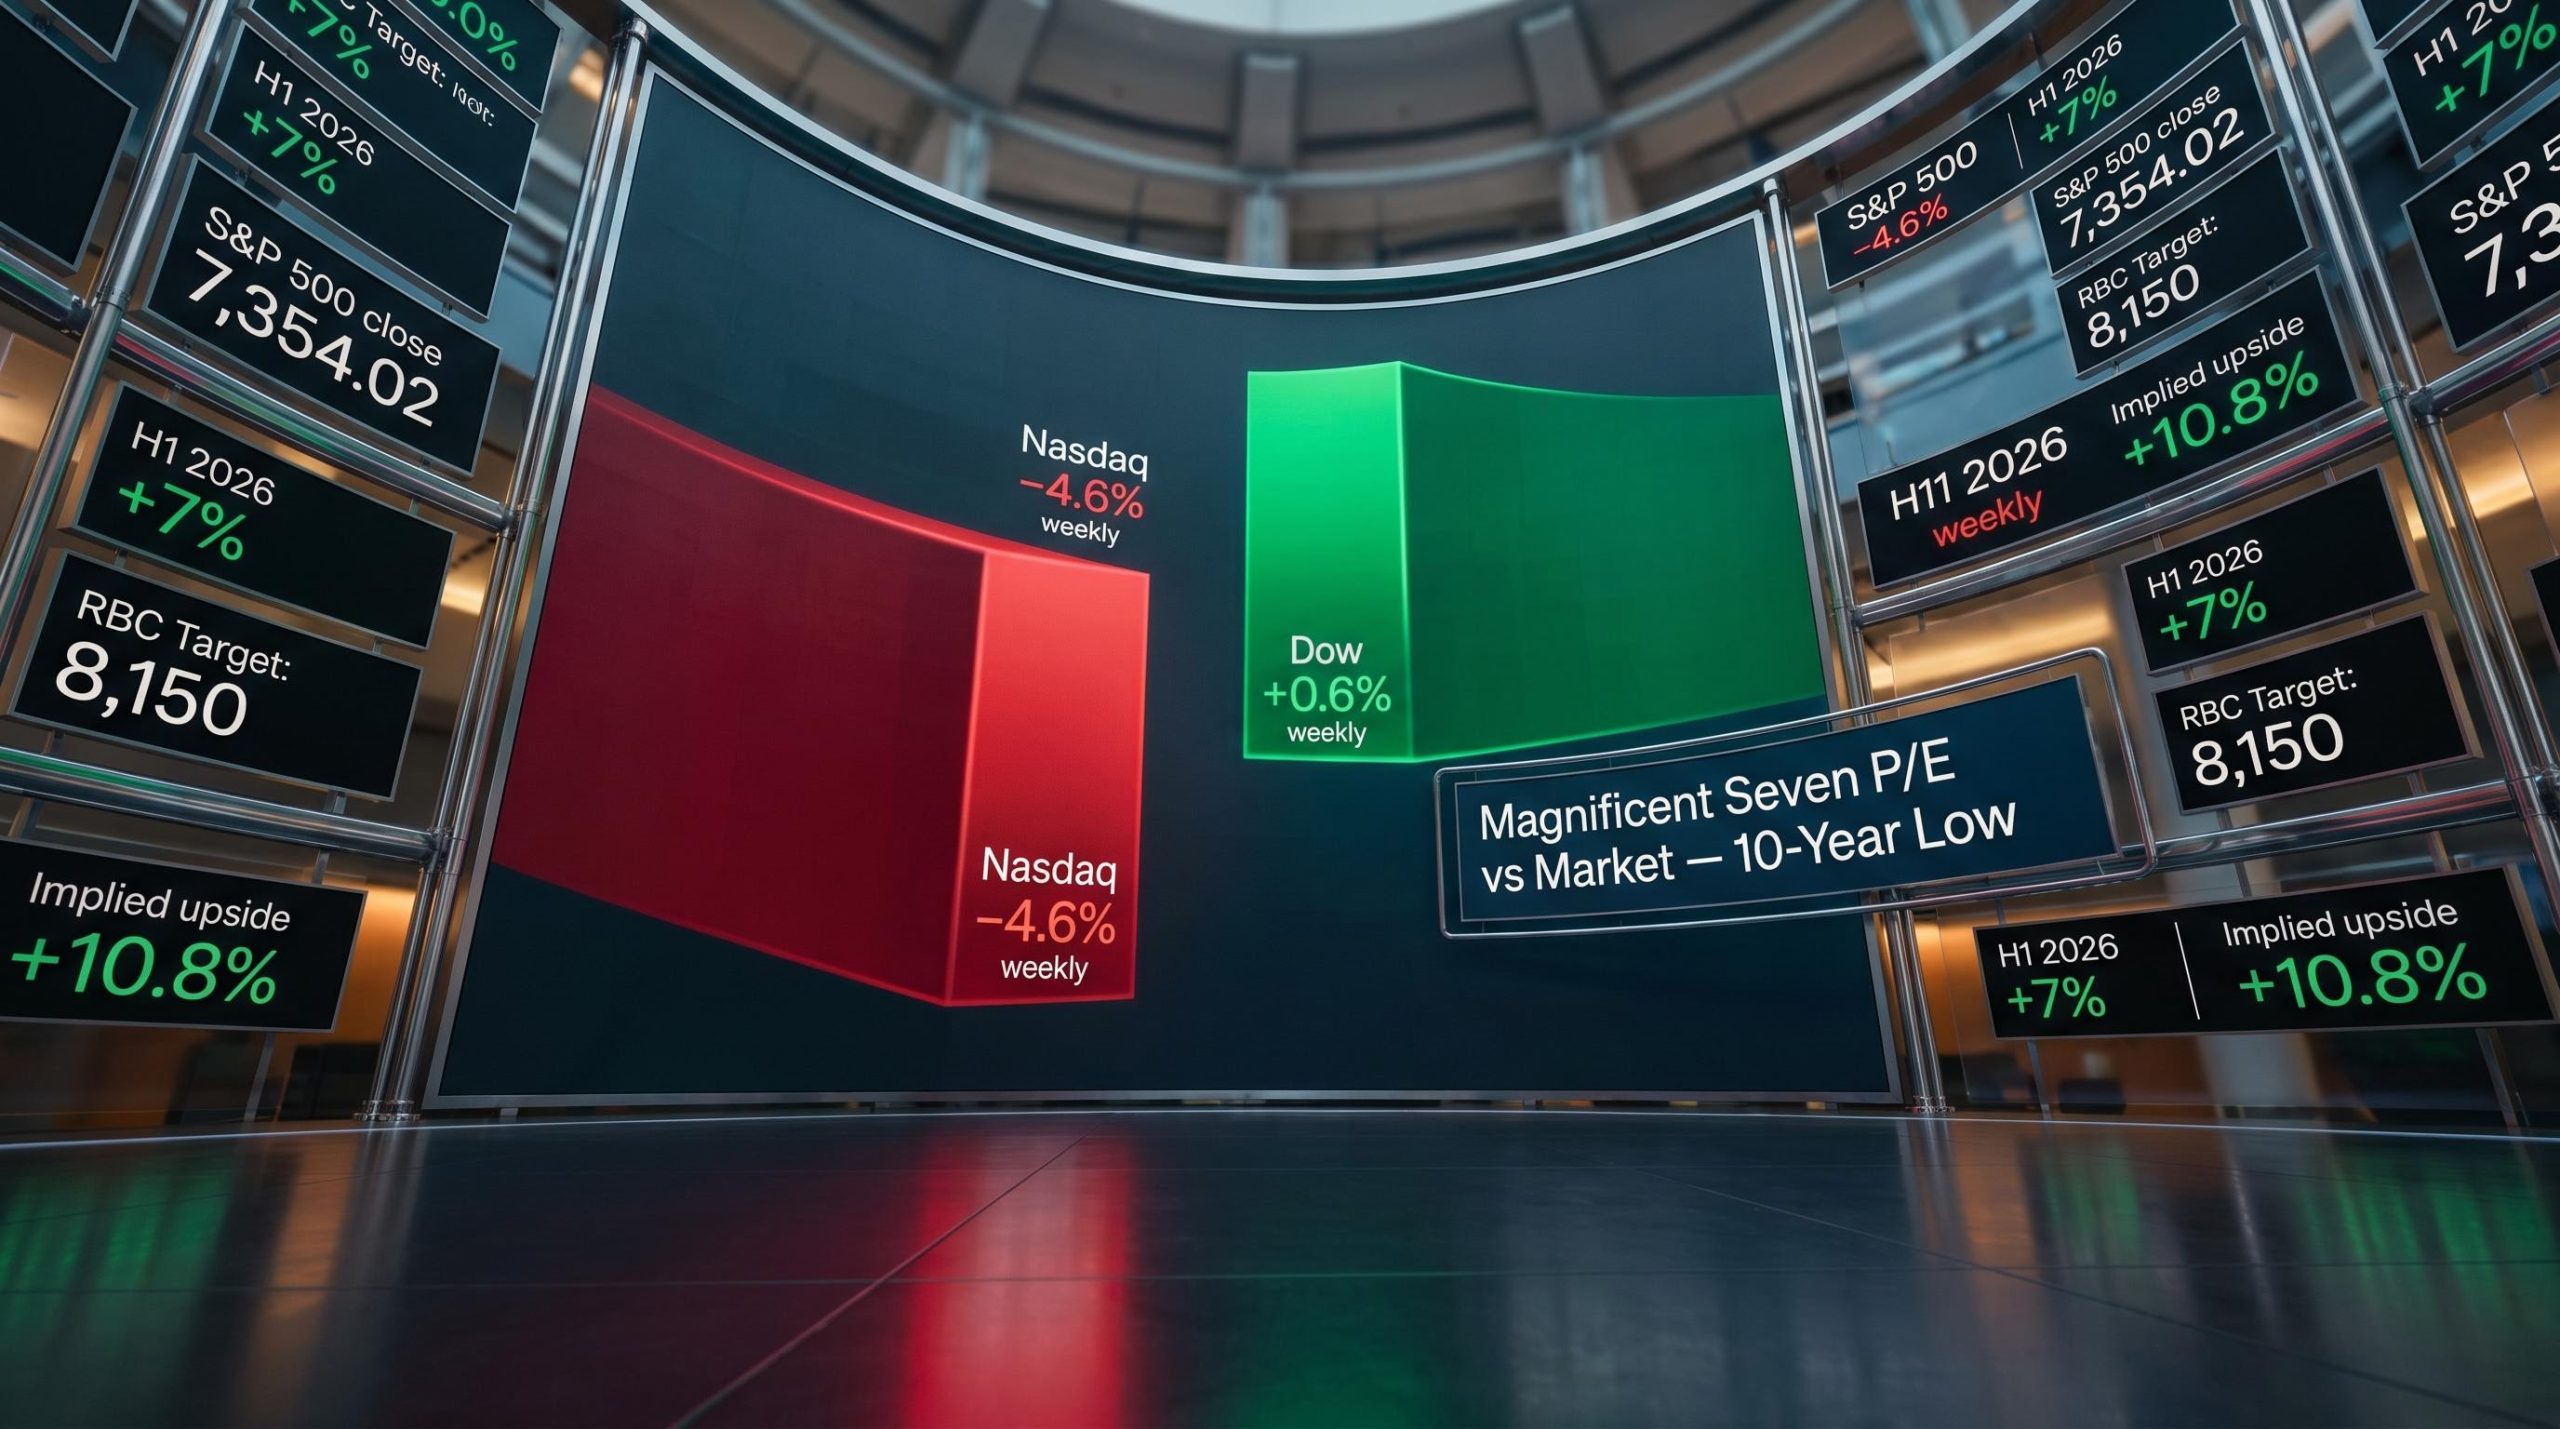
S&P 500 earnings growth ran at approximately 13% year-on-year during this period, outpacing ASX 200 earnings growth. As a longer-horizon reference, by 2026 the S&P 500 had gained over 33% in the prior year compared to the ASX 200’s 10%+ gain over the same window. The divergence was driven by fundamentals, not sentiment.
Three structural factors explain the gap:
For investors holding only domestic equities, the 2023-2024 recovery delivered ASX 200 total returns of 12.16% and 11.49% respectively. Those returns were meaningful in isolation. Measured against the returns available through international exposure, they represented a significant opportunity cost.
This cycle illustrates the practical price of home-country bias in a period when a major global thematic driver was concentrated outside the ASX. Geographic diversification is often discussed as a risk management tool. In the 2022-2024 cycle, it was equally a return generation tool.
The market data tells one story. Investor behaviour tells another.
ASIC’s 2022 research report (REP 735) found that retail investor activity during periods of volatility skewed toward short-term gain-seeking rather than long-term positioning.
ASIC REP 735 retail investor research, published in August 2022, documented how retail participation shifted during volatile market conditions, finding that short-term gain-seeking dominated over strategic positioning at precisely the point in the cycle where long-term decision-making was most consequential.
According to ASIC REP 735 (2022), retail investors increasingly engaged in trading activity during market volatility, with motivations skewed toward short-term gain-seeking rather than strategic long-term positioning.
This pattern is consistent with the broader behavioural dynamics that bear market cycles reliably produce. Loss aversion, recency bias, and herd behaviour combine to push investors toward decisions that lock in losses near the trough rather than maintaining positions through the transition.
The ASX 2023 Australian Investor Study, drawing on a survey of over 5,500 adults, showed a rise in active investing behaviour during the post-downturn period. Confidence improved as the recovery became visible. But a meaningful cohort missed the early stages of the rebound due to persistent caution that lingered past the cycle’s transition point.
This is characteristic of what bear market cycle analysis identifies as the anticipation phase dynamic. The typical behavioural sequence moves through identifiable stages:
The early recovery phase is typically recognised only in retrospect. The gains in the first leg of a rebound disproportionately accrue to the minority who did not exit during the downturn. Dollar-cost averaging and pre-established investment plans remain the behavioural countermeasures most consistently associated with avoiding this pattern.
The sentiment patterns described in this cycle, panic followed by persistent caution followed by late recognition, also carry a contrarian signal: historical data from prior sentiment troughs, including the 2022 University of Michigan low, shows that record consumer pessimism has tended to coincide with market bottoms rather than the beginning of sustained declines.
The 2022-2024 cycle is not a closed chapter. It is an active reference point.
In March 2026, the ASX 200 entered correction territory with a decline of more than 10%, recording its worst weekly sell-off since April 2025, down 3.8% for the week ending 6 March 2026. The sell-off was driven by geopolitical concerns and mining sector weakness. Using the definitional framework from the earlier section, this qualifies as a correction, not a confirmed bear market.
Current ASX market breadth data provides a useful calibration against the 2022 cycle: in the week ending 1 May 2026, 22 index constituents hit fresh 52-week lows while the headline ASX 200 fell just 0.65%, a divergence between surface-level index performance and underlying stress that closely mirrors the pattern visible in the early stages of the 2022 drawdown.
The April 2025 “Liberation Day” tariff sell-off provides a recent precedent. According to a Betashares report, that decline reached approximately 15.8% peak-to-trough (noting that this figure is Betashares-sourced and has not been independently corroborated through separate data sources). It recovered fully within weeks.
More than half of all 10% corrections deepen further, though this outcome is less likely outside recessionary environments, according to Betashares analysis. The distinction between a correction that deepens and one that recovers is often visible only after the fact.
Buyback activity during sell-offs has also been flagged as a signal of management confidence that dislocations may be temporary rather than structural, a pattern observable in the current environment.
The repeatable strategic behaviours that held up across the 2022-2024 cycle apply directly to current conditions:
The full arc of the 2022-2024 cycle, from inflation-driven downturn through rate-sensitive sector rotation to AI-fuelled recovery, follows a structural logic that repeats across cycles. The specific triggers change. The sequence of drawdown, transition, sector rotation, and behavioural response does not.
The ASX 200’s total returns of 12.16% in 2023 and 11.49% in 2024 were the concrete outcome of staying invested through the recovery. The sector rotation that moved leadership from materials and energy in 2022 to technology and financials in 2023-2024 is a pattern that appears in different forms at every cycle transition.
The investors who captured the most from this cycle were not those who predicted it correctly. They were those who stayed invested, diversified across geographies, and recognised that the transition out of a bear market is rarely obvious while it is happening.
The structural case for staying invested through drawdown phases rests on the mathematics of long-term wealth accumulation: diversified equities have delivered approximately 7% real annual returns since 1802, and the second decade of a compounding position generates nearly double the dollar gains of the first, making uninterrupted time in the market the single most consequential variable in the equation.
The current 2026 correction environment is an opportunity to apply that same cycle literacy in real time. The tools to do so, definitional precision, sector rotation awareness, behavioural discipline, geographic diversification, are the same ones this cycle demonstrated. Cycle literacy is not prediction. It is the ability to read what is arriving as it arrives, and that is the more achievable and more durable skill.
This article is for informational purposes only and should not be considered financial advice. Investors should conduct their own research and consult with financial professionals before making investment decisions. Past performance does not guarantee future results.
An ASX market cycle refers to the full sequence of market phases including drawdown, stabilisation, early recovery, and sustained rebound. The 2022-2024 cycle compressed this full sequence into roughly two years, making it one of the clearest recent examples for Australian investors.
A correction is defined as a decline of 10% or more from a recent peak and is typically shorter-lived, while a bear market requires a decline of 20% or more sustained over time. The ASX 200 entered bear market territory from its January/February 2022 peak to its October 2022 trough, whereas the March 2026 decline of more than 10% qualified only as a correction.
Information Technology returned +52% and Financials returned +34% on the ASX in 2024, leading the recovery as falling rate expectations unwound the discount rate compression that had driven their losses in 2022. Energy and Materials, which had provided shelter during the downturn, fell -21% and -13% respectively in 2024.
The gap reflected structural differences in index composition: the S&P 500 held heavy weighting in large-cap technology companies that directly benefited from the AI investment theme, while the ASX 200 was weighted toward financials and materials with limited exposure to that growth driver. S&P 500 earnings grew at approximately 13% year-on-year, underpinning the performance difference with reported fundamentals rather than sentiment alone.
The repeatable behaviours that held up across the 2022-2024 cycle include maintaining a pre-established investment plan, avoiding emotional exits near troughs, recognising sector rotation signals at phase transitions, and using geographic diversification to capture thematic drivers not well-represented in the ASX. These same tools apply directly to the current correction environment.