The ARK Innovation ETF delivered a time-weighted return of approximately 233% from inception through the end of 2025, slightly exceeding the S&P 500 over the same period. The typical investor in that fund experienced a money-weighted return of approximately negative 35%. Same fund, same period, opposite outcomes.
With more than $14 billion now sitting in ASX-listed technology-themed ETFs, and with software-focused funds declining as much as 25% in 2026 as sector leadership rotates toward resources and energy, Australian retail investors face a structural risk that rarely appears on a product fact sheet. This analysis examines the two interlocking forces that make thematic ETF investing significantly riskier than it appears: the sector concentration built into every thematic product by design, and the behavioural pattern that causes most investors to enter at precisely the wrong moment. What follows is an analytical framework for evaluating whether thematic exposure is serving a portfolio or quietly eroding it.
What the behaviour gap actually costs investors, in real numbers
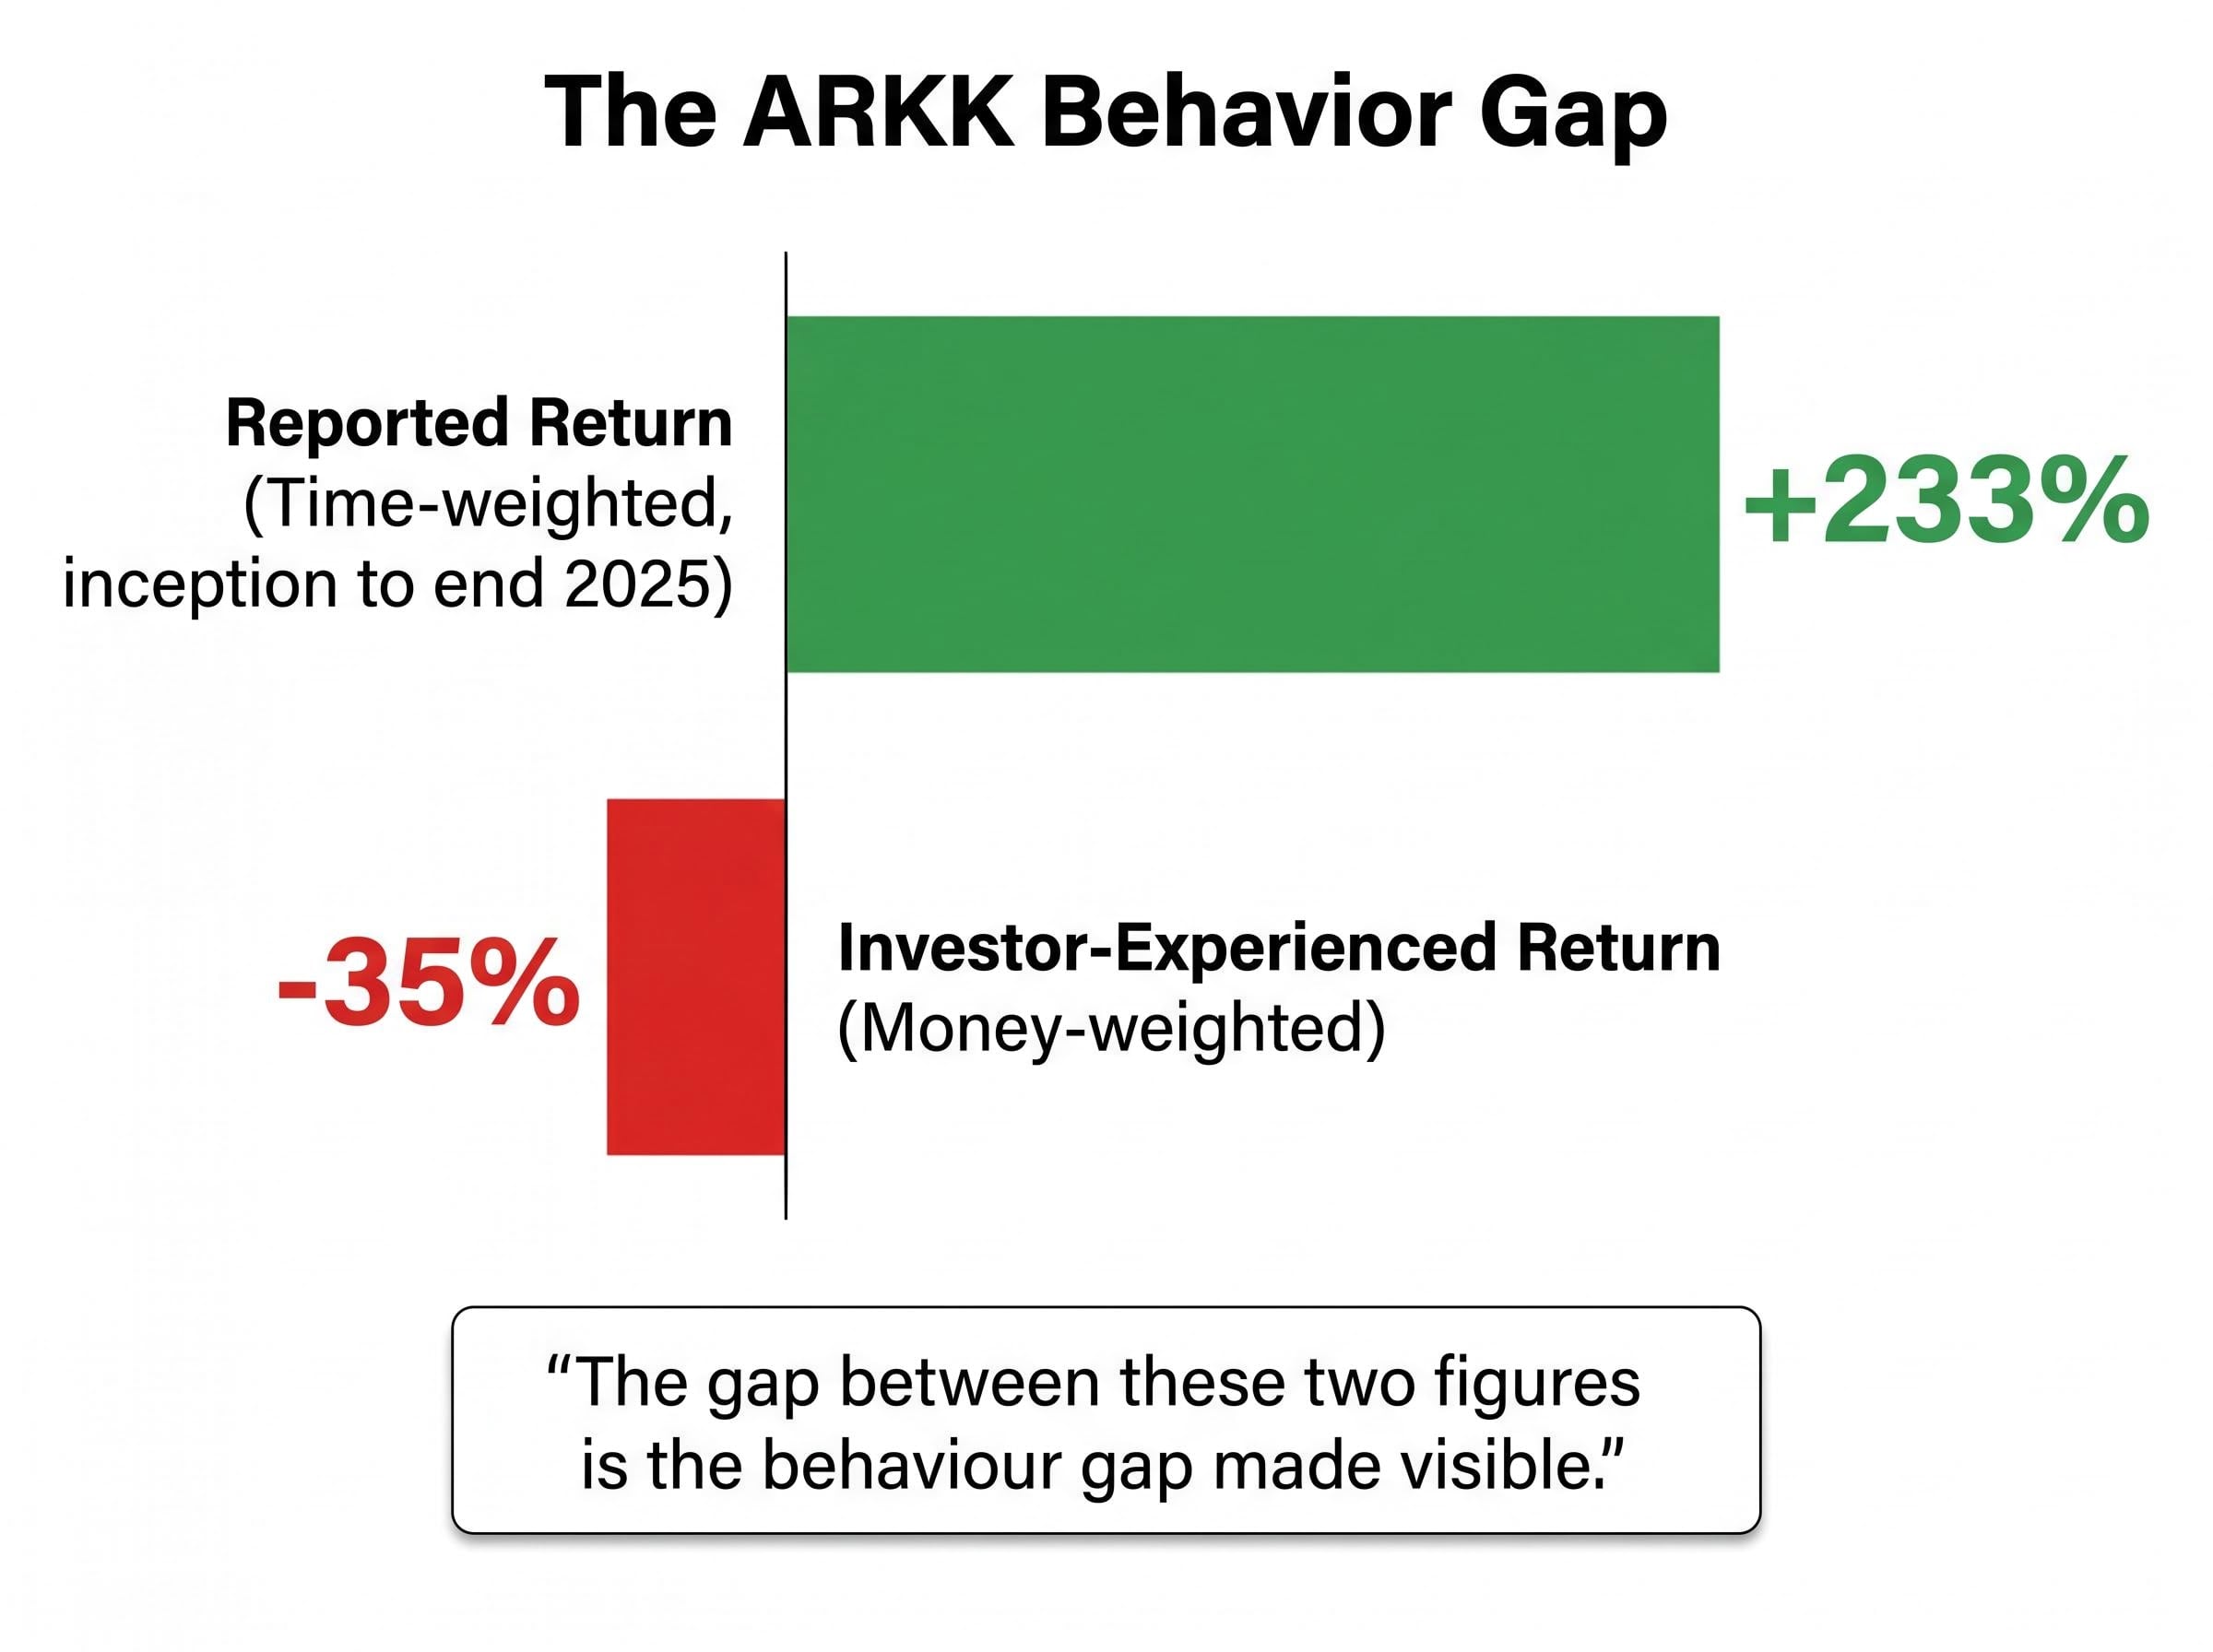
ARKK reported a time-weighted return of approximately 233% from inception through the end of 2025. On paper, that figure slightly exceeded the S&P 500 over the same period. A fund that outperformed the world’s most widely tracked equity benchmark across a full market cycle sounds like a success.
It was not.
The money-weighted return, which accounts for the timing and size of actual investor cash flows, tells a different story. The typical investor in ARKK experienced a return of approximately negative 35%. The mechanism is straightforward: the surge in retail inflows occurred after the fund’s strongest performance period in late 2020, meaning most investor dollars entered near peak valuations and rode the subsequent decline.
The reported return was +233%. The investor-experienced return was -35%. The gap between these two figures is the behaviour gap made visible.
| Metric | Figure | What It Represents |
|---|---|---|
| Time-weighted return (inception to end of 2025) | +233% | The fund’s reported performance assuming a single lump-sum investment at inception |
| Money-weighted return (investor-experienced) | -35% | The return the typical investor actually received, accounting for the timing of inflows |
| Total return since 31 December 2021 | -21% | Cumulative performance from annual returns of -67%, +67.64%, +8.40%, +35.49%, and -1.40% YTD 2026 |
A 2024 Morningstar study found the ARK fund family destroyed approximately $13.4 billion in shareholder value over ten years. Morningstar’s 2025 “Mind the Gap” report quantified the broader pattern: thematic funds carry approximately 2-3% annualised underperformance attributable to poor investor timing alone. That figure applies across the category, not just to ARKK.
Reactive trading costs compound the behaviour gap in ways that are difficult to recover from: a single poorly timed exit from a thematic position can trigger CGT on a nominal gain while locking in a real loss against the benchmark, with global behavioural finance research estimating approximately 1.5% per annum in return drag attributable to emotional decision-making alone.
When big ASX news breaks, our subscribers know first
Thematic ETFs are concentration bets dressed up as diversification
A thematic ETF may hold 30, 50, or even 80 individual securities. It remains, by construction, a narrow sector wager. Every holding is selected because it fits a single investment narrative, whether artificial intelligence, cybersecurity, or clean energy. The number of names inside the fund does not change the fact that they all move on the same underlying forces.
The exclusion problem is where this structure becomes visible. A portfolio concentrated in technology-themed ETFs carries minimal or zero exposure to four of the market’s largest sector categories:
- Financial institutions (banks, insurers, diversified financials)
- Energy producers (oil, gas, coal)
- Commodity companies (mining, metals, agriculture)
- Consumer businesses (retail, staples, discretionary)
These omissions are not accidental. They are the product’s design.
The S&P/ASX 200 already carries elevated concentration risk, with its top 10 constituents weighted at approximately 48.7% as of May 2026, according to S&P Global index data. VanEck analysis shows that at or above the 48.6% historical concentration average, an equal-weight strategy achieved a 100% outperformance hit rate over five years, with average outperformance of +15.5%. Layering thematic ETFs on top of a cap-weighted ASX core compounds rather than diversifies that existing concentration.
Index fund concentration risk operates on the same structural logic: a portfolio that appears diversified by security count can still behave like a single-sector bet when its top holdings share the same underlying return drivers, and the US market’s five mega-cap stocks controlling approximately 23% of the broad index offers a precise parallel to the thematic ETF problem playing out on the ASX.
Acadian Asset Management defines extreme concentration as fewer than 25 stocks or a top-10 weight exceeding 50%, calling it a “recipe for disaster.”
Why owning the most exciting sectors does not guarantee returns
The assumption behind most thematic ETF purchases is intuitive: identify the sector that will grow fastest, buy it early, and hold on. The problem is that prices already reflect this intuition. When a sector is widely favoured and heavily held, the market’s expectations for that sector’s earnings, revenue growth, and margin expansion are already embedded in current valuations. Actual results must surpass those already elevated expectations to generate positive returns.
The reverse dynamic is equally important. Out-of-favour sectors, the ones retail investors avoid, can produce strong returns on only modest positive surprises because the bar embedded in their prices is so low. This is not a paradox; it is how markets price risk and reward.
The 2026 rotation Australian thematic investors missed
The 2026 Australian market provided a direct illustration. Software and high-growth technology businesses had been among the strongest performers from 2020 onward, drawing large inflows into tech-themed ETFs. By 2026, those same companies faced pressure as investor sentiment shifted and growth forecasts were revised downward. Certain popular technology-themed ETFs declined by as much as 25%.
Resources and energy companies, meanwhile, delivered notable gains, with oil and gas producers benefiting from elevated commodity prices and geopolitical tensions. Investors concentrated in tech-themed ETFs not only absorbed drawdowns but simultaneously missed the sector generating the period’s strongest returns. The rotation was not a surprise to anyone watching sector valuations; it was a surprise only to those who confused excitement with mispricing.
The structural mechanics behind thematic underperformance
ARKK is a vivid case, but treating it as an outlier would miss the point. Only approximately 20% of thematic ETFs outperform their benchmarks over five years, according to a 2025 Kalkine report. The remaining 80% lag.
Approximately 20% of thematic ETFs outperform their benchmarks over five years. The structural odds favour diversified alternatives.
Vanguard Australia identifies the mechanism behind this base rate: by the time a theme attracts sufficient retail interest to launch a dedicated ETF or grow one significantly, the underlying trend is often mature or already reversing. The theme life-cycle follows a repeating pattern:
NBER research on specialized ETF underperformance finds that over their first five years, specialized funds lose approximately 30% in risk-adjusted terms, with the primary driver being the overvaluation of underlying stocks at the time of launch, a finding that gives the Vanguard theme life-cycle model rigorous academic grounding.
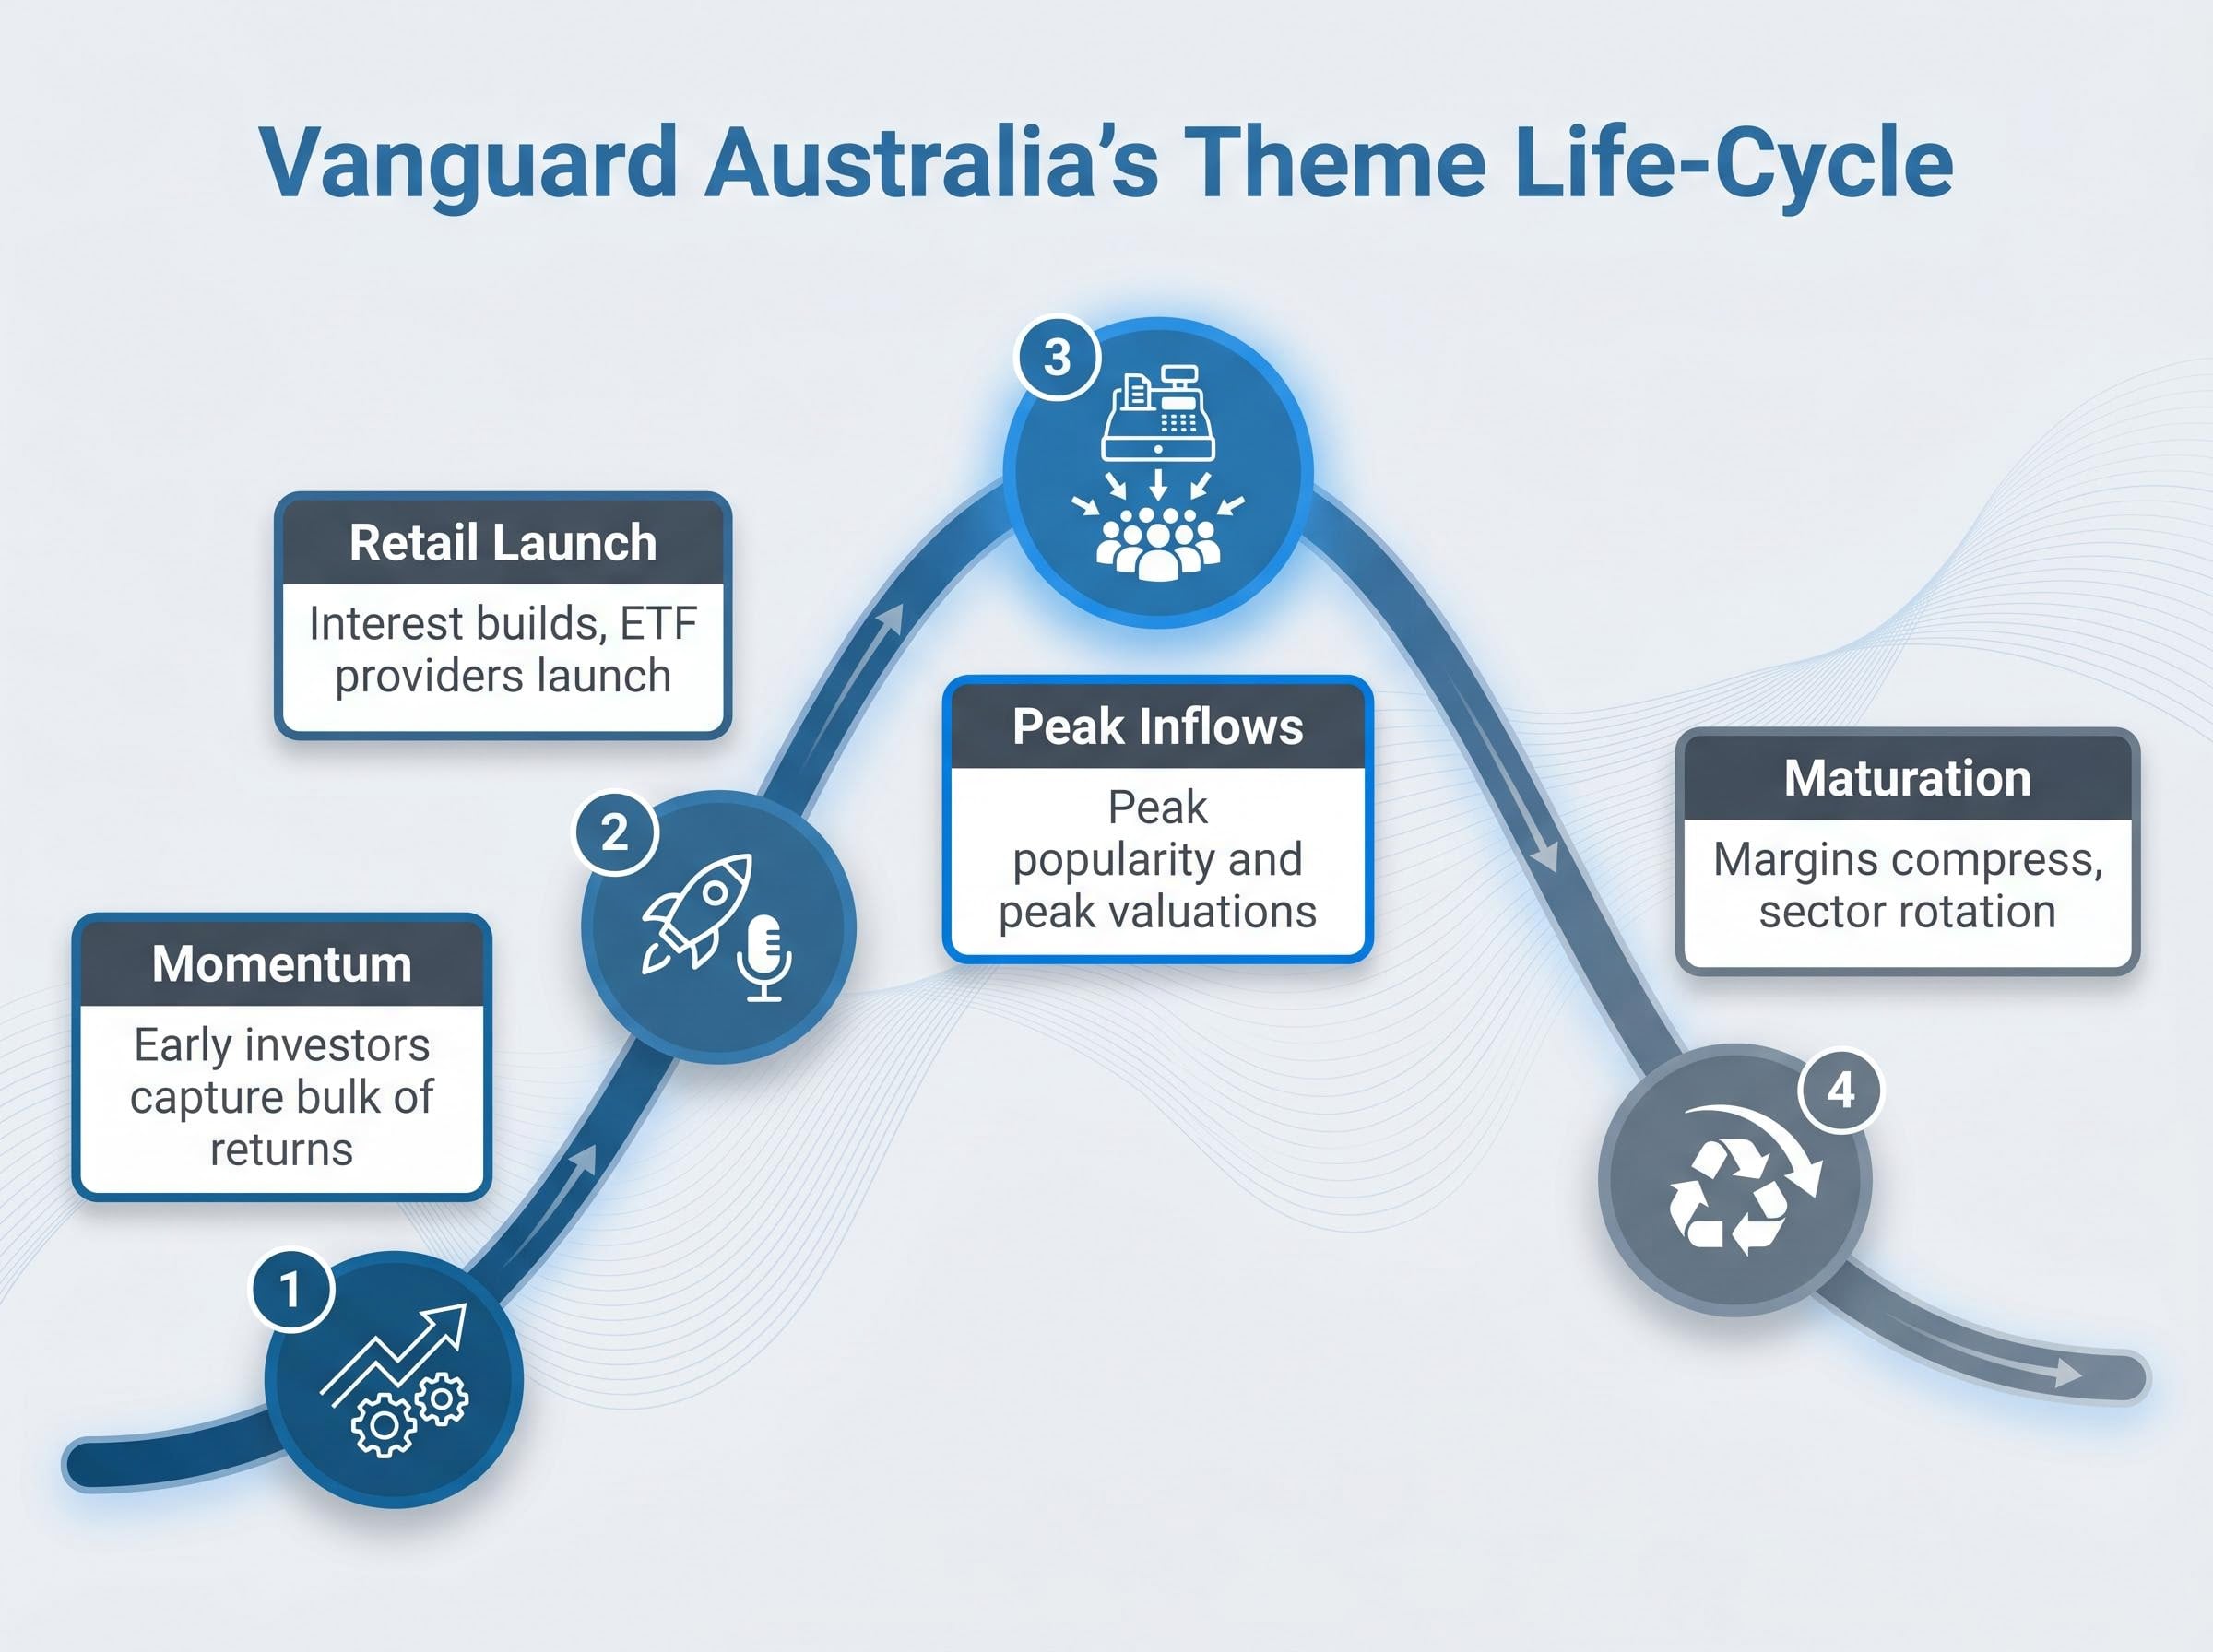
- A sector or technology gains genuine momentum, and early investors capture the bulk of returns
- Retail interest builds, ETF providers launch or expand thematic products, and marketing accelerates
- Inflows peak as the theme reaches maximum popularity, often coinciding with peak valuations
- The theme matures, competition compresses margins, or sector rotation shifts capital elsewhere
Morningstar Australia described ARKK in December 2021 as “an object lesson in how not to invest,” citing extreme concentration and momentum risks. That assessment applied not only to one fund but to the structural incentives embedded in the thematic ETF category itself. No thematic product includes a mechanism for adapting when sector leadership rotates. The $14 billion sitting in Australian tech-themed ETFs carries the same structural vulnerability.
Australian ETF capital flows in 2026 have accelerated markedly, with the market projected to reach $380 billion as retail investors rotate away from defensive domestic positions toward global growth strategies, a pattern that increases the systemic stakes when the themes attracting the largest inflows subsequently underperform.
What broad market exposure offers that thematic products cannot
Broad market ETFs operate on an inclusion-based model. A fund tracking the S&P/ASX 200 or S&P/ASX 300 captures financial institutions, energy producers, commodity firms, and consumer businesses alongside technology automatically. No sector is excluded by design.
The structural comparison across four dimensions makes the distinction concrete:
- Sector coverage: Broad market ETFs hold all major sectors; thematic ETFs exclude most of them by construction
- Rotation response: Broad market indices rebalance as sector weightings shift; thematic ETFs remain locked into a single narrative regardless of market conditions
- Timing sensitivity: Broad market exposure is less dependent on entry timing; thematic ETFs amplify the cost of buying at peak popularity
- Five-year outperformance probability: Broad market benchmarks outperform approximately 80% of thematic ETFs over five years
Equal-weight structures as a further de-concentration tool
For investors concerned about cap-weight concentration in the ASX, equal-weight structures offer an additional layer of de-concentration. VanEck data shows that within the current concentration environment (top-10 weight at approximately 48.7%), equal-weight strategies have historically outperformed cap-weight approaches. At or above the 48.6% long-run average, the five-year outperformance hit rate is 100%, with average outperformance of +15.5%. Within the narrower 48-50% concentration band specifically, the win rate is 86% with average five-year outperformance of +4.0%.
Stockspot has referenced a core ETF portfolio approach as an Australian retail-accessible example of this diversification philosophy, prioritising broad market exposure over thematic or sector-concentrated products.
For investors already holding thematic ETFs, how to recalibrate
Selling every thematic position immediately is not the only rational response to these structural risks. A proportionate recalibration framework involves three steps:
- Audit current thematic concentration as a percentage of total portfolio. If thematic ETFs represent more than a satellite allocation (typically 5-10% of a diversified portfolio), the concentration risk documented above is compounding.
- Establish a broad market core if one does not exist. A diversified ETF tracking the S&P/ASX 200 or S&P/ASX 300 provides the sector breadth and automatic rebalancing that thematic products structurally lack.
- Apply dollar-cost averaging for any new thematic additions over a minimum twelve-month window. Chris Brycki of Stockspot has suggested accumulation periods of one to two years for thematic ETF positions, specifically targeting the timing risk that Morningstar’s 2025 data quantifies at 2-3% annualised underperformance.
Dollar-cost averaging addresses the timing problem directly. It does not, however, alter the 80% structural underperformance base rate of the thematic ETF category. Position sizing should reflect that distinction: thematic exposure may serve as a satellite holding within a core-satellite structure, but the core must be anchored in broad diversified exposure for the framework to function.
For investors ready to act on the core-satellite framework and wanting a concrete starting point for the broad market allocation, our dedicated guide to ASX ETFs for the current environment assesses six ASX-listed funds across income, diversification, and liquidity categories, with specific attention to how each handles the sector rotation dynamics that have penalised concentrated technology positions in 2026.
The structural argument for patience over prediction
The two forces documented in this analysis, concentration risk and the behaviour gap, are not investor errors that skill or discipline can overcome. They are structural features of the thematic ETF category itself. A product that excludes most of the market by design and attracts the most capital at peak valuations carries risks that compound rather than diminish over time.
The ARKK figures anchor the argument: +233% reported, -35% experienced, $13.4 billion in shareholder value destroyed across the ARK fund family over a decade. These are not anomalies. They are the predictable outcome of a structure that rewards narratives over diversification.
Thematic ETFs are not fraudulent products. They carry risks that are systematically obscured by how fund performance is reported, and Australian investors deserve clarity on the gap between what appears on a fact sheet and what most participants actually experience. For the $14 billion currently allocated to ASX-listed technology-themed ETFs, that clarity is overdue.
ASIC Regulatory Guide RG 282 sets out disclosure obligations for exchange-traded product issuers, including requirements around naming conventions and product disclosure statements, yet the guide stops short of mandating that issuers prominently disclose the gap between time-weighted and money-weighted returns in thematic fund marketing materials.
This article is for informational purposes only and should not be considered financial advice. Investors should conduct their own research and consult with financial professionals before making investment decisions. Past performance does not guarantee future results.