Brent Hits $110 as Hormuz Closure Fuels 10% Inflation Risk
1 hr ago

WTI crude oil surged 4.20% to $105.42 per barrel on 18 May 2026, marking its sharpest single-session gain in months after reports of imminent US-Israeli military strikes against Iran moved across newswires. The spike pushed Brent above $109 per barrel and made energy the only US equity sector to finish in positive territory on a day when every major index fell sharply. The catalyst was not a supply disruption that had already occurred, but one that markets judged to be credibly close. What follows explains the trigger behind the surge in crude oil prices, why the Strait of Hormuz and Kharg Island sit at the centre of supply risk, what the International Energy Agency’s (IEA) October 2026 undersupply forecast means even under a best-case scenario, and why global bond markets are amplifying the economic stakes.
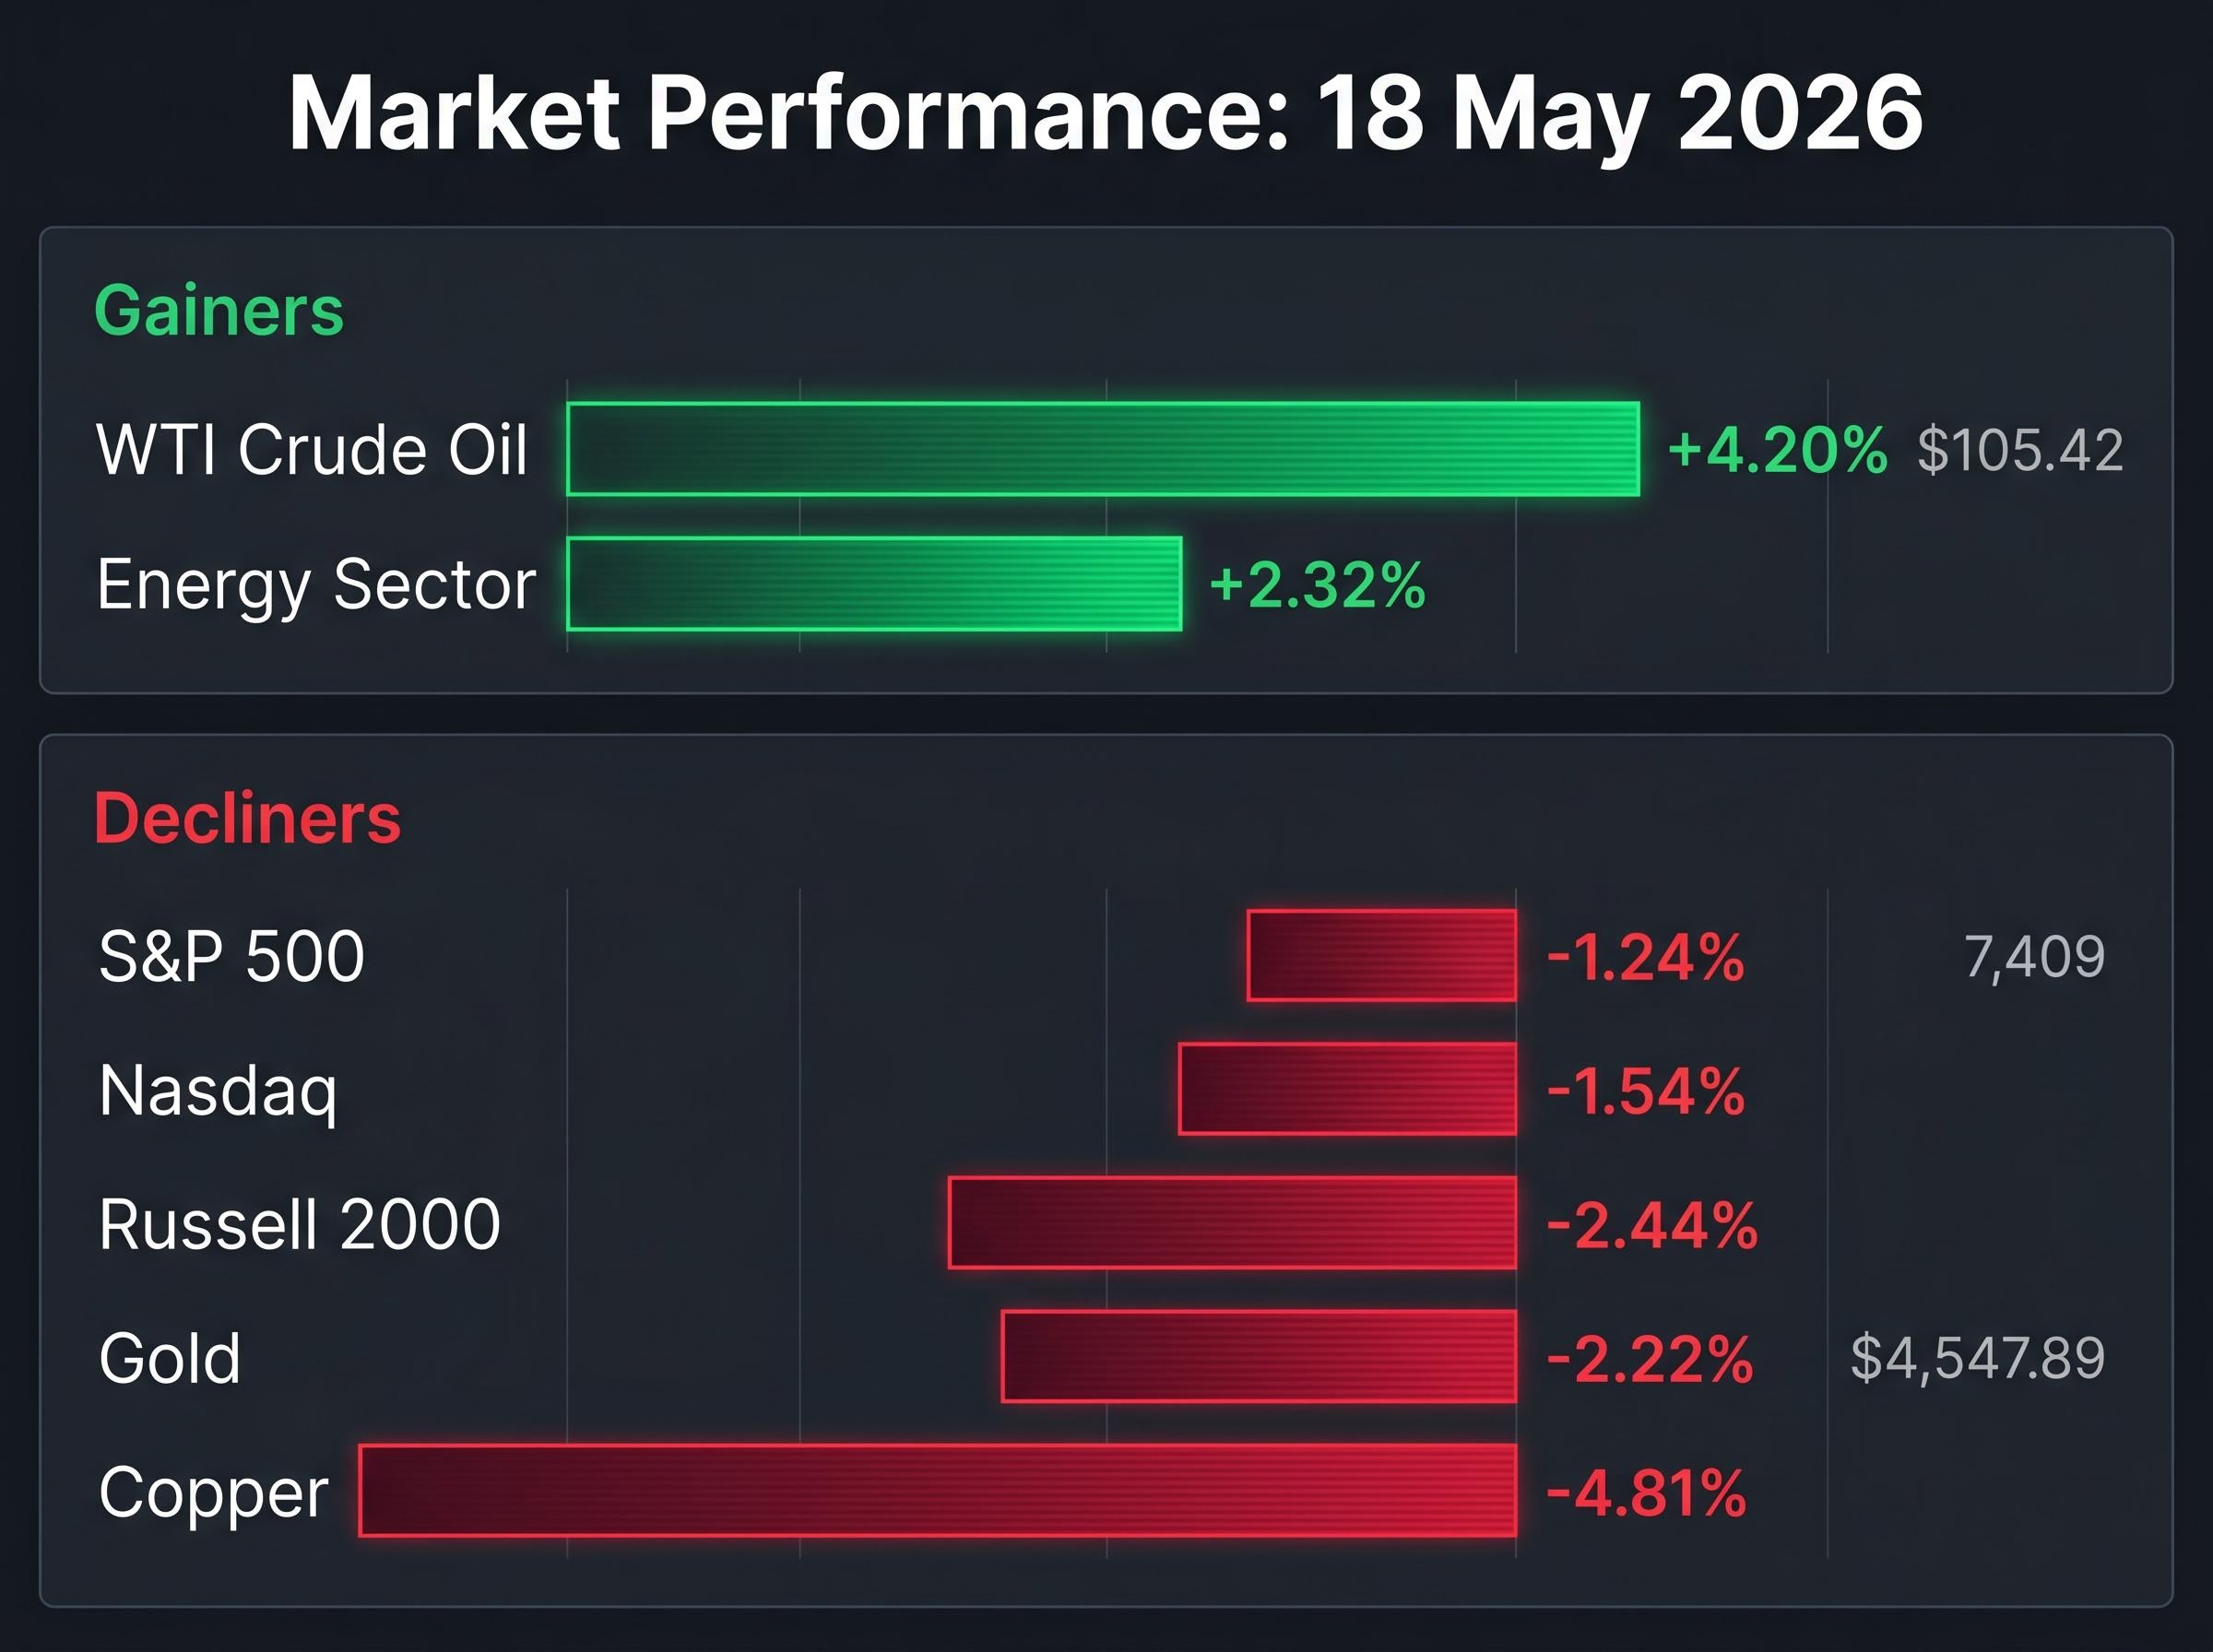
Session move: WTI crude rose 4.20% to $105.42/bbl on 18 May 2026, while Brent traded in the range of $109.49-$111.04/bbl.
The New York Times reported that the United States and Israel were in intensive planning for resumed coordinated strikes on Iran, citing two Middle Eastern officials who described the timeline as “as soon as this week.” The report gained traction because of the specificity of the options reportedly under consideration:
Corroborating signals gave the intelligence credibility before any official confirmation. President Trump had publicly opposed the Iran ceasefire in the days prior. On Saturday, an AI-generated image captioned “calm before the storm” appeared on his Truth Social account. Separately, an Iranian drone strike on the UAE’s sole nuclear power facility had already raised the threat level across the Gulf.
Energy was the only S&P 500 sector to gain on the session, rising 2.32%, while the S&P 500 fell 1.24% to 7,409. Markets were pricing reported intent, not confirmed action, a dynamic that makes the risk premium both powerful and inherently unstable.
Before the IEA’s supply figures carry their full weight, the physical geography of the risk needs to be clear. Two locations determine whether Iranian crude reaches global markets, and both are now directly in the line of reported military planning.
Kharg Island handles the overwhelming majority of Iran’s crude oil export volumes. It is a single loading terminal, not a network of distributed facilities. If captured or destroyed, Iranian supply to global markets would effectively fall to zero. There is no backup terminal of comparable capacity, meaning the loss would be immediate and total rather than gradual.
The Strait of Hormuz is the world’s most critical oil transit chokepoint. A significant share of globally traded crude and liquefied natural gas passes through it daily. There is no practical large-scale alternative route for Gulf producers in the near term; pipeline alternatives carry a fraction of the volume and require months to ramp.
The EIA World Oil Transit Chokepoints analysis identifies the Strait of Hormuz as the single most consequential passage in global energy logistics, with historical daily flows exceeding 18 million barrels and no large-scale alternative route available to Gulf producers on any near-term timeline.
Even a partial or threatened disruption at either location is sufficient to remove physical barrels from the market, because the threat itself triggers three immediate responses:
The physical disruption operating as a backdrop to the 18 May session is itself the product of a triple lock on Hormuz transit: US naval blockade operations, Iranian toll enforcement on non-US and non-Israeli vessels, and the near-total withdrawal of commercial war-risk insurance coverage, each of which independently prevents normal commercial shipping even when the others ease.
The IEA estimated that crude and fuel flows through the Strait had already fallen by approximately 4 million barrels per day. Year-over-year, crude prices have risen more than $40-$45 per barrel, a move consistent with a sustained geopolitical risk premium being embedded into forward curves.
The IEA projected that global oil markets would remain materially undersupplied through at least October 2026, even if the Iran conflict is resolved by June 2026. That timeline transforms this from a short-term spike into a medium-term structural pricing event.
The IEA Oil Market Report published on 13 May 2026 quantified output from Gulf countries affected by the Hormuz closure at 14.4 million barrels per day below pre-war levels, providing the supply-side baseline against which the October 2026 undersupply projection is constructed.
The IEA’s base case assumes a June 2026 conflict resolution and still projects undersupply through October 2026.
The arithmetic is direct. The 4 million barrel-per-day reduction in Hormuz flows represents a demand-supply gap that cannot be closed quickly by spare capacity, inventory draws, or demand destruction alone. Spare capacity among non-Gulf producers is limited. Strategic petroleum reserves can supplement supply temporarily but are not designed to offset a shortfall of this magnitude for months.
Emergency reserve limitations are more binding than policy statements suggest: SPR and IEA releases totalling approximately 280 million barrels have failed to halt inventory drawdowns running at 8.5 million barrels per day in Q2 2026, while Saudi Arabia’s output has collapsed to its lowest level since 1990, leaving OPEC spare capacity of roughly 0.5 million barrels per day as a negligible offset at the scale of the current shortfall.
Policy uncertainty amplifies the physical disruption further. When conflict risk is elevated, refiners run lower inventories, investors withdraw capital from energy projects, and companies slow drilling activity, according to analysis from Energy Intelligence. Each of these responses tightens supply beyond the direct barrel loss.
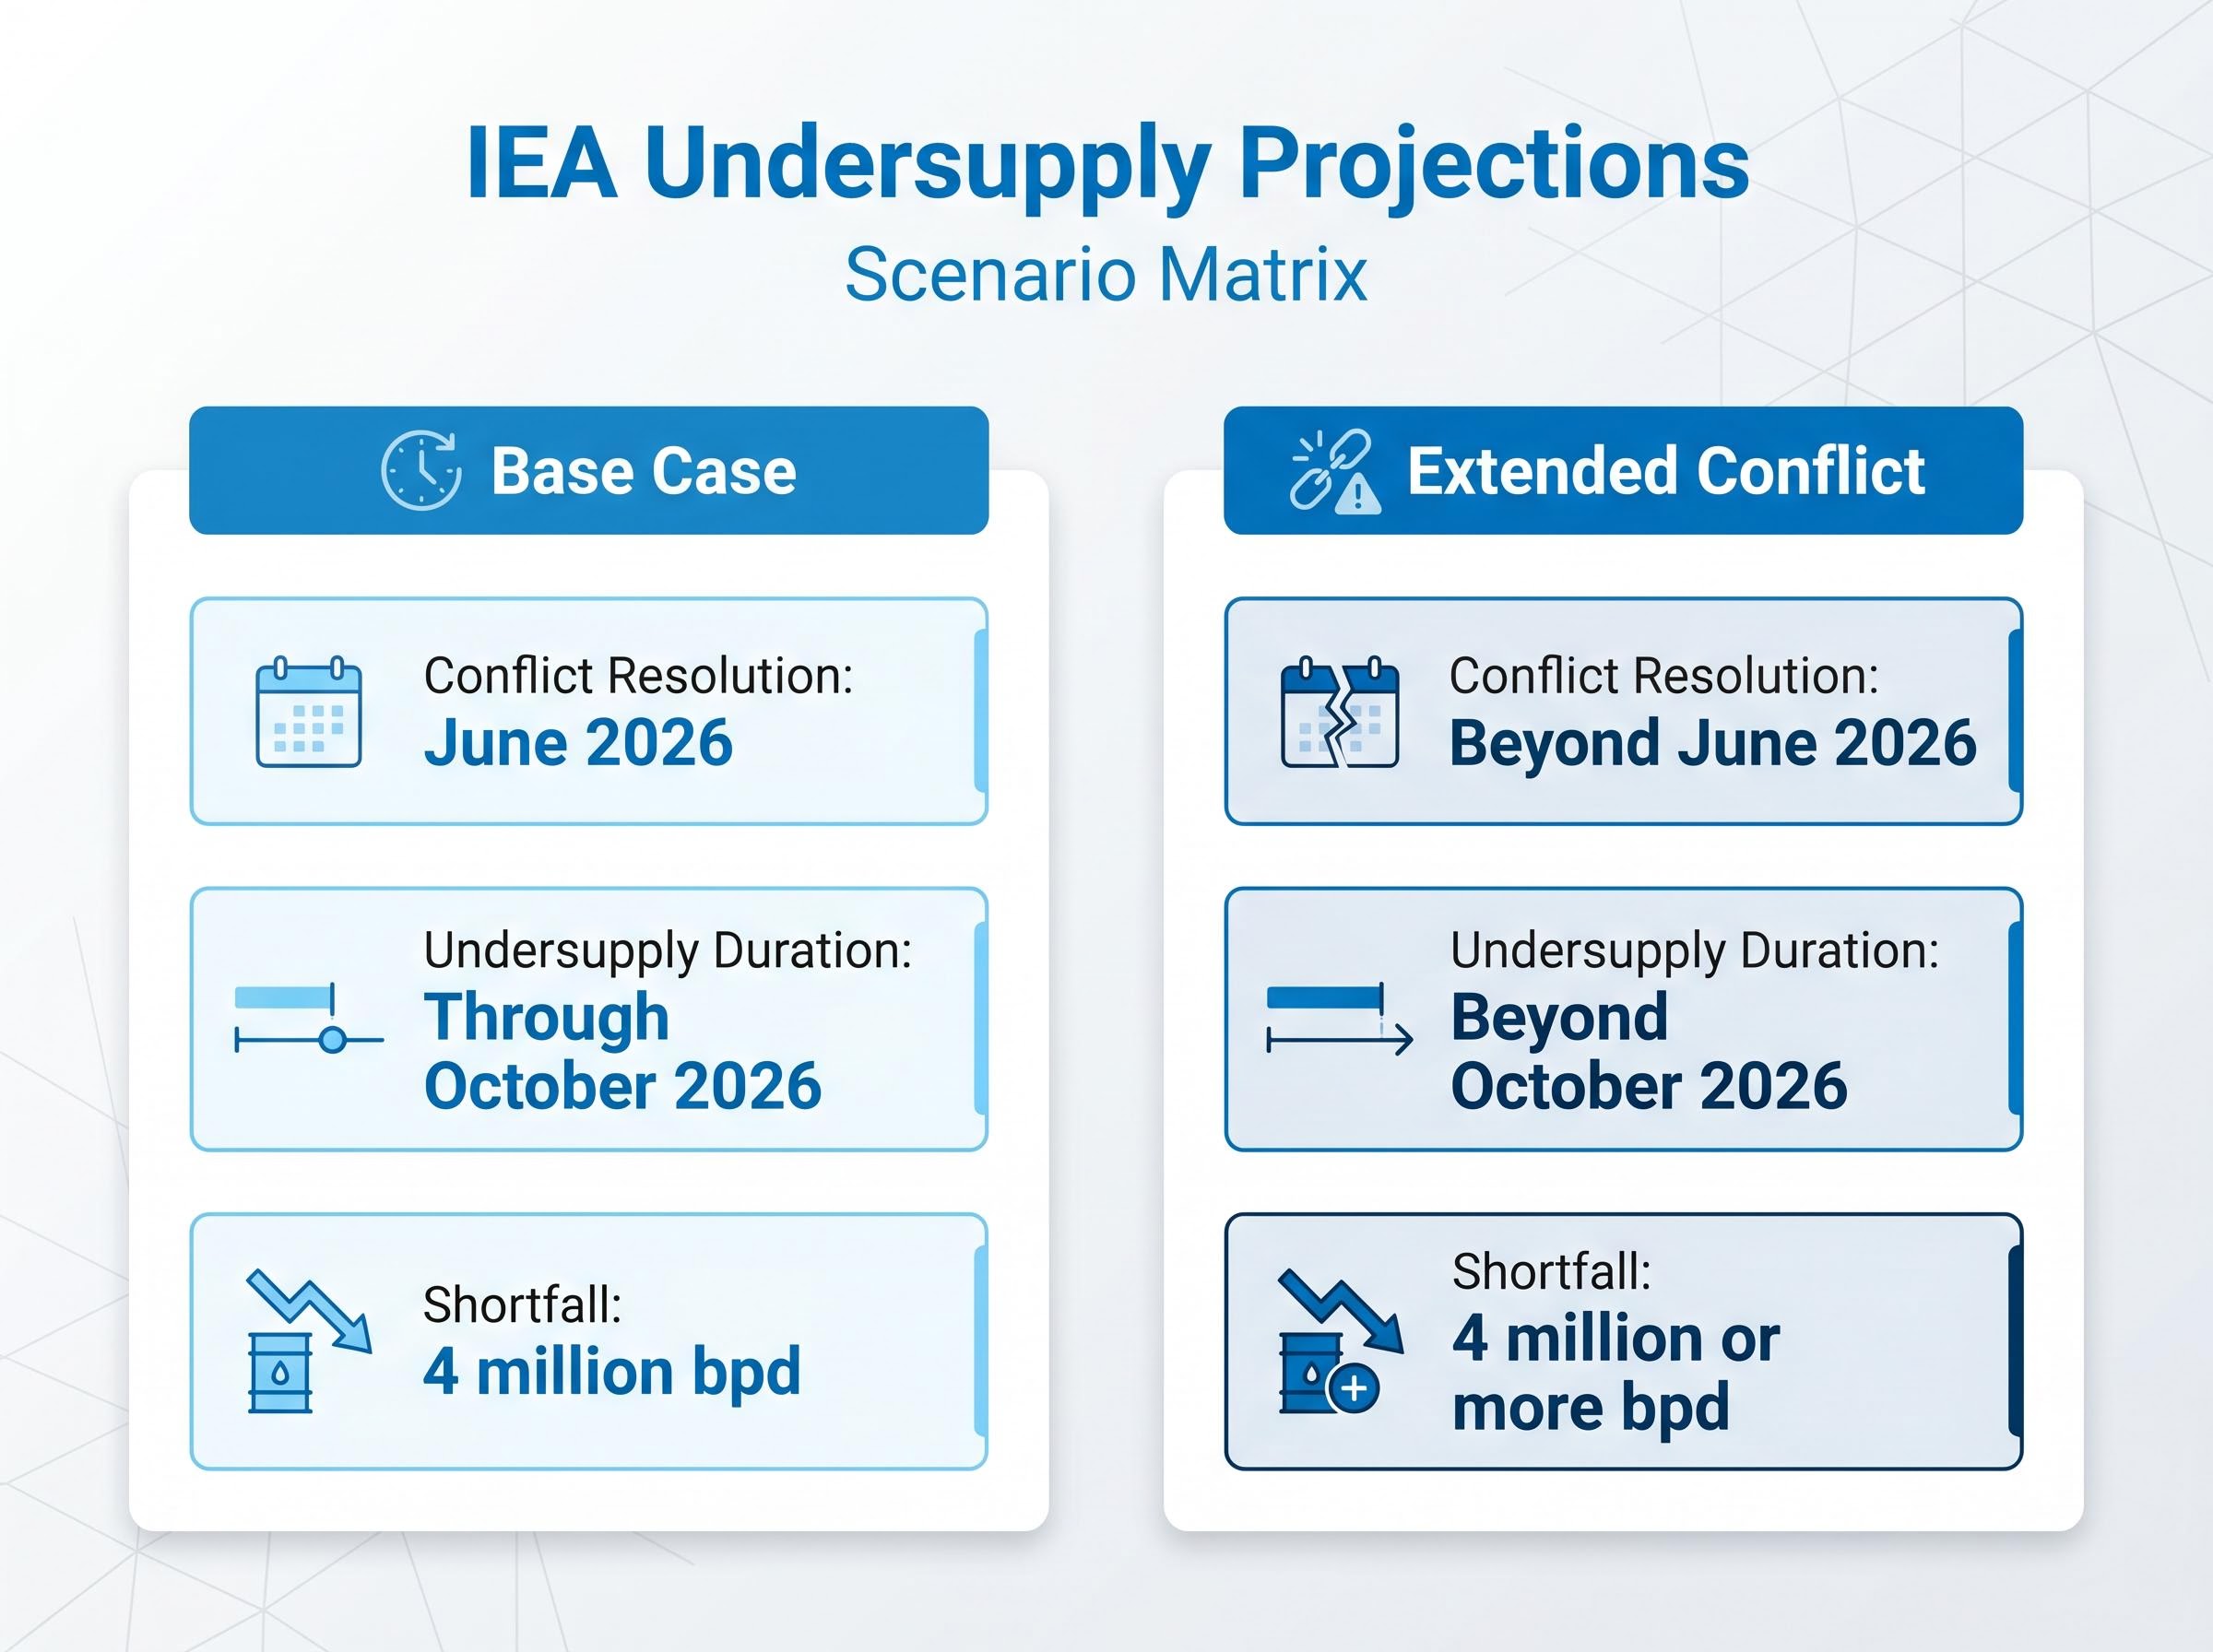
| Scenario | Conflict Resolution Assumed | IEA Undersupply Duration | Approximate Shortfall (bpd) |
|---|---|---|---|
| Base Case | June 2026 | Through October 2026 | 4 million |
| Extended Conflict | Beyond June 2026 | Beyond October 2026 | 4 million or more |
Any slippage beyond the June resolution timeline extends the undersupply window further, meaning the IEA’s projection represents the optimistic end of the range.
Energy rising 2.32% while every other S&P 500 sector fell is more than a headline. It is a diagnostic signal.
Session divergence: Energy sector +2.32%. S&P 500 -1.24%. Nasdaq -1.54%. Russell 2000 -2.44%. VIX rose 6.78% to 18.43.
The isolation reveals capital rotating into commodity-linked equities as an inflation and supply-shock hedge. Three logic chains explain the move:
Gold fell 2.22% to $4,547.89, while copper dropped 4.81%, indicating the selloff was equity and risk-asset broad rather than commodity-broad. Energy’s gain was specific to the oil supply thesis, not a generalised commodity bid.
The countervailing dynamic matters, however. Analysis from Energy Intelligence notes that sustained geopolitical uncertainty can eventually suppress capital formation in the energy sector by raising project risk premiums and deterring long-horizon investment. That creates a ceiling on equity upside even as spot prices rise, a tension investors in energy producers need to monitor.
For investors working out how to size energy exposure against broader portfolio risk, our deep-dive into oil shocks and equity market history examines every episode since 2008 when Brent crossed $100 per barrel, mapping S&P 500 returns over the following 12 months and reviewing what institutional desks at Morgan Stanley and JPMorgan recommend retail investors avoid doing during geopolitical volatility spikes.
The oil spike is not an isolated commodity event. It is a pressure wave moving through the global monetary system, arriving at central bank committees already uncomfortable with inflation data.
Oil feeds directly into consumer price indices through fuel costs and indirectly through transport, manufacturing input costs, and food production. The lag between a sustained crude price increase and its appearance in headline CPI figures is typically three to six months. At $105 WTI, the transmission is already underway, forcing central banks to choose between growth support and price stability.
Jet fuel supply disruptions represent one of the clearest downstream transmission channels from the Hormuz closure to consumer-facing sectors: tanker loadings for jet fuel collapsed 50% week on week in early May 2026, and ConocoPhillips warned that import-dependent nations could face critical shortfalls as early as June-July 2026, a timeline that sits within the IEA’s own undersupply window.
An ECB Governing Council member publicly warned that the ECB could be compelled to raise rates if oil prices remain elevated. The Bank of England’s chief economist separately called for timely, incremental rate increases. Both statements signal that easing cycles may be paused or reversed.
The bond market’s reaction on the session served as a secondary amplification mechanism. Sovereign yields moved sharply higher across three major economies.
| Market | Instrument | Level | Move |
|---|---|---|---|
| United States | 10-year Treasury | 4.595% | Up 11 basis points (highest since May 2025) |
| Japan | 30-year JGB | 4.00% | Record high |
| United Kingdom | 30-year gilt | 28-year high | Multi-decade peak |
CME FedWatch data showed a 40% probability of a 25 basis point Fed hike by year-end 2026. Kalshi prediction markets were fully pricing one Fed hike by March 2027, with more than 50% probability before the end of 2026. Higher long-term yields tighten financial conditions independently of any official rate decision, compressing the space for central banks that had been hoping to ease.
The single-session drama of 18 May needs calibration. Crude prices have risen more than $40-$45 per barrel over the past twelve months, meaning the current $105.42 WTI level is the result of a sustained repricing, not a one-day anomaly sitting above a much lower base.
Year-over-year context: Crude prices are up more than $40-$45/bbl from twelve months ago, with Brent trading at approximately $109.49-$111.04/bbl.
The shape of the forward curve carries information. When near-term contracts trade significantly above longer-dated ones (a structure known as backwardation, where buyers pay a premium for immediate delivery because they expect near-term scarcity), the market is pricing the disruption as time-limited. When the premium flattens across the curve, it signals the market is treating the supply risk as structural.
At $105 WTI with a confirmed 4 million barrel-per-day Hormuz flow reduction and an IEA undersupply forecast through October 2026, two tail-risk scenarios frame the investor decision:
Investors who understand this asymmetry are better positioned to size energy exposure based on structural fundamentals rather than session-to-session headlines.
The IEA’s October 2026 undersupply horizon, the 4 million barrel-per-day Hormuz flow reduction, and the bond market’s inflation-expectations repricing together mean that $105 WTI is better understood as a base scenario rather than an outlier peak, unless a credible ceasefire materialises well before June.
One significant wildcard remains. A potential decision by the Trump administration to lift sanctions on Chinese refiners purchasing Iranian crude could partially offset supply losses if implemented, but the market has not priced this as a near-term reality.
Two data points will determine whether the $105 level holds, rises further, or gives back the risk premium in the coming weeks:
Those two signals, one geopolitical, one data-driven, are the inputs that matter most. Everything else is noise around the central question: whether the physical barrels come back before the calendar runs out.
This article is for informational purposes only and should not be considered financial advice. Investors should conduct their own research and consult with financial professionals before making investment decisions. Past performance does not guarantee future results. Financial projections are subject to market conditions and various risk factors.
WTI crude oil prices surged 4.20% to $105.42 per barrel after The New York Times reported that the United States and Israel were in intensive planning for coordinated military strikes on Iran, including the possible seizure of Kharg Island, Iran's primary crude export terminal.
The Strait of Hormuz is the world's most critical oil transit chokepoint, through which a significant share of globally traded crude and liquefied natural gas passes daily; there is no practical large-scale alternative route for Gulf producers, meaning any disruption there can immediately reduce global supply by millions of barrels per day.
The IEA projected in its May 2026 Oil Market Report that global oil markets would remain materially undersupplied through at least October 2026, even under its base case scenario that assumes the Iran conflict is resolved by June 2026.
Oil above $100 per barrel feeds into consumer price indices through fuel, transport, manufacturing, and food costs within a three-to-six month lag; in response, an ECB Governing Council member warned the ECB could be forced to raise rates, while CME FedWatch data showed a 40% probability of a Fed hike by year-end 2026.
The two most important signals are any official statement on US-Israeli strike timing (confirmation or denial of the reported planning) and the next IEA monthly oil market report, which will either maintain or extend the October 2026 undersupply projection.