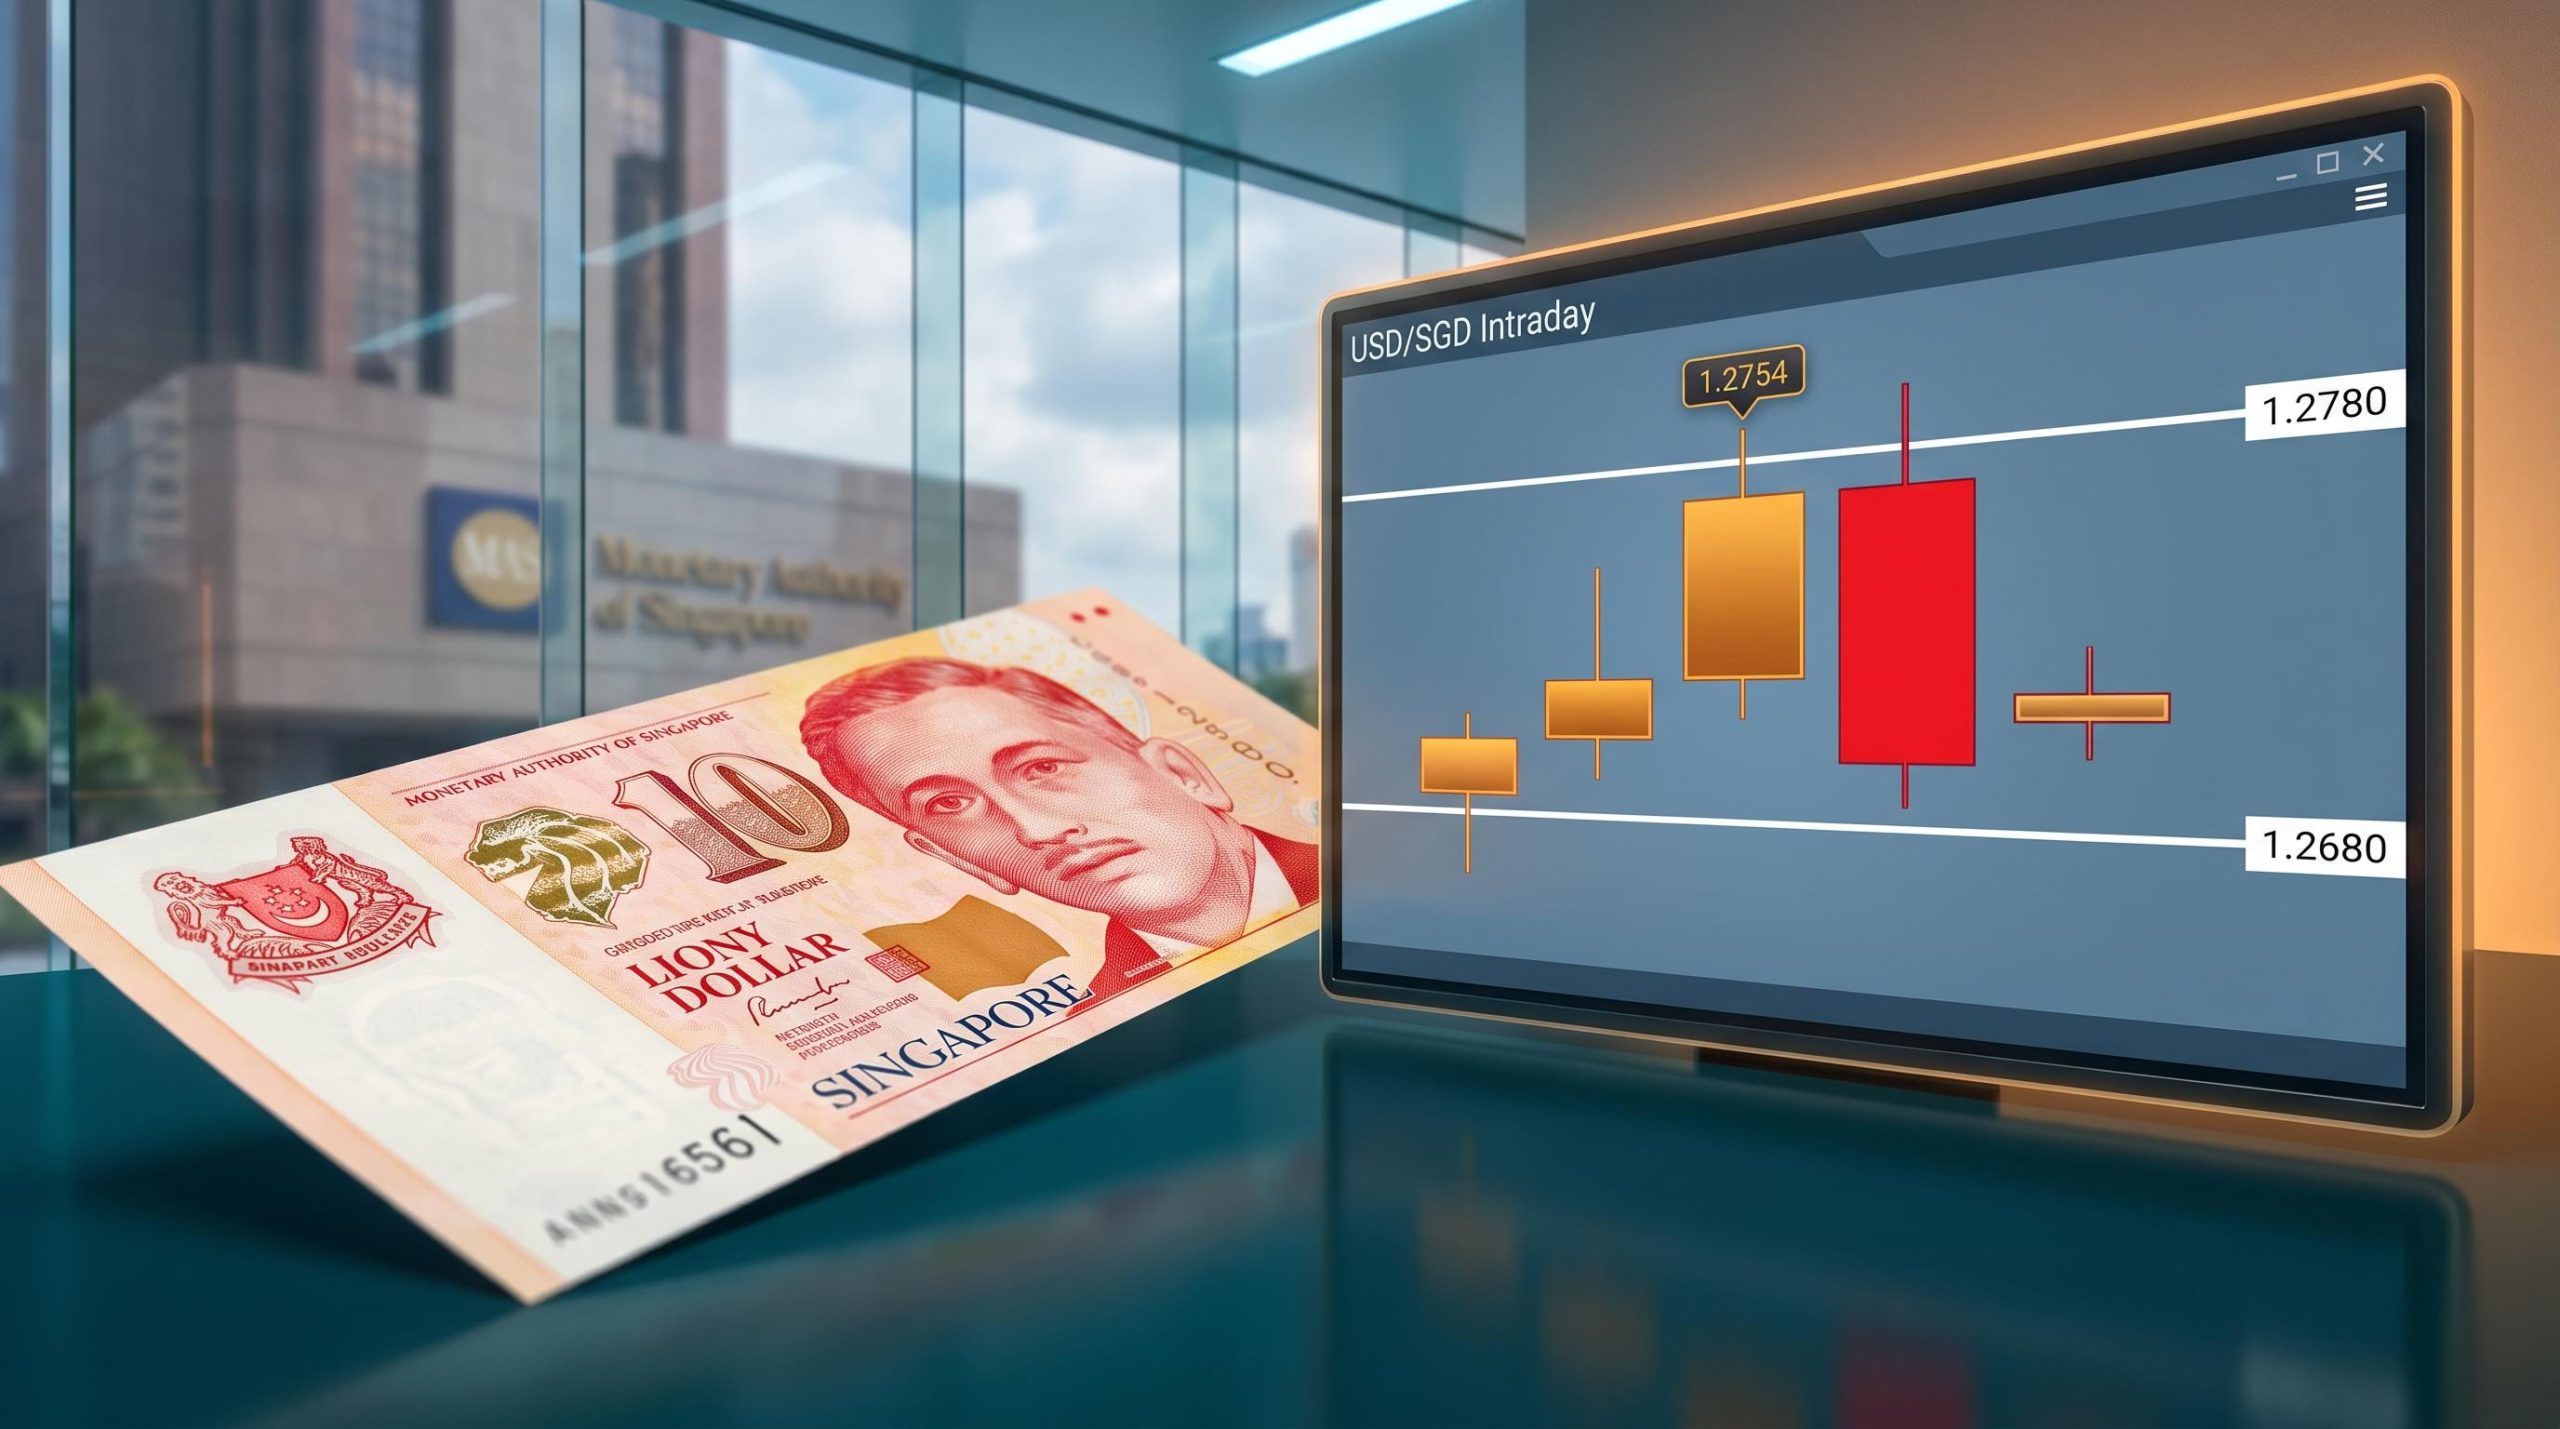
UOB has abandoned a month-long bearish call on USD/SGD, moving to a neutral stance after the pair spiked to 1.2754 on 31 August 2026 and then reversed hard, a two-way whipsaw that forced the bank to widen its projected trading band twice in quick succession.
The revision, from negative to neutral, came after USD/SGD broke above resistance at 1.2730, triggered an overbought signal, then pulled back to 1.2710 without building any clear downward momentum. That inconclusive price action, paired with the Monetary Authority of Singapore’s (MAS) S$NEER sitting firmly in the upper half of its appreciating policy band, pushed UOB to describe the pair as consolidating within a defined range rather than trending either way.
Here is what UOB’s revised call means in practical terms for anyone watching this pair. The specific support and resistance levels the bank is now tracking, what the S$NEER position implies for how far the pair can realistically rally, and what a neutral stance actually signals about the next move all follow below.
UOB drops its negative USD bias after a month of holding the call
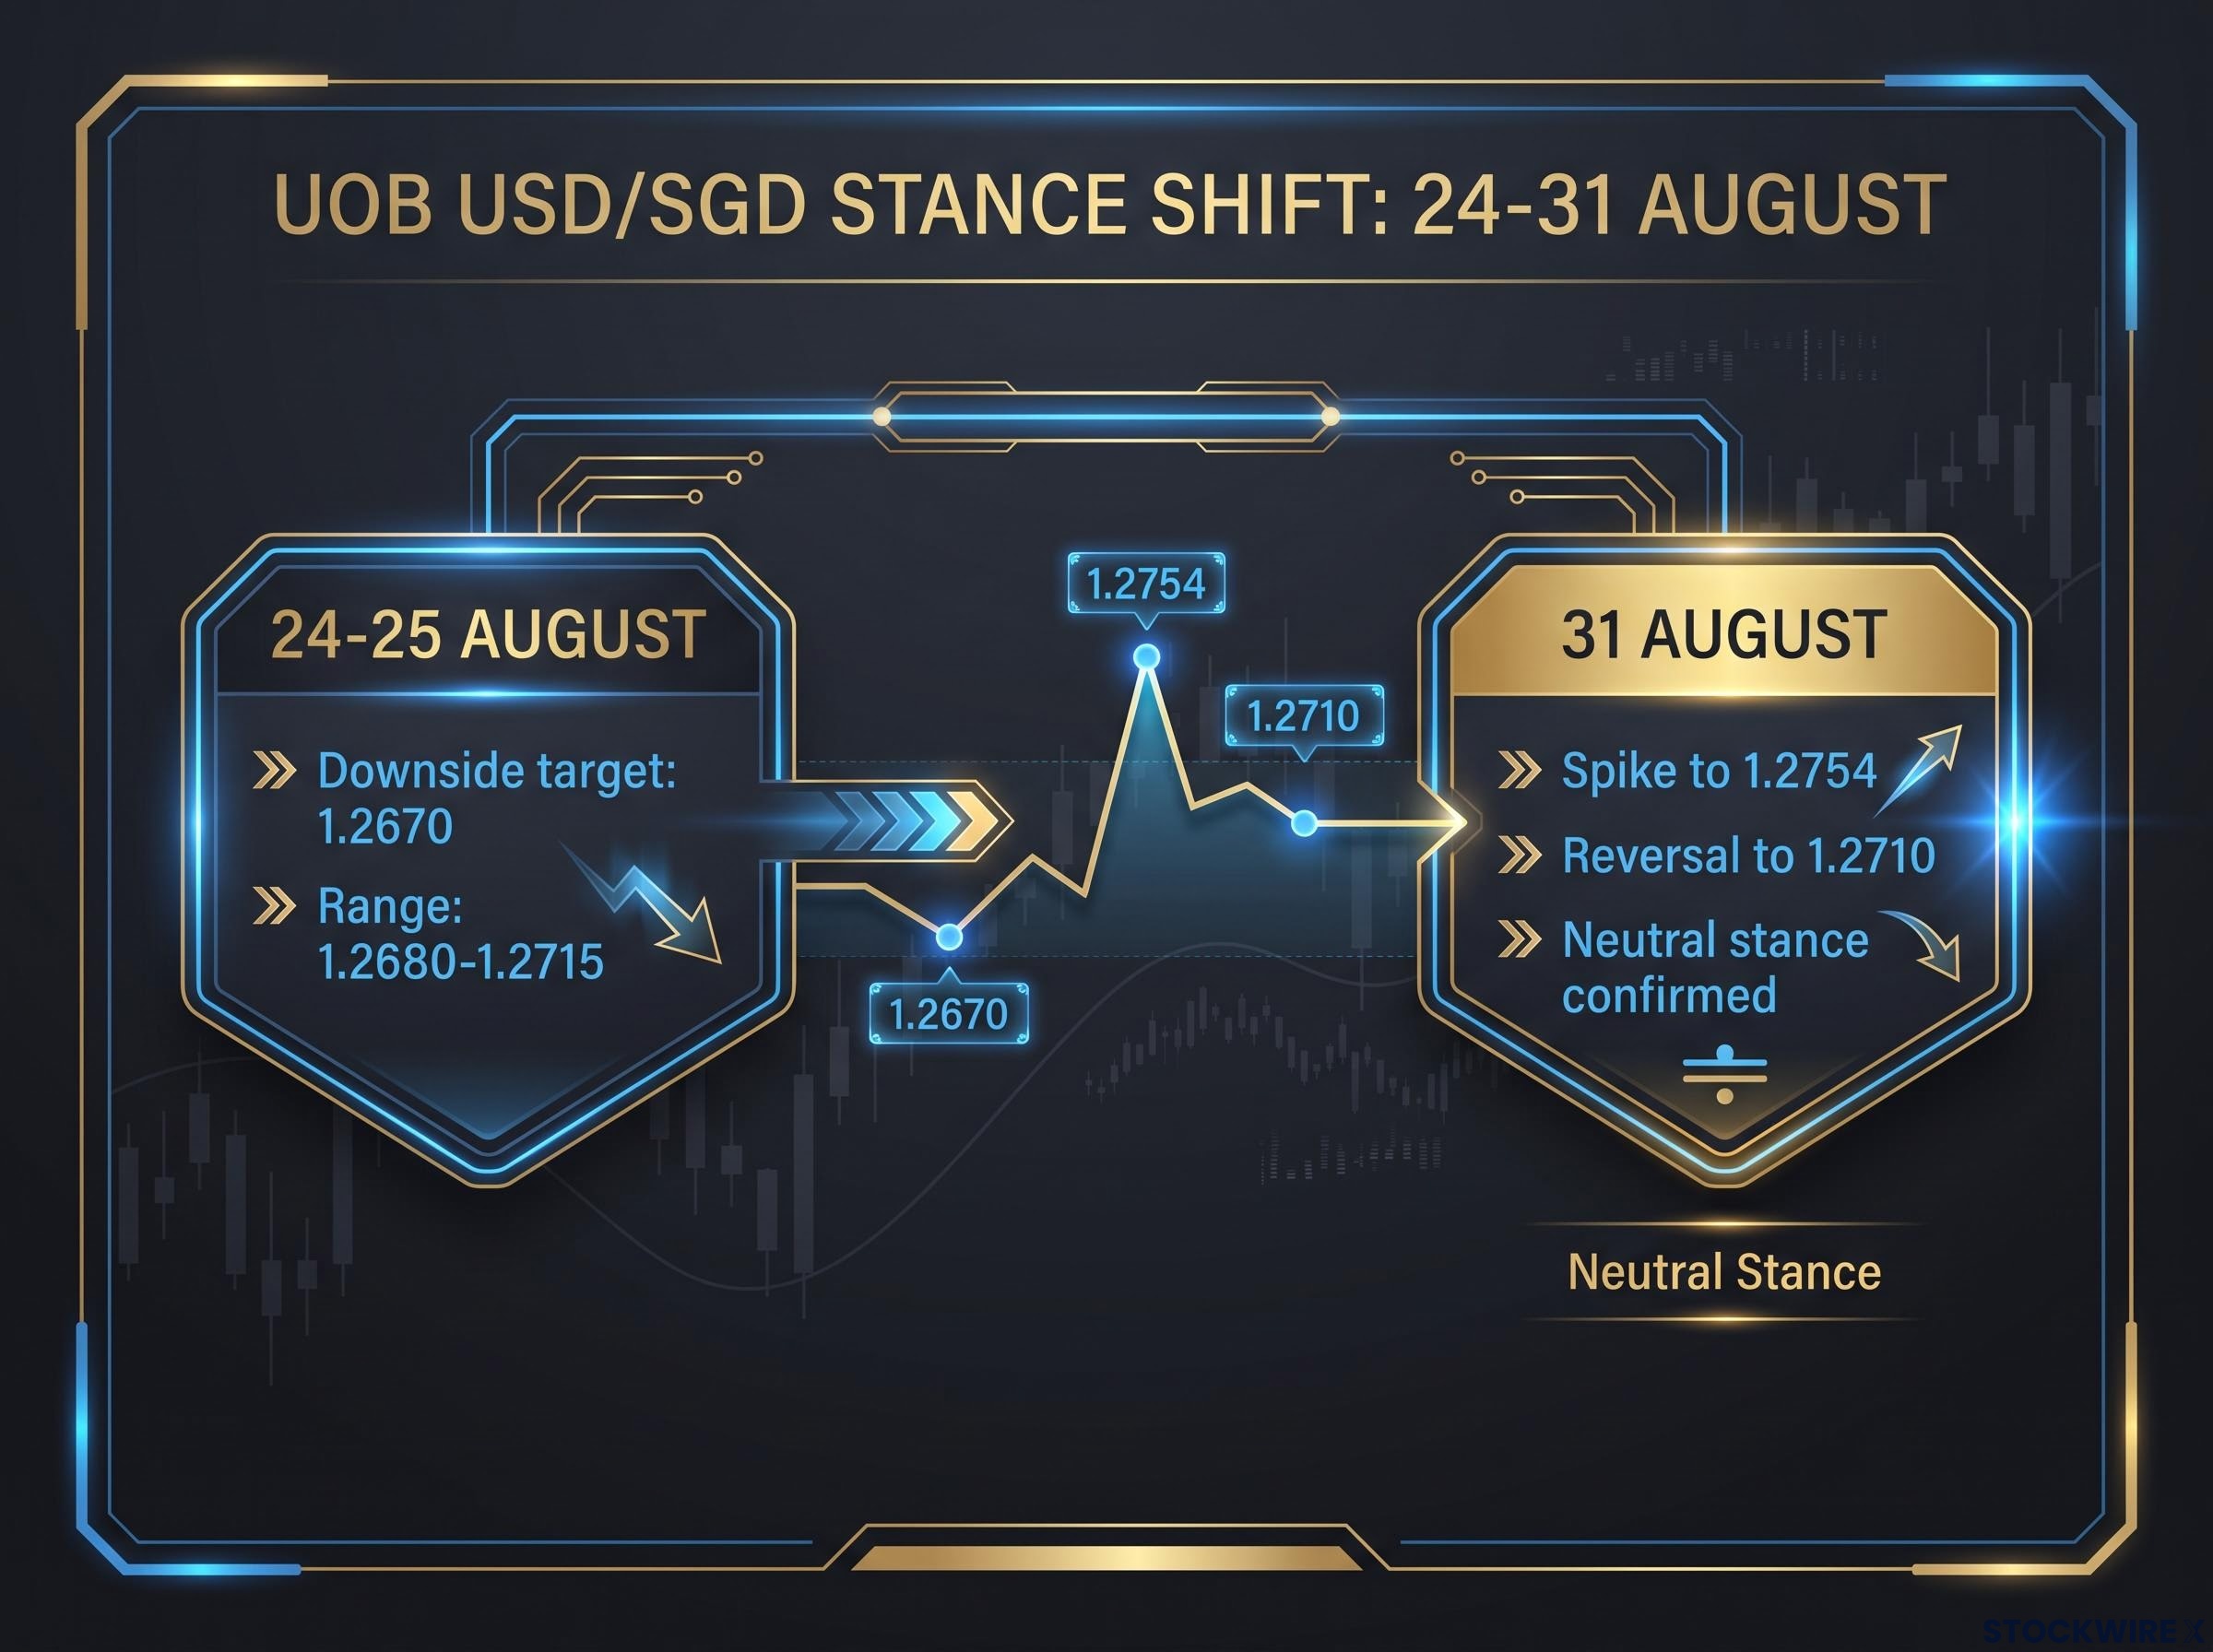
For roughly a month, UOB analysts Quek Ser Leang and Lee Sue Ann had held a downside bias on USD/SGD. As of 24-25 August 2026, they were targeting 1.2670 on the downside and projecting a tight range of 1.2680-1.2715, with a break above 1.2740 flagged as the signal that would tip the pair into range-trading.
That signal arrived on 31 August 2026. USD/SGD pushed through resistance near 1.2730 and surged to an intraday high of 1.2754, a rapid move that invalidated the tight-range view and forced a formal stance revision from negative to neutral, according to UOB commentary syndicated via FXStreet.
Prior USD/SGD equilibrium analysis from mid-August identified the 1.2770-1.2740 zone as the downside structure sellers needed to clear to confirm a bearish trend, a level set that now maps directly onto the lower half of UOB’s widened neutral band.
The revision was tested almost immediately.
Rather than extending, the pair reversed sharply back to 1.2710 intraday. Yet the drop did not produce convincing downward momentum either, leaving USD/SGD without a clear directional signal in either direction.
The sequence played out like this:
- Prior negative bias: downside target of 1.2670, tight range of 1.2680-1.2715 (24-25 August)
- Breach of resistance at 1.2730, the level that would trigger a stance shift
- Surge to an intraday high of 1.2754 on 31 August, but in an overbought configuration
- Sharp reversal to 1.2710 intraday, without strengthening bearish momentum
- Neutral stance confirmed, replacing the month-old bearish call
The detail that matters here is the shape of the move, not just its direction. An overbought spike followed instantly by a sharp reversal is precisely why UOB landed on neutral rather than flipping bullish.
This is not a call for a new uptrend. It is a call for a stalemate. Understanding that distinction tells you whether the neutral stance reflects genuine two-way balance or simply a bank stepping back from a losing bearish call while the volatility settles. On the evidence, it is closer to the former: the pair broke higher but could not hold, then fell back but could not follow through.
When big ASX news breaks, our subscribers know first
What the new trading band looks like and where the key levels sit
Both times UOB widened its band, it was reacting to realised volatility rather than admitting a forecast miss. The first adjustment came on 31 August, when the neutral range was set at 1.2705-1.2780. After the unexpected intraday drop to 1.2710, the bank broadened it again to 1.2680-1.2780 to capture the elevated price swings.
Inside that band, UOB is watching a granular set of levels. Immediate resistance sits at 1.2725, with secondary resistance at 1.2735 and major resistance capping the band at 1.2780. On the downside, near-term support is expected to hold above 1.2695.
UOB’s current USD/SGD level map
| Level type | Price | Direction | Significance |
|---|---|---|---|
| Immediate resistance | 1.2725 | Upside | First cap on intraday gains |
| Secondary resistance | 1.2735 | Upside | Aligns with 1 Sep close; next barrier |
| Major resistance | 1.2780 | Upside | Top of UOB neutral band; overbought ceiling |
| Near-term support | Above 1.2695 | Downside | Floor of expected range absent strong bearish momentum |
| Band floor | 1.2680 | Downside | Lower bound of widened neutral range |
The two-stage widening is a volatility response, not a broken forecast. When price action repeatedly overshoots the projected range in both directions, widening the band is how an analyst captures what the market is actually doing instead of chasing point forecasts that keep getting proven wrong.
Here is the part that matters for anyone acting on this. USD/SGD closed at 1.2735 on 1 September 2026, with a daily range of 1.2696-1.2738, according to Investing.com. That leaves spot pressing directly against secondary resistance, which means UOB’s band offers very little upside room from current levels before the overbought ceiling at 1.2780 becomes the dominant constraint. The overbought reading argues for a capped advance, while the absence of strong bearish momentum argues against a fresh leg down.
How the S$NEER policy anchor shapes the ceiling on USD/SGD gains
Above the chart sits a policy force that the tactical levels do not fully capture. The Singapore dollar nominal effective exchange rate (S$NEER), the trade-weighted measure MAS manages rather than setting interest rates, has held in the upper half of its appreciating policy band throughout 2026.
MAS has kept that trajectory intact across the year. At its 14 April 2026 statement, it made a slight increase to the rate of appreciation of the S$NEER band, with no change to the band’s width or centre. At the most recent review on 27 July 2026, it increased the rate of appreciation very slightly again, a smaller move than April’s.
The three 2026 policy actions read as follows:
- January 2026: appreciation rate maintained, S$NEER in the upper half of the band
- April 2026: slight increase to the rate of appreciation
- July 2026: very slight further increase to the rate of appreciation
MAS was explicit about where the currency has sat.
“The S$NEER has stayed in the upper half of the appreciating policy band.”
Monetary Authority of Singapore, Monetary Policy Statement, 27 July 2026
That position connects directly to UOB’s level map. The bank’s S$NEER-based modelling implies a corresponding USD/SGD range of roughly 1.2676-1.2740, which sits comfortably inside the widened neutral band and reinforces the view that the pair’s upside is structurally capped.
This is not a contradiction between MAS and UOB, just a difference in time horizon: neutral for days, SGD-firm for months. What it tells you is that the S$NEER-implied ceiling near 1.2740 sits below UOB’s major resistance at 1.2780. For the pair to reach the top of its tactical band, USD strength would need to be strong enough to overcome an active appreciating policy headwind, which raises the bar for any bullish USD/SGD scenario considerably.
Morningstar’s estimate of a roughly 15% dollar valuation premium in mid-2026 provides structural context for why the S$NEER-implied ceiling near 1.2740 carries weight: if the DXY is cyclically stretched, the MAS appreciating band faces less sustained upward pressure than rate differentials alone would imply.
What a neutral stance actually means for the pair from here
In UOB’s framework, neutral is a specific operational call, not a shrug. It means no resumption of the prior decline is expected, but the overbought configuration caps the advance, so the pair is projected to oscillate within the 1.2680-1.2780 band rather than trend persistently in either direction. The bearish thesis held for roughly a month before being retired on 31 August.
Two events would force another stance revision:
- If USD/SGD breaks and holds decisively above 1.2780, then the neutral call gives way to bullish resumption, likely prompting UOB to reassign an upside target.
- If the pair drops through 1.2695 with strengthening downward momentum, then the prior bearish thesis reopens.
There is a macro overlay the band does not fully capture. Shifts in US Federal Reserve expectations or a deterioration in global risk sentiment could push USD/SGD toward either extreme of the range faster than the technical configuration alone would suggest, which is why the defined levels matter more, not less, in choppy conditions.
The broader USD technical bias heading into September showed the DXY trading below both its nine-period and 50-period EMAs with moving average signals net bearish, a dollar-wide backdrop that reinforces why UOB’s overbought ceiling at 1.2780 is a meaningful constraint rather than a soft guide.
The near-term arithmetic is worth sitting with. With spot at 1.2735 and the S$NEER-implied ceiling near 1.2740, the pair has roughly 5 pips of policy-implied room before structural resistance bites. That points you toward the downside of the band as the more probable next test, rather than a fresh push higher. Knowing the specific triggers gives you a monitoring framework you can apply directly instead of waiting for the next analyst note to interpret the move for you.
This article is for informational purposes only and should not be considered financial advice. Investors should conduct their own research and consult with financial professionals before making investment decisions. Past performance does not guarantee future results. Financial projections are subject to market conditions and various risk factors.
Range-trading confirmed, but the triggers to watch have not gone away
UOB’s neutral stance is a genuine analytical conclusion, not an absence of one. The pair is expected to consolidate, not trend, and that view carries specific numbers behind it.
The regime is defined by the 1.2680-1.2780 band, with 1.2780 as the ceiling and 1.2695 as the near-term floor. A decisive break above the top or a momentum-backed drop through the floor is what would change the call.
Above all of it sits the S$NEER, holding in the upper half of its appreciating band. That structural anchor means any eventual resolution of the range is more likely to favour the Singapore dollar over a multi-week horizon, even while the day-to-day picture stays inconclusive. The near-term signal is a stalemate; the medium-term lean is toward a firmer SGD.
For readers wanting broader context on Singapore’s financial markets in 2026, our dedicated guide to Singapore’s 2026 market rally covers the S$66 billion deposit surge, the four compounding tailwinds driving DBS, OCBC, and UOB simultaneously, and what the semiconductor cycle means for the country’s equity outlook.