
Thirty-five analysts cover the same stock. They read the same filings, model the same revenue, and watch the same losses pile up. Their published price targets range from $117 to $450.
That is not a consensus. That is a disagreement wearing a consensus costume.
The stock in question is SPCX, and the roughly 3.8x gap between its lowest and highest published targets ranks among the widest on Wall Street. Here is why that happens. When a company posts hundreds of millions in quarterly losses while also growing revenue more than 90% year-over-year, no standard valuation model produces a stable number.
The spread is not sloppiness. It is the model being honest about how little anyone actually knows.
Here is what that $117-to-$450 range is telling you, and how to use it to make a more honest assessment of any growth stock you hold or are considering. This is not a buy or sell call on SPCX. It is a repeatable lens for reading uncertainty in any unprofitable growth stock valuation, so you can size and hold positions with the conviction the evidence actually warrants.
What a 3.8x price target spread actually tells you
Start with the raw number. Across 35 buy ratings on SPCX, the low target sits at $117, the high at $450, and the consensus average lands at $219.22. The ratio between the extremes is roughly 3.8x.
That ratio is not a rounding artefact. It is the visible surface of a much deeper disagreement about what the company is worth.
Price target dispersion is a direct function of input disagreement. Every analyst is stacking assumptions on top of assumptions: a revenue growth rate, a margin trajectory, a discount rate, and a terminal value framework. Change any one of those foundational beliefs, and the output moves. Change several, and the outputs diverge by multiples.
That is what you are looking at here. The $450 analyst and the $117 analyst are not running the same model with different arithmetic. They are running internally consistent models that begin from different foundational beliefs about the future.
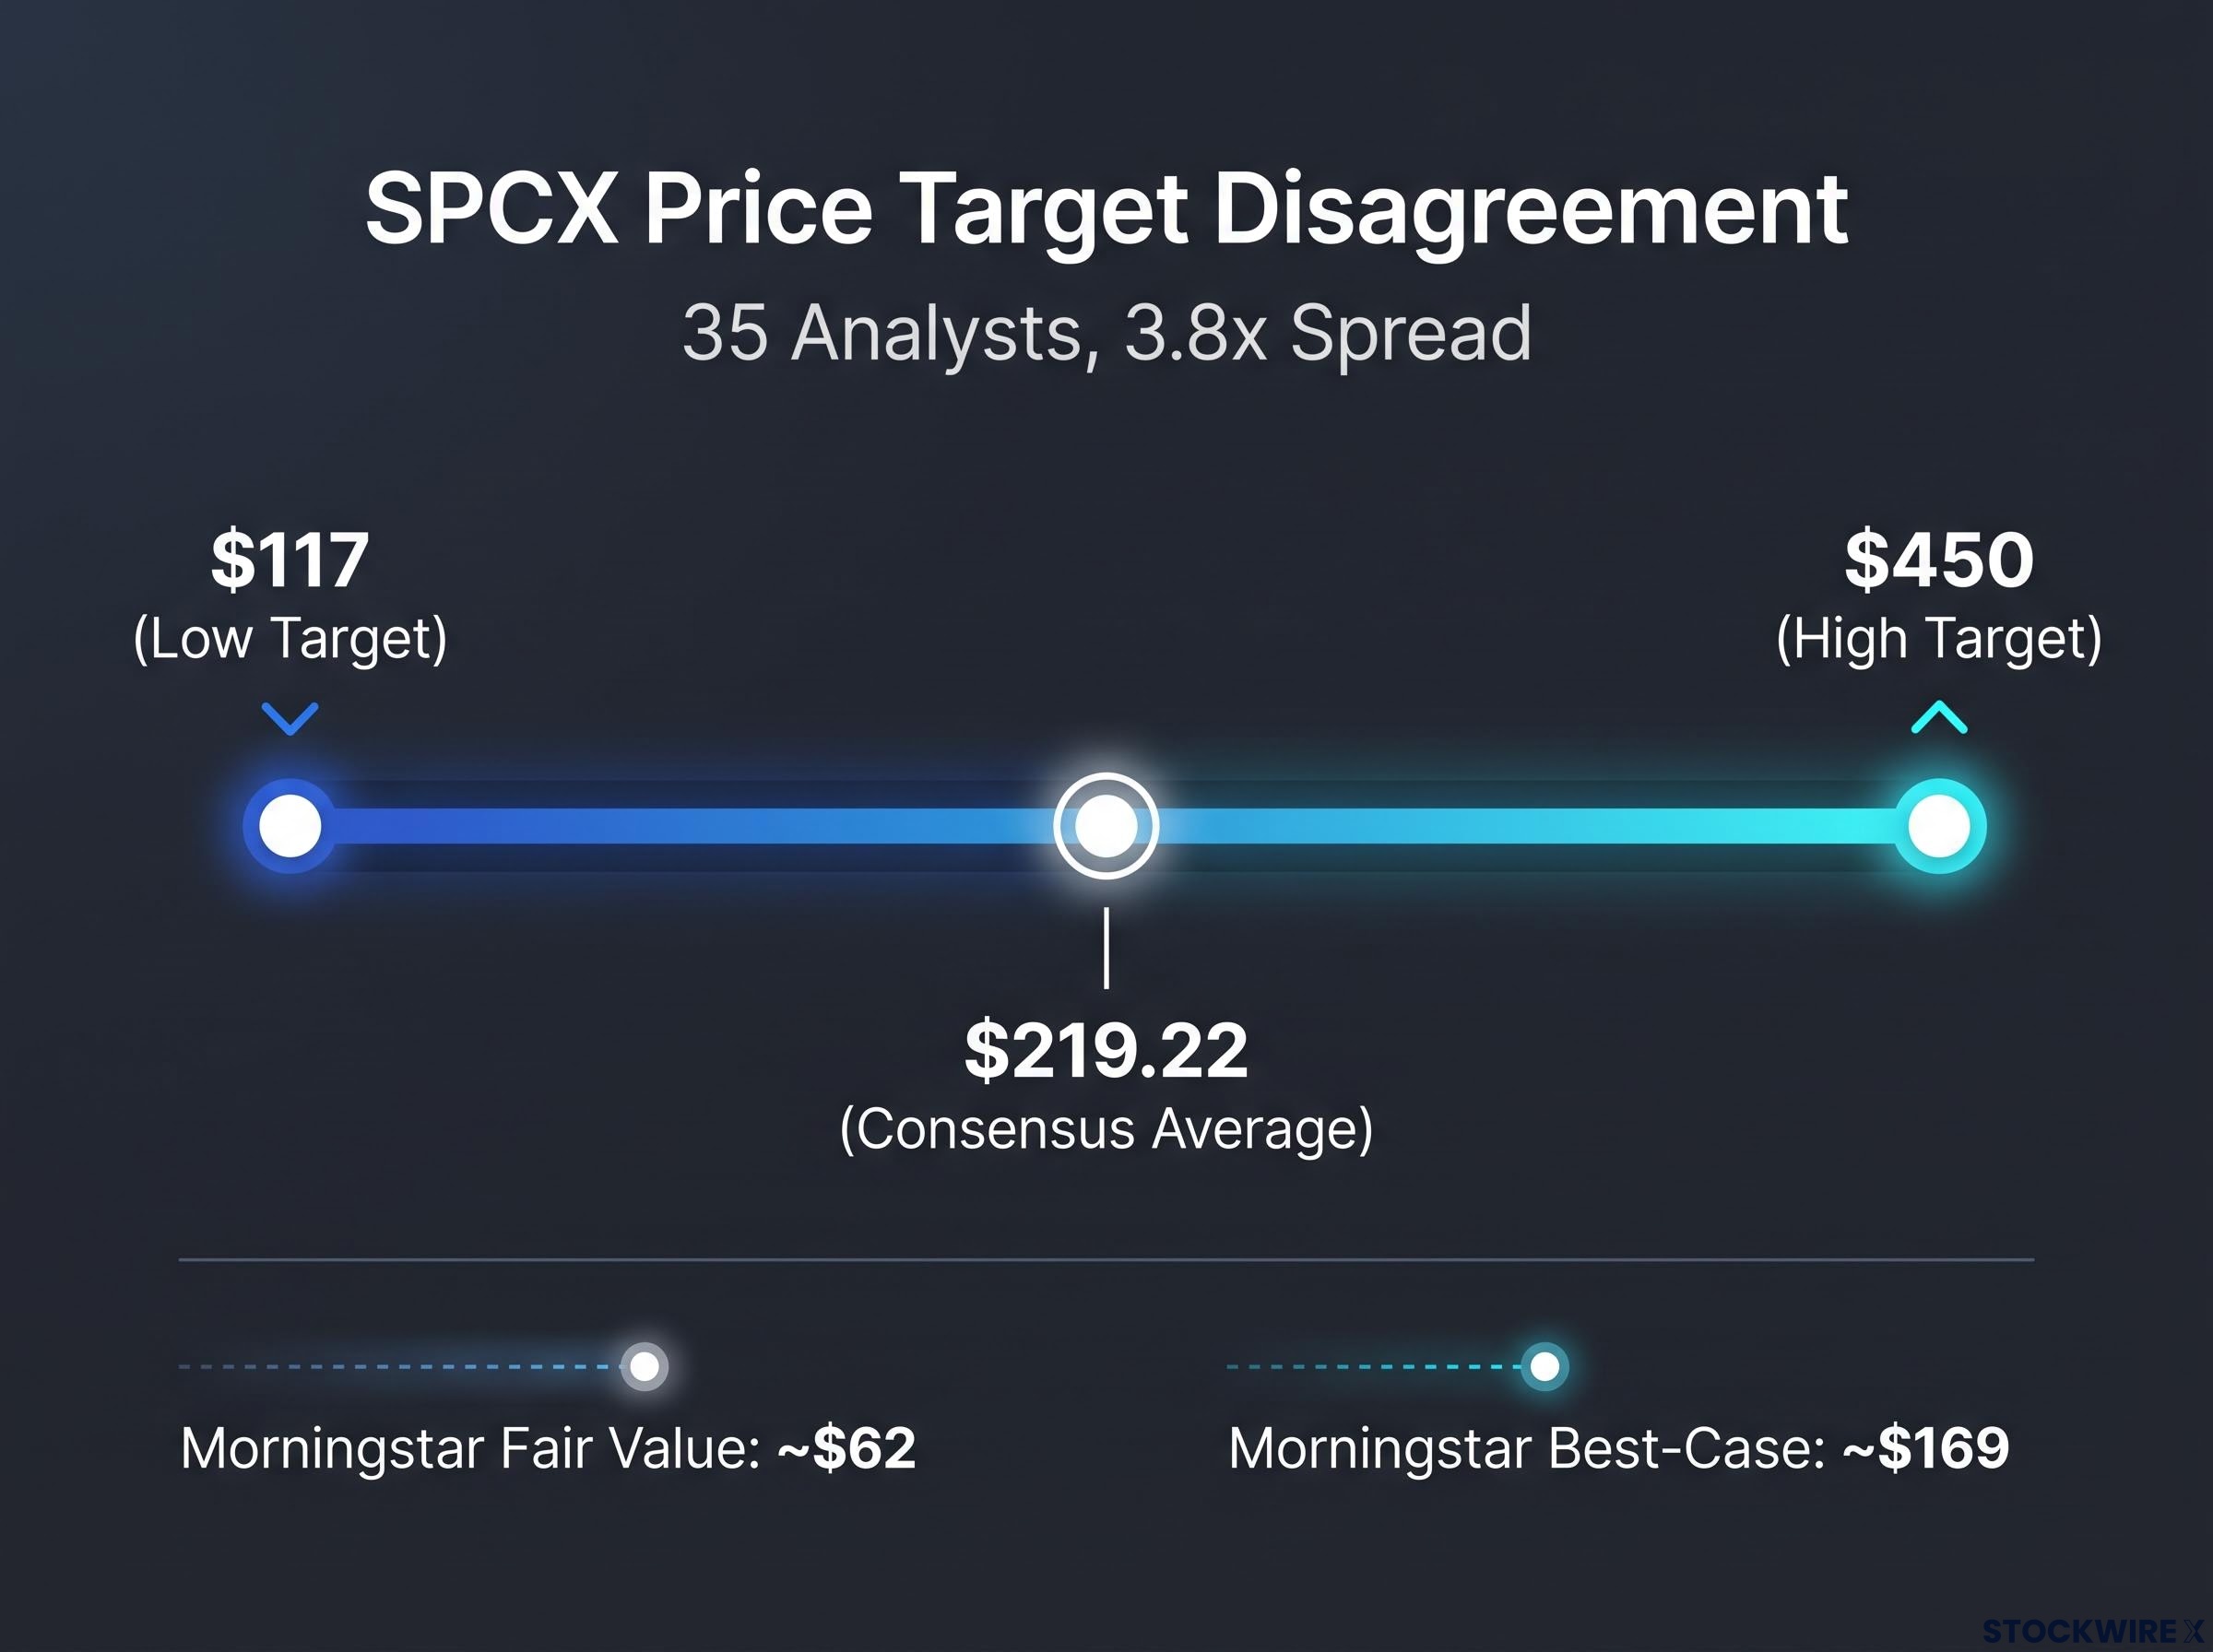
A spread this wide is not a consensus view. It is a catalogue of disagreements.
This kind of dispersion is not unique to SPCX. Semiconductor names have historically shown similar spread widths during their most contested periods, and Tesla in its early years was a textbook example of the same dynamic. The pattern appears whenever a business is priced on a future that has not yet arrived.
The same pattern of compounding assumption divergence appears across other high-growth names: the analyst target spread on Robinhood runs $106 wide across 20-28 analysts, and its realised 2025 price range of $65 to $153 mapped almost exactly onto what the Street had modelled, confirming that the width of disagreement is itself a more useful signal than any single consensus figure.
Why the consensus average can mislead you
Here is where retail investors get caught. A single consensus figure of $219.22, computed from a range that runs from $117 to $450, looks like a target. It is not. It is the midpoint of a very wide distribution.
| Stock | Low Target | High Target | Consensus | Spread Ratio |
|---|---|---|---|---|
| SPCX | $117 | $450 | $219.22 | 3.8x |
| Tesla (mid-2022) | $67 | $220 | Wide band | ~3.3x |
| Typical mature large-cap | Narrow | Narrow | Tight cluster | Narrow |
Academic work by Steffen, Zhang, and Palley suggests that when target dispersion is high, consensus targets can become negatively correlated with future realised returns. Treat that as a flagged, unverified finding rather than settled fact. Even so, the direction of the insight matters: a wide spread is a risk signal, not a reassurance.
What this means for you is straightforward. When the spread is this wide, the consensus does not reduce your uncertainty. It hides it. Anchoring to $219 as though it were a genuine price target, rather than the middle of a band nobody agrees on, is a decision-making error worth actively avoiding.
When big ASX news breaks, our subscribers know first
Why 35 analysts can rate a money-losing stock a buy
Your first instinct is probably scepticism. How do 35 analysts look at a company bleeding billions and still stamp it a buy? The answer is that a buy rating is not a verdict on today’s income statement.
It is a bet on a future one.
Consider what the current financials actually look like. SPCX reported a loss of $0.09 per share in its most recent quarter, on revenue of roughly $7.81 billion, up 91.9% year-over-year. For fiscal year 2025, the company generated approximately $18.67 billion in revenue but posted a net loss of $4.93 billion, an annual EPS of -$1.69. These figures are reported estimates and remain unverified, so hold them loosely.
A buy rating on a company losing $4.93 billion a year is not a contradiction. It is a claim that the future income statement will look nothing like the current one.
Two forces keep those ratings elevated. The first is genuine: analysts are modelling a multi-year thesis in which revenue growth eventually converts into operating profit. The second is structural. Analysts are documented to be slow to downgrade names with strong momentum, and the research from Steffen, Zhang, and Palley describes an “incentive-driven staleness” where optimistic targets linger after the news turns. Treat that framework as explanatory rather than proven, but recognise the friction is real.
Microsoft presents a structurally similar puzzle: 55 analysts hold unanimous buy ratings yet disagree by $470 on price targets, a gap that maps onto two internally coherent frameworks rather than analytical error, illustrating that target dispersion at this width is a feature of genuine uncertainty about capital allocation outcomes, not a failure of the consensus process.
For that $219-plus target to be justified, several specific conditions have to hold:
- Sustained revenue growth: the top line needs to keep compounding at a high rate for years, not quarters.
- A credible path to operating leverage: costs must grow slower than revenue, eventually crossing into profit.
- Capital availability: the company must fund heavy reinvestment without crippling dilution.
- A defensible discount rate: the assumed cost of capital must hold up in a rate-plateau environment.
None of those are guaranteed. They are the load-bearing assumptions the bull case rests on.
History says losses do not preclude value. Amazon is the reference point.
Amazon posted a net loss of roughly $720 million in 1999 and did not report its first full-year profit, about $35 million, until 2003. The analyst disagreement did not narrow because time passed. It narrowed once the company proved it could generate real cash.
The read you should take is this. A “strong buy” consensus on a name like this signals confidence in a long-horizon story, not near-term price safety. Before you treat it as a green light, ask what specific milestones would need to occur, and over what timeline, before that rating matches your actual holding period.
How to actually value a company that does not make money
You cannot value a company on earnings it does not have. So professionals reach for a different tool, and understanding how they assemble it tells you exactly which assumptions are doing the heavy lifting.
Discounted cash flow (DCF) remains the foundational framework. A DCF estimates what a company is worth today by projecting its future cash flows and discounting them back to a present value. For a mature business, that is mostly a question of next year’s profit. For an unprofitable growth stock, it requires adaptation.
Instead of near-term earnings, the model runs on four core inputs:
- Revenue growth rate: how fast the top line expands over the projection window.
- Target operating margin: the profit margin the business eventually reaches at maturity.
- Reinvestment rate: how much capital gets ploughed back to sustain that growth.
- Terminal growth assumption: the rate at which cash flows grow forever after the explicit forecast ends.
That fourth input is where the whole thesis lives or dies. In long-horizon growth stocks, terminal value can account for up to 80% of total DCF valuation. Treat that figure as a frequently cited modelling observation rather than a hard number, but the implication holds: most of what the model produces comes from assumptions about a company that will exist decades from now.
The terminal value assumption alone typically drives 60-80% of a DCF model’s total implied intrinsic value, which is why two analysts can share the same near-term revenue forecast yet still produce price targets that differ by 3x or more depending on their view of a business that will exist in 2040.
That is why analyst outputs diverge so violently. Morningstar, a value-focused research firm, estimates SPCX fair value at roughly $62 per share, assigning the company a “narrow moat”, the term for a modest and defensible competitive advantage. Even in Morningstar’s best-case scenario, fair value rises only to about $169. Those figures are unverified, but they illustrate the point precisely: the same model structure, fed different moat and margin assumptions, produces outputs that differ by more than 100%.
| Approach | Core Input | Key Assumption | Discount Rate Sensitivity | Works Best When |
|---|---|---|---|---|
| DCF (long-horizon) | Future cash flows | Terminal value | Very high | Long projection visibility |
| Comparables | Peer multiples | Which peers apply | Low to moderate | Clear comparable set exists |
| Narrative/scenario | Adoption story | Probability of outcomes | Moderate | Early-stage, uncertain markets |
The practical takeaway reframes how you read any analyst target. The question is not “what is the consensus?” It is “what does the $450 analyst assume about 2040 that the $117 analyst does not?”
Why discount rate changes hit unprofitable growth stocks hardest
Here is the mechanic that makes these stocks so volatile. The discount rate is the annual percentage used to convert future money into today’s value, reflecting both time and risk.
Take $1 billion of cash flow arriving in year 25. At a 7% discount rate, its present value is roughly $184 million. Nudge the rate to 9%, and that same billion is worth only about $116 million. A two-point shift wipes out more than a third of the value, and no operational fact about the business has changed.
That is why these stocks behave like long-duration bonds. When rates rise, price falls, even if the company is performing exactly to plan. Goldman Sachs strategists have warned that unprofitable growth names face compounding financing and dilution risk in higher-rate environments, a perspective worth weighing rather than treating as documented fact.
As of September 2026, with rates sitting on a plateau, this sensitivity is an active concern, not a theoretical one. It is the single largest reason the bull and bear cases refuse to converge.
Historical cases where the spread eventually resolved (and what forced it)
Wide spreads do not stay wide forever. Something eventually forces the disagreement to collapse. The useful question is not whether it resolves, but what specifically triggers the resolution.
Amazon and Tesla both offer the pattern. Neither converged because analysts simply grew patient.
Amazon’s disagreement narrowed when the company began disclosing the economics of its cloud business, giving even sceptics a segment they could model with real margins. Tesla’s spread compressed once automotive gross margins climbed and held above a threshold that made the profitability story credible. In each case, a specific, measurable disclosure gave doubters a reason to update their models.
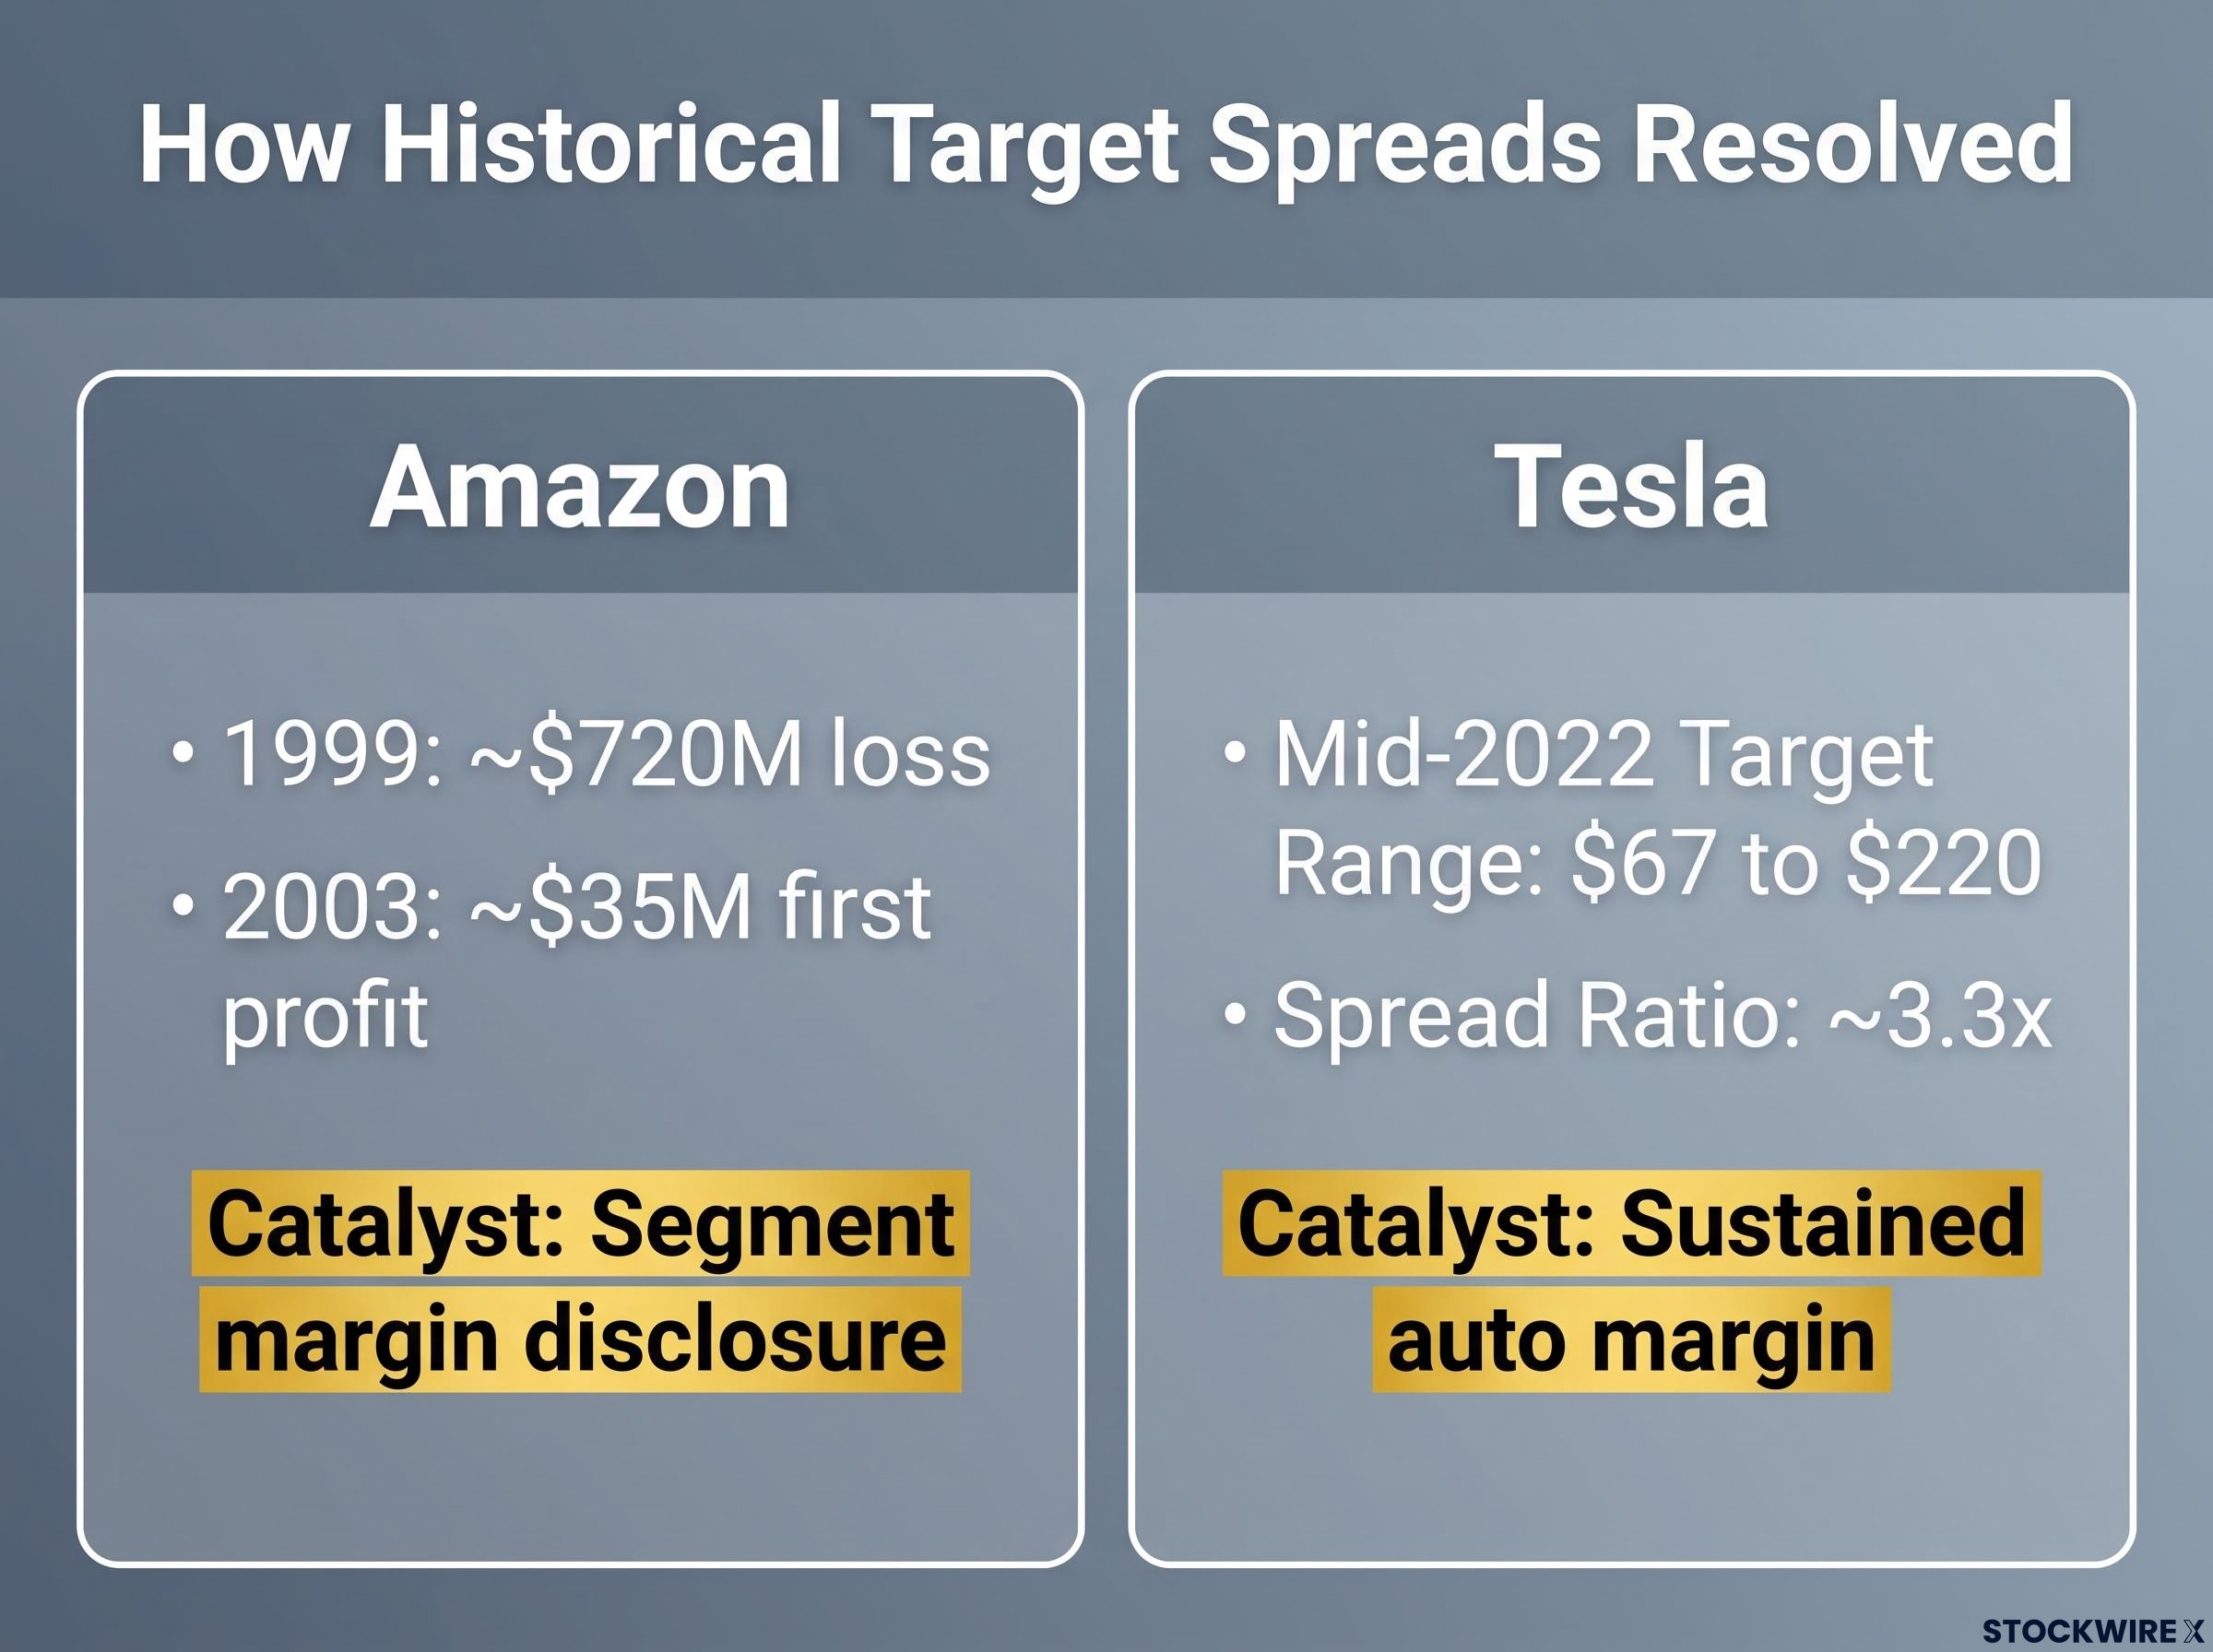
| Company | Peak Loss Period | Initial Spread | Convergence Catalyst | Path |
|---|---|---|---|---|
| Amazon | ~$720M loss, 1999 | Very wide | Segment margin disclosure | First profit 2003 |
| Tesla | Recurring early losses | $67 to $220 (2022) | Sustained auto margin | Multi-year |
| SPCX | ~$4.93B loss, FY2025 | $117 to $450 | Watching for | TBD |
Amazon’s $720 million 1999 loss and its first full-year profit of roughly $35 million in 2003 are illustrative estimates, as is Tesla’s mid-2022 target range of $67 to $220. The specifics matter less than the shape of the story, which repeats.
There is a cautionary edge to this too. Research Affiliates has drawn comparisons between today’s story-driven space and AI names and the dot-com era, noting that when an adoption narrative cracks, valuations can reprice downward fast even while the underlying business keeps growing. Treat that as one analytical view, not a forecast.
So what should you watch for? The disclosures that historically force convergence tend to share a common feature: they replace narrative with numbers.
- Segment-level margin disclosure: a specific business line showing real, modellable profitability.
- Free cash flow turning positive: the point where the company funds itself.
- Falling share-based compensation as a percentage of revenue: a signal that dilution pressure is easing.
- Guidance implying a concrete profitability timeline: management putting a date on the thesis.
The lesson is not a prediction about SPCX. It is a watchlist. When you hold a high-dispersion growth stock, these are the signals that tell you whether the bull or bear thesis is gaining empirical ground, so you are updating with the evidence rather than reacting after the consensus has already moved.
Reading a wide spread as a risk signal, not a buy signal
Pull the threads together and the guide’s central lesson lands here. A wide analyst target range is not a menu you order from. It is a formal quantification of how much genuine uncertainty sits inside the thesis.
The spread is not a range of opinions you get to choose from. It is a measure of how much genuine uncertainty you are taking on when you buy the stock.
Treating the $117-to-$450 band as a risk measurement, rather than a price discovery tool, changes three concrete behaviours:
- Use the spread as a position-sizing input. The wider the disagreement, the smaller the position that a calibrated investor takes, because the range of plausible outcomes is genuinely large.
- Identify the specific disclosure that would confirm or refute the bull thesis. Pick the metric, segment margins, positive free cash flow, a profitability timeline, and track it directly rather than watching the price.
- Set an exit condition based on thesis invalidation, not price movement alone. Decide in advance what evidence would break the case, so you act on facts rather than sentiment.
A margin of safety framework operationalises the position-sizing discipline the spread demands: by requiring purchase at 30-50% below intrinsic value depending on business quality, it converts the abstract instruction to size down in high-uncertainty names into a specific price threshold calculated before any position is opened.
There is a deeper distinction to hold onto. Some wide spreads reflect early-stage uncertainty that time and data will eventually resolve, the legitimate high-risk growth story. Others reflect permanent narrative pricing that will never anchor to fundamentals. The remedy for both is the same discipline.
Remember that Morningstar’s rigorous framework places SPCX fair value at roughly $62, with a best case near $169, both well below where the stock has traded. When one careful methodology lands that far from the consensus, the disagreement itself is information.
Before acting on any growth stock consensus, you should be able to state in a single sentence what the $117 analyst believes that the $450 analyst does not, and whether the evidence to date favours one view over the other. That is a repeatable skill, and it applies to every high-growth, high-uncertainty name in your portfolio, not just this one.
This article is for informational purposes only and should not be considered financial advice. Investors should conduct their own research and consult with financial professionals before making investment decisions. Past performance does not guarantee future results. Financial projections are subject to market conditions and various risk factors. Several figures referenced here are reported estimates and remain unverified.