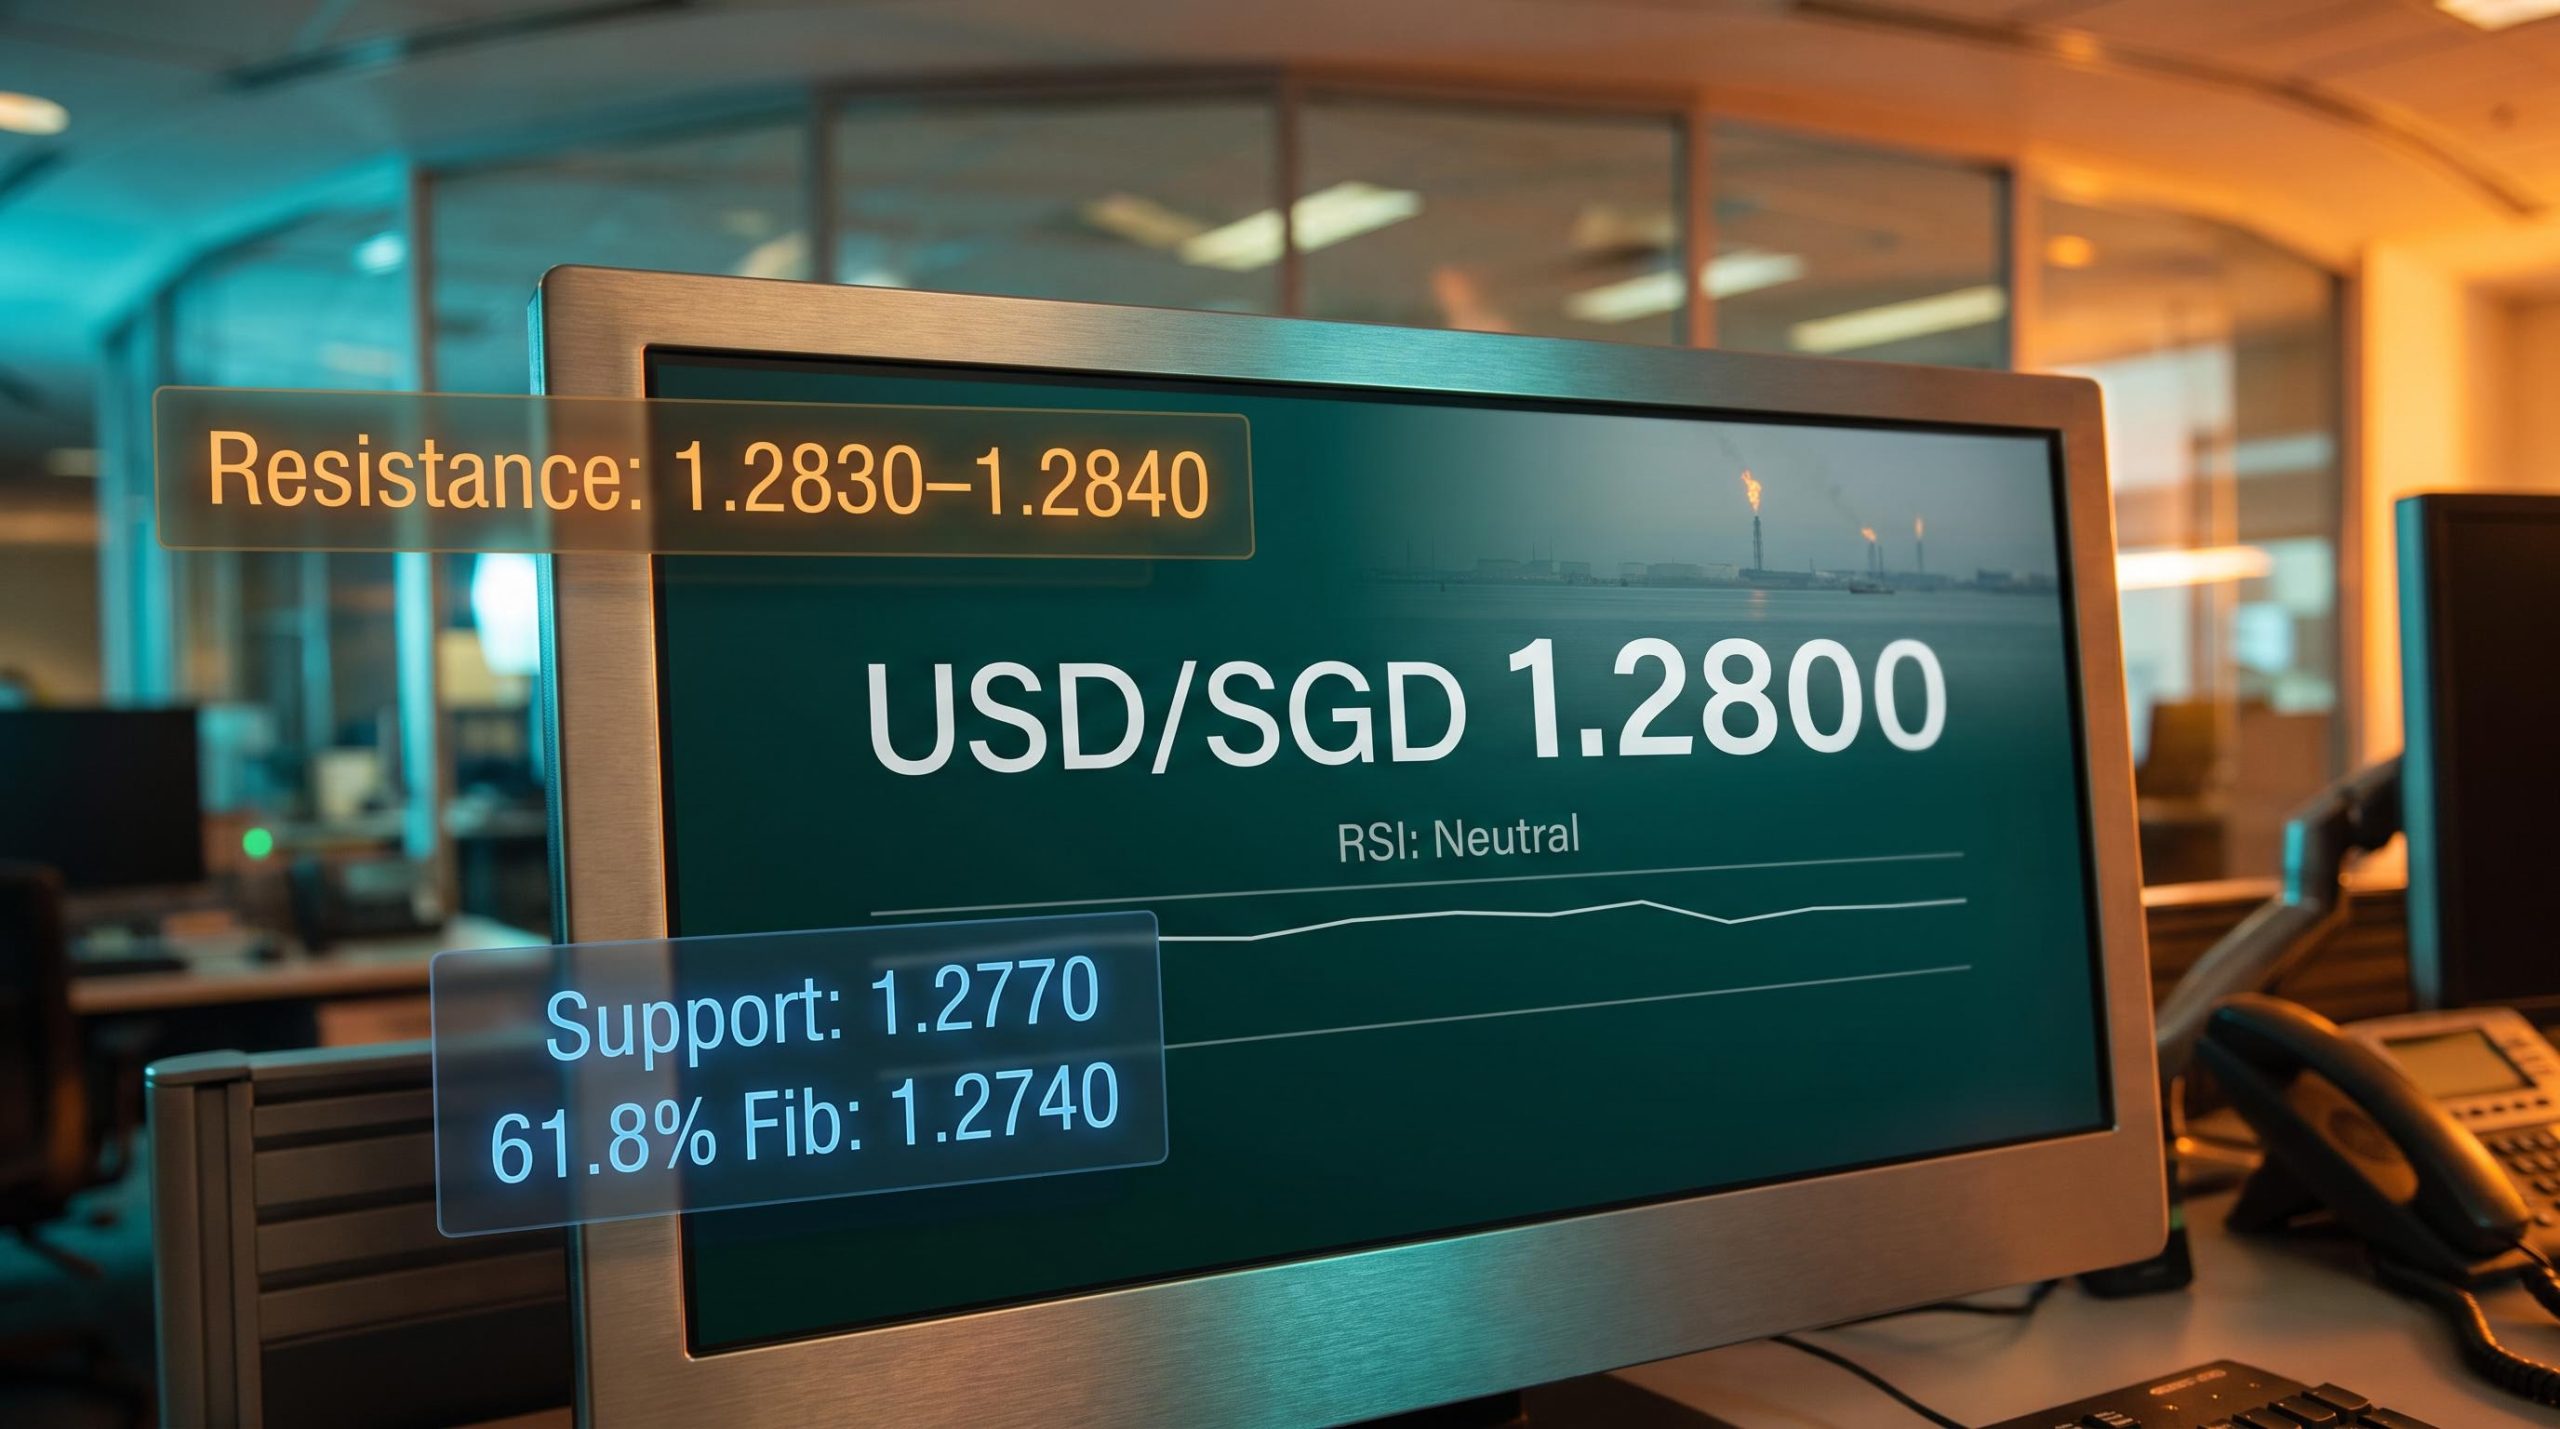
Softer US producer-price inflation arrived on 14 August 2026, and the standard playbook said the dollar should have weakened. It did not. USD/SGD held near 1.28, barely flinching at a data point that, on paper, reduced the case for further Federal Reserve tightening. That non-reaction is the most interesting signal in the pair right now.
The stalemate matters beyond a single currency cross. When a confirmed macro tailwind fails to move a price, it tells you something about what the market is actually pricing, and in this case, two forces of roughly equal strength are cancelling each other out. US disinflation is pulling the dollar lower. Middle East energy-supply risk is pulling it higher. The result is an unusually stable equilibrium that anyone watching Fed expectations, Asian FX, or oil-market positioning needs to understand.
This piece maps the specific forces holding the pair in place, the technical levels that define the range, and the conditions that would break the stalemate in either direction. Think of it as a decision framework: what to monitor, what levels confirm a move, and what the structural bias tells you about direction once the current standoff resolves.
Why soft US inflation data failed to push USD/SGD lower
The transmission mechanism should have been straightforward. When producer prices come in softer than expected, the chain of events usually runs in one direction:
- Softer PPI reduces the urgency for further Fed rate increases
- Lower rate expectations ease US Treasury yields
- A narrower yield advantage shrinks the dollar’s carry appeal relative to other currencies, including the Singapore dollar
That chain activated on 14 August. Treasury yields eased. Rate-hike expectations softened further. But USD/SGD returned no meaningful downward movement in response.
OCBC analysts Sim Moh Siong and Christopher Wong framed the dynamic clearly: markets had already shifted toward a dovish Fed path before this release, meaning the PPI print confirmed the prevailing expectation rather than changing it.
The absence of follow-through is itself the signal. Much of the disinflation narrative had been priced in over prior weeks of gradually softening data. When a macro tailwind that should weaken the dollar fails to do so, it tells you the market has already done the work. Chasing the next leg lower without a fresh catalyst is a positioning risk, not a trade setup. Upcoming US CPI and labour data are the next releases capable of either reinforcing the disinflation thesis or reviving residual tightening expectations, and those are the prints worth waiting for.
The US disinflation trajectory behind the current macro case for dollar weakness has a specific structure: the 1.3 percentage-point gap between headline and core CPI in May 2026 reflects an energy-driven uptick rather than a demand-fuelled spiral, and the structural conditions that sustained the 2021-2022 inflation surge are largely absent, giving the disinflation narrative durable rather than fragile foundations.
When big ASX news breaks, our subscribers know first
How geopolitical risk is propping up the dollar
While macro data pulled in one direction, identifiable geopolitical events pushed back with equal force. This is not abstract “risk sentiment.” It is specific, named incidents creating real energy-supply uncertainty that flows directly into dollar demand.
The two catalysts holding the safe-haven bid in place:
- Strikes by Houthi forces targeting infrastructure at Saudi Aramco’s Jazan refinery complex in late July and early August 2026, causing damage and forcing temporary shutdowns. These attacks raised immediate concerns about regional energy-supply reliability.
- The US government indicating its capacity to keep a naval blockade of Iranian ports in place without a defined end point, adding a second layer of supply-disruption risk that markets cannot easily dismiss.
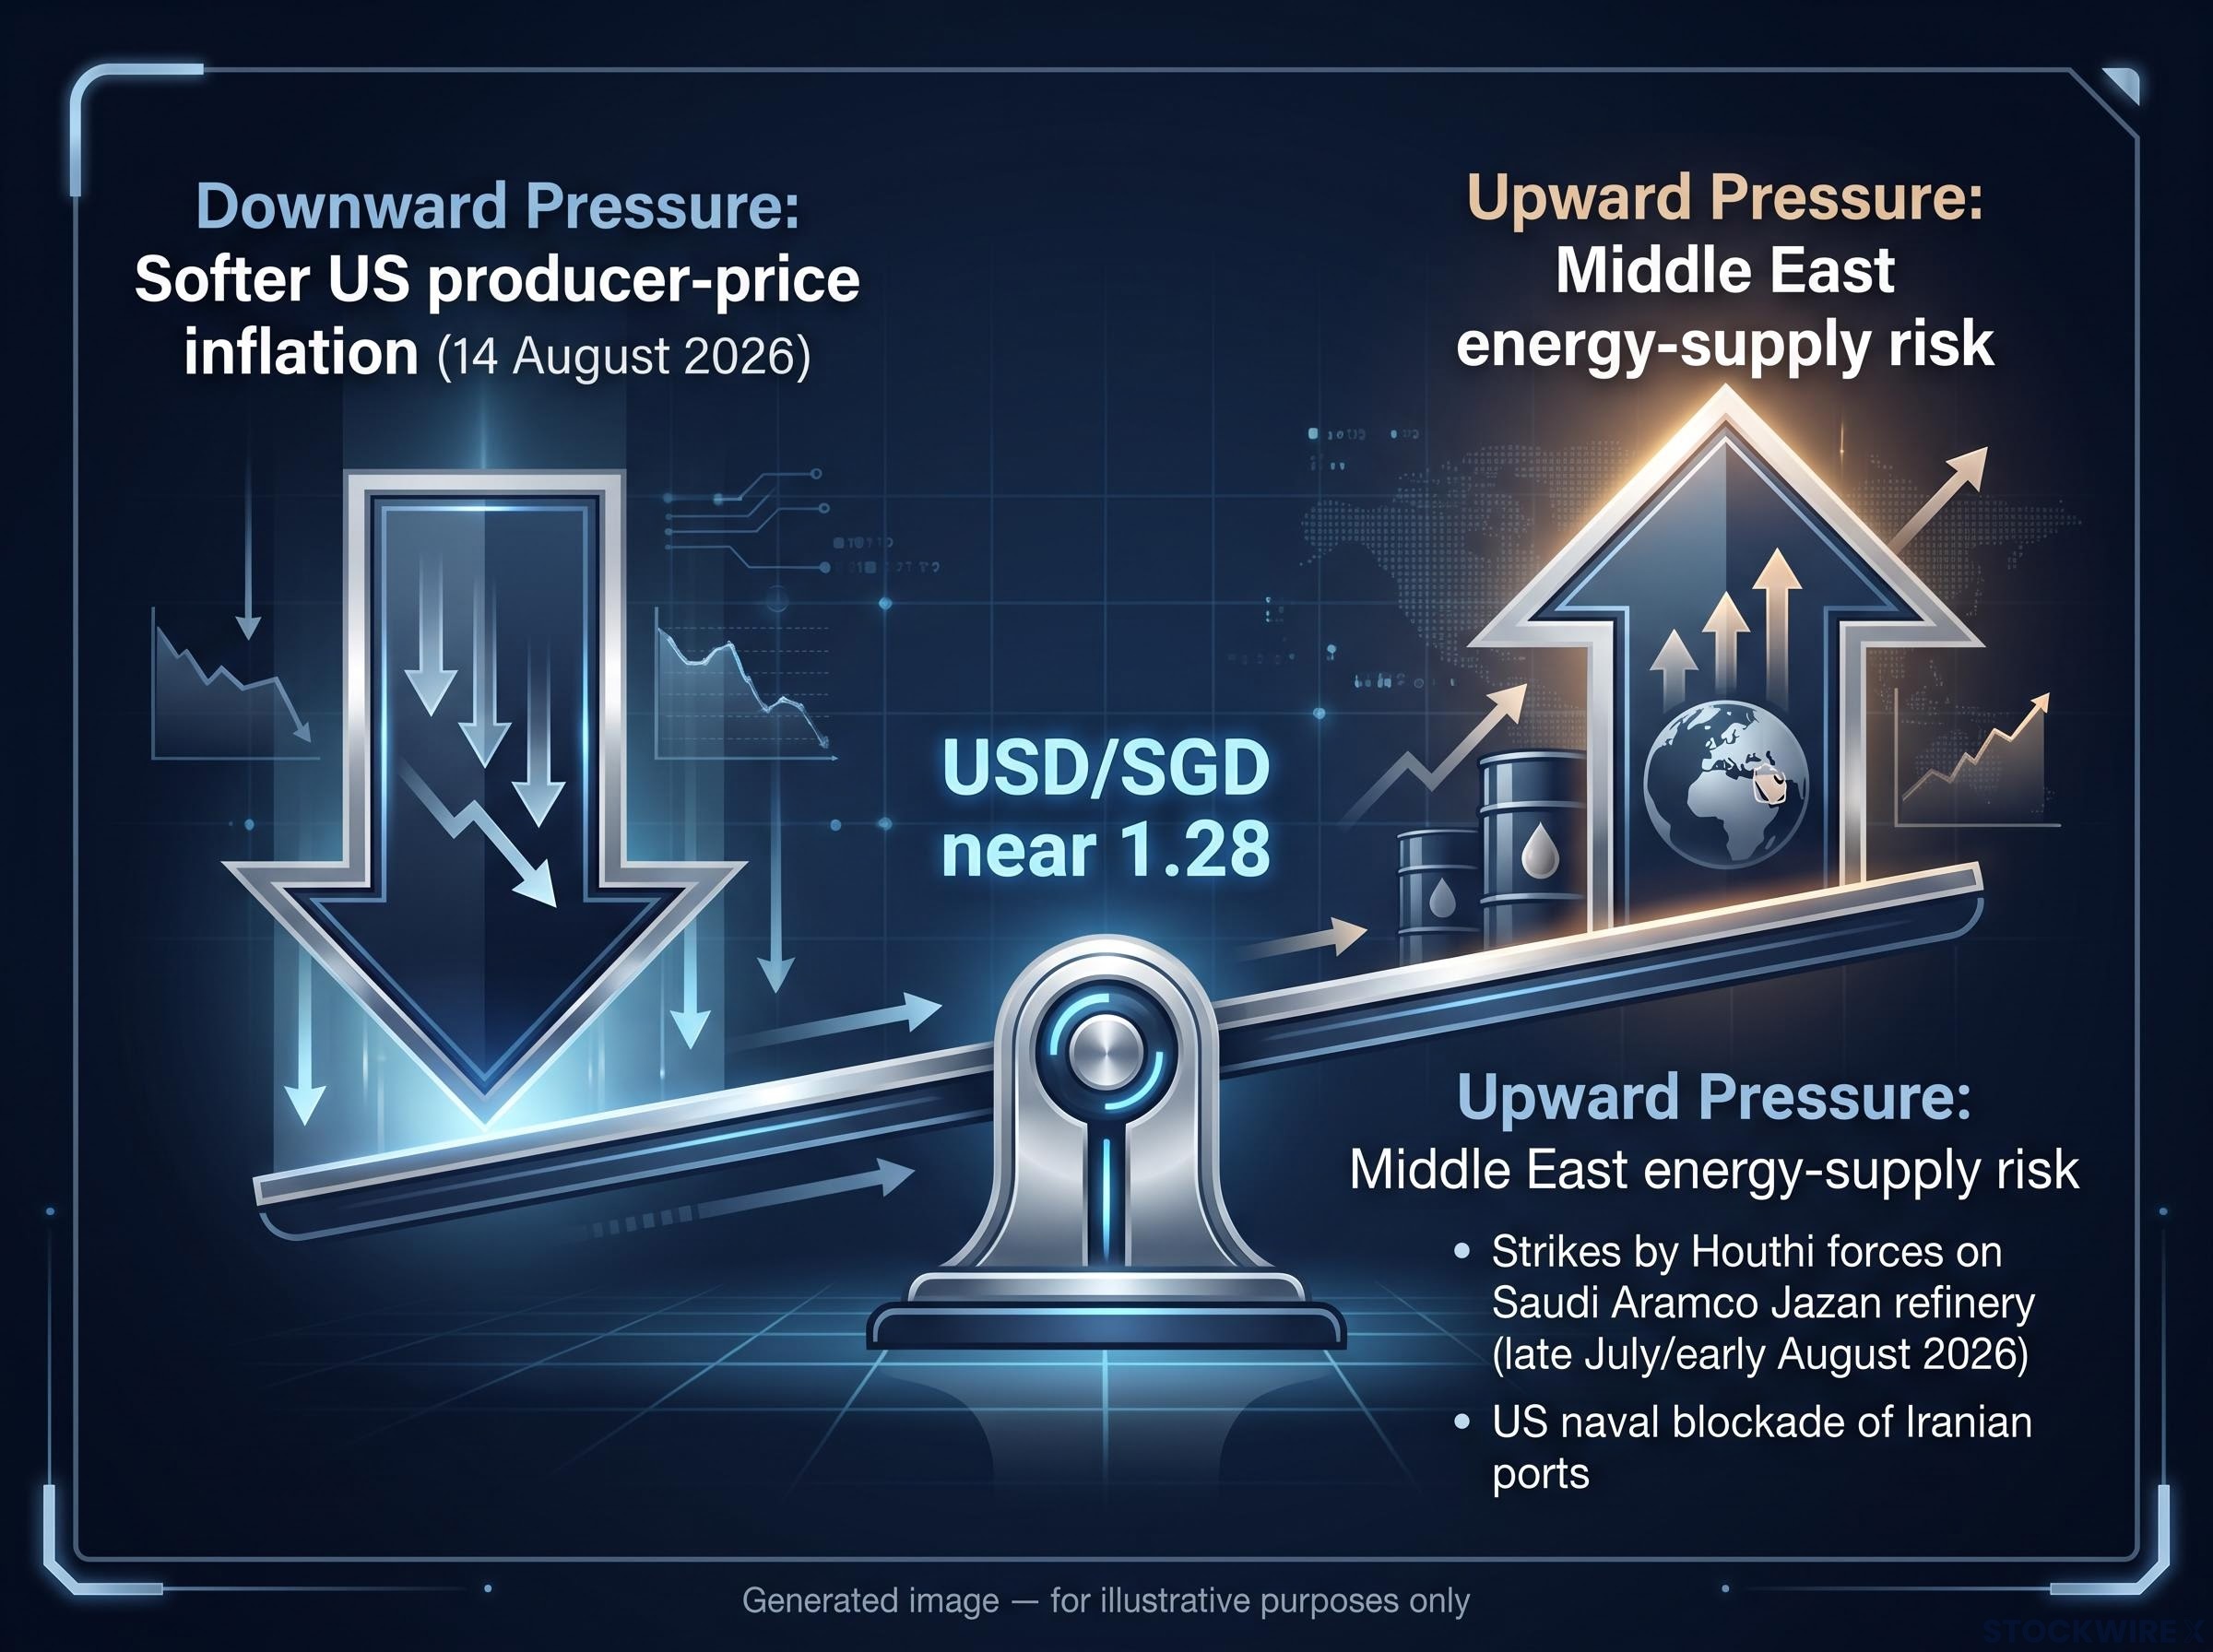
Both events feed the same mechanism. Energy-supply risk raises global uncertainty, which increases demand for deep-liquidity reserve assets. The dollar is the primary beneficiary of that demand, and it is absorbing buying pressure that would otherwise be absent given the macro backdrop.
The scale of energy supply disruption risk behind the current safe-haven dollar bid extends well beyond near-term headline noise: Hormuz flows have fallen below 45% of pre-war levels, Goldman Sachs places $120 Brent in Q4 2026 as a central estimate, and OPEC spare capacity sits near 0.5 million barrels per day, leaving almost no buffer if the Jazan or Iranian port situation deteriorates further.
Weekend positioning compounds the effect
With headlines still fluid, traders are reluctant to hold aggressive short-dollar positions into a two-day news gap. That caution is particularly acute against Asian FX, where liquidity thins over the weekend. OCBC analysts Sim Moh Siong and Christopher Wong have noted that the prevailing geopolitical backdrop is weighing on traders’ willingness to press dollar shorts, with the approach of the weekend amplifying that hesitancy.
For your positioning, this means that even a convincing macro case for dollar weakness can be neutralised by a single escalating geopolitical headline. Timing any USD/SGD short requires monitoring energy-market news alongside CPI prints, not one without the other.
Reading the technical map for USD/SGD
The 1.2770-1.2840 range is not random. It is defined by a set of technical levels that together explain why neither buyers nor sellers have been able to force a resolution.
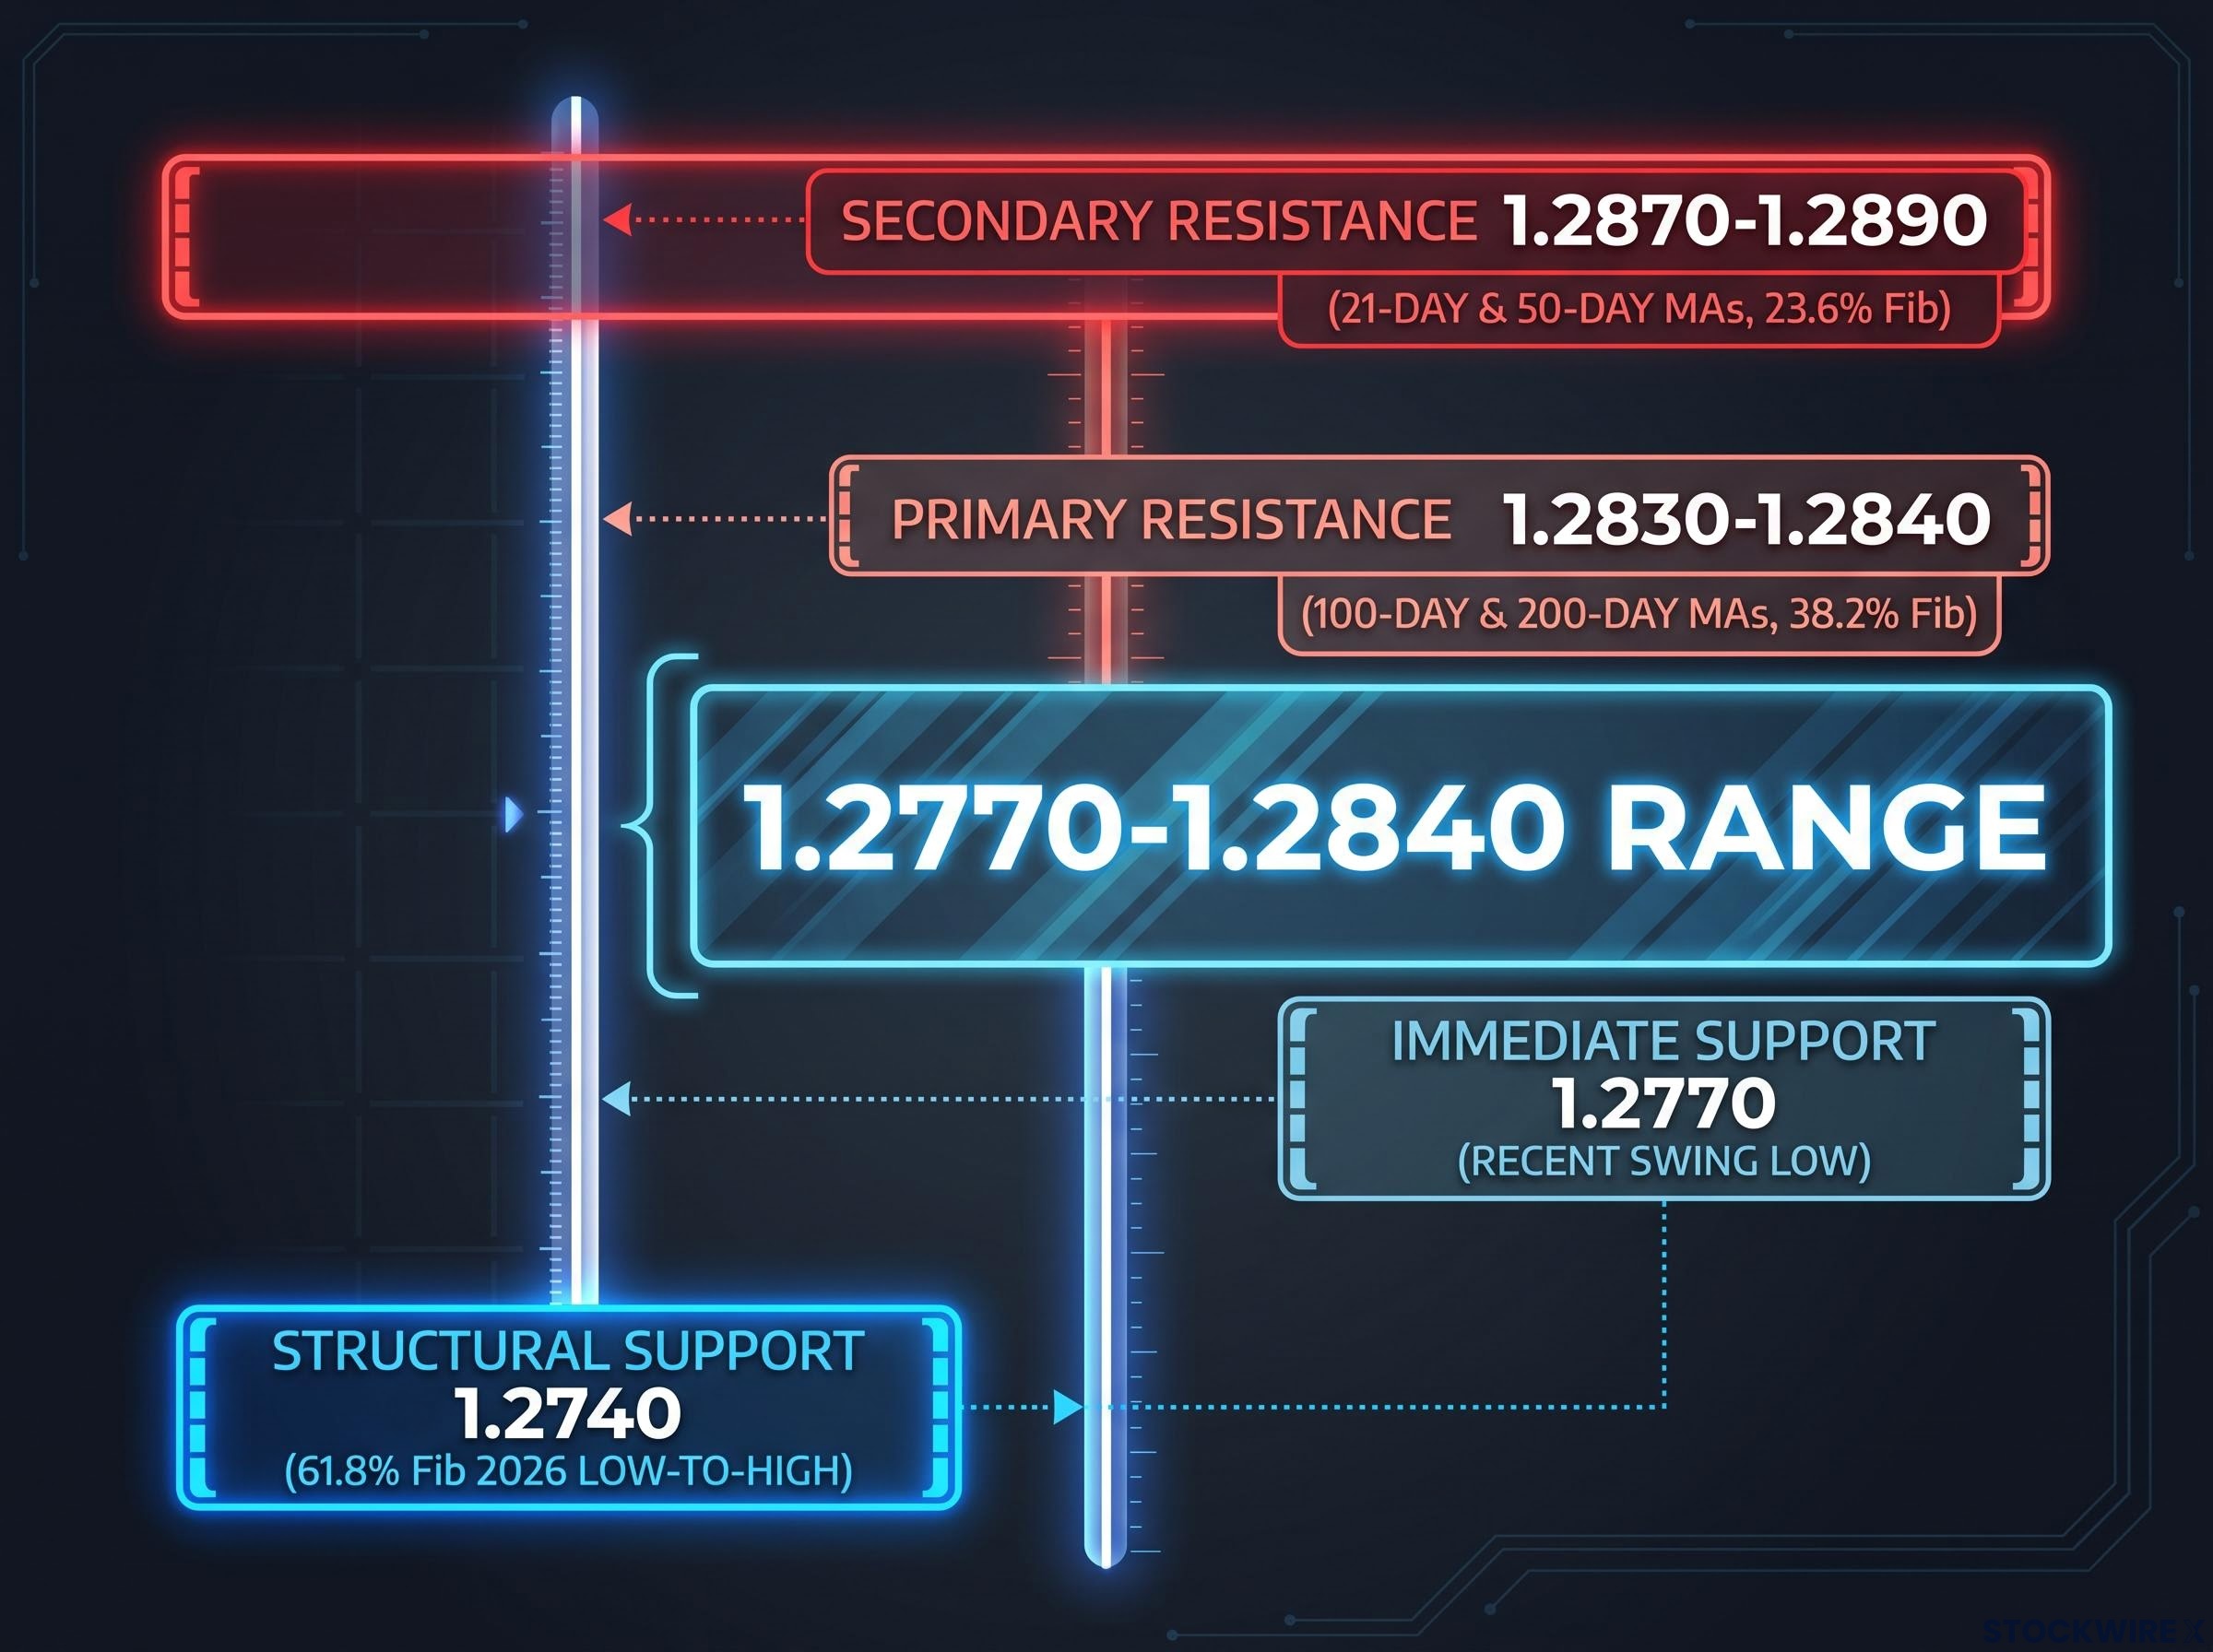
| Level | Price | Indicator basis | Directional signal |
|---|---|---|---|
| Immediate support | 1.2770 | Recent swing low | Daily close below signals renewed bearish momentum |
| Structural support | 1.2740 | 61.8% Fibonacci retracement (2026 low-to-high) | Break confirms sustained downtrend and validates structural bearish case |
| Primary resistance | 1.2830-1.2840 | 100-day and 200-day MAs plus 38.2% Fibonacci retracement | Sustained break above shifts bias from bearish toward neutral |
| Secondary resistance | 1.2870-1.2890 | 21-day and 50-day MAs plus 23.6% Fibonacci retracement | Move into this zone indicates safe-haven dynamics overpowering macro thesis |
The confluence at 1.2830-1.2840 deserves particular attention. When two major moving averages (the 100-day and 200-day) intersect with a Fibonacci retracement level at the same price, that zone tends to absorb upside attempts repeatedly until a genuine shift in the underlying forces breaks through it. So far, it has held as a ceiling.
The confluence of moving averages and Fibonacci retracements at 1.2830-1.2840 follows the same logic that structured forex technical analysis applies across any currency pair: when multiple independent indicator types converge at the same price zone, that zone absorbs directional attempts repeatedly until the underlying drivers shift, not until price alone tests it enough times.
On the downside, 1.2770 is the first meaningful line sellers need to clear. A daily close below it does not end the story on its own, but it opens the path to 1.2740, where the 61.8% Fibonacci retracement sits as structural support.
The daily RSI is flat, neither overbought nor oversold, confirming that the market is genuinely balanced rather than coiling for a breakout. This is sideways trade, not accumulation of directional conviction.
That RSI reading tells you a patient, level-defined approach to positioning is more appropriate here than momentum-based entry. The market is not signalling where it wants to go next; it is signalling that it has not decided. Technical analysis attributed to OCBC analysts Sim Moh Siong and Christopher Wong.
What drives USD/SGD when macro and geopolitics collide
What you are watching in USD/SGD right now is a live example of a pattern that recurs across currency markets: two equally strong but opposing forces acting on a pair simultaneously, producing range consolidation rather than trending behaviour.
Currency pairs are always caught between competing drivers. On one side sit macro fundamentals: rate differentials, inflation trajectories, and relative growth. These are the forces that create trends over weeks and months. On the other side sit safe-haven flows: risk aversion, geopolitical uncertainty, and liquidity preference. These forces tend to be episodic but can be powerful enough to stall or reverse a macro trend entirely.
The Singapore dollar adds a specific layer. It tends to track global risk sentiment alongside its own monetary policy framework, making it sensitive to both US macro shifts and regional geopolitical developments in a way that some other Asian currencies are not. When US disinflation pulls the dollar weaker and Middle East risk simultaneously pulls it stronger, the SGD absorbs both forces, and the pair stalls.
Recognising this pattern when it appears gives you a reusable framework. Here is how to identify a macro-geopolitical stalemate:
- Confirm the macro signal. Is there a clear, data-supported case for one direction? (In this case, softer PPI supporting a weaker dollar.)
- Identify the countervailing geopolitical force. Is there a specific, named risk creating demand in the opposite direction? (Jazan strikes, naval blockade.)
- Check whether price action confirms the offset. Is the pair range-bound with a flat RSI rather than trending? (1.2770-1.2840, flat RSI: confirmed.)
When all three conditions are met, range-bound price action is not a mystery. It is a predictable structural outcome. The signal to act comes when one force clearly dominates, not before.
Scenario map: the conditions that break the 1.28 stalemate
Both scenarios deserve equal analytical weight. The asymmetry emerges from the specific conditions each one requires, not from a directional preference announced in advance.
| Scenario | Triggering conditions | Target level or implication |
|---|---|---|
| USD/SGD lower | US CPI and labour data reinforce disinflation; Middle East tensions de-escalate; daily close below 1.2770 followed by break of 1.2740 | Confirms structural bearish case; opens room for sustained downtrend |
| USD/SGD higher | Regional security deteriorates further; US data surprises to the upside reviving “higher for longer” pricing; pair sustains above 1.2840 | Targets 1.2870-1.2890; indicates safe-haven dynamics overpowering macro thesis |
The downside scenario requires three things to align: continued soft data, geopolitical de-escalation, and a technical break through support. The upside scenario also requires three: worsening regional risk, a data surprise, and a sustained move above resistance.
The Hormuz risk premium is structurally slow to unwind: the IEA projects a two-year supply chain recovery timeline even under a best-case resolution, meaning any geopolitical de-escalation that would allow the macro disinflation force to dominate USD/SGD is unlikely to arrive cleanly or quickly.
Overall tactical framing: Structurally bearish USD/SGD, tactically neutral to slightly bearish while 1.2770-1.2840 holds. (Analysis attributed to OCBC analysts Sim Moh Siong and Christopher Wong.)
The structural case favours USD/SGD lower over the medium term as US rate differentials narrow. But the tactical case requires waiting for the macro or geopolitical force to decisively win the current standoff before acting on that bias. Anticipating a breakout that data alone cannot yet justify carries meaningful positioning risk.
Past performance does not guarantee future results. Financial projections are subject to market conditions and various risk factors.
What to watch before the next directional move confirms
The next clear USD/SGD signal will come from the intersection of one macro or geopolitical development with a confirming price-action break. Here is the watch list, ranked by priority:
- US CPI and labour data. These are the highest-priority catalysts. A further softening validates the disinflation narrative and removes a pillar of dollar support. An upside surprise revives residual Fed tightening expectations and strengthens the dollar’s carry advantage. Either outcome shifts the macro side of the equation decisively.
- Middle East geopolitical developments. Further strikes on the Jazan refinery complex or escalation involving Iranian ports would sustain the dollar’s safe-haven premium. Meaningful de-escalation, or a period of quiet, would allow the macro force to operate without a counterweight.
- Price-action confirmation at key technical levels. A daily close below 1.2770 (and subsequent test of 1.2740) confirms the bearish case. A sustained move above 1.2840 confirms the upside scenario. Acting before one of these levels breaks, alongside a supporting macro or geopolitical shift, carries positioning risk that the current equilibrium does not compensate for.
The signal comes from the intersection of these variables. Monitoring one without the others gives you an incomplete picture.
Patience as the position: what the current stalemate actually tells you
USD/SGD near 1.28 is not directionless. It is directionally contested, and that distinction shapes how you should frame your monitoring approach. Two forces of roughly equal strength have produced a range that reflects genuine market balance, not indecision. The structural medium-term bias remains bearish as US rate differentials narrow, but that bias requires a catalyst to express itself rather than a forecast to time.
The next US CPI print and any significant Middle East development are the two events most likely to break the current equilibrium. Those are the moments to reassess the pair’s direction, and until one arrives with sufficient force to resolve the standoff, the range itself is the message. Sometimes the most informed position is the one that waits for confirmation rather than anticipating it.
This article is for informational purposes only and should not be considered financial advice. Investors should conduct their own research and consult with financial professionals before making investment decisions.