US Inflation Hits 4.2% but Core Data Tell a Calmer Story
11 hrs ago
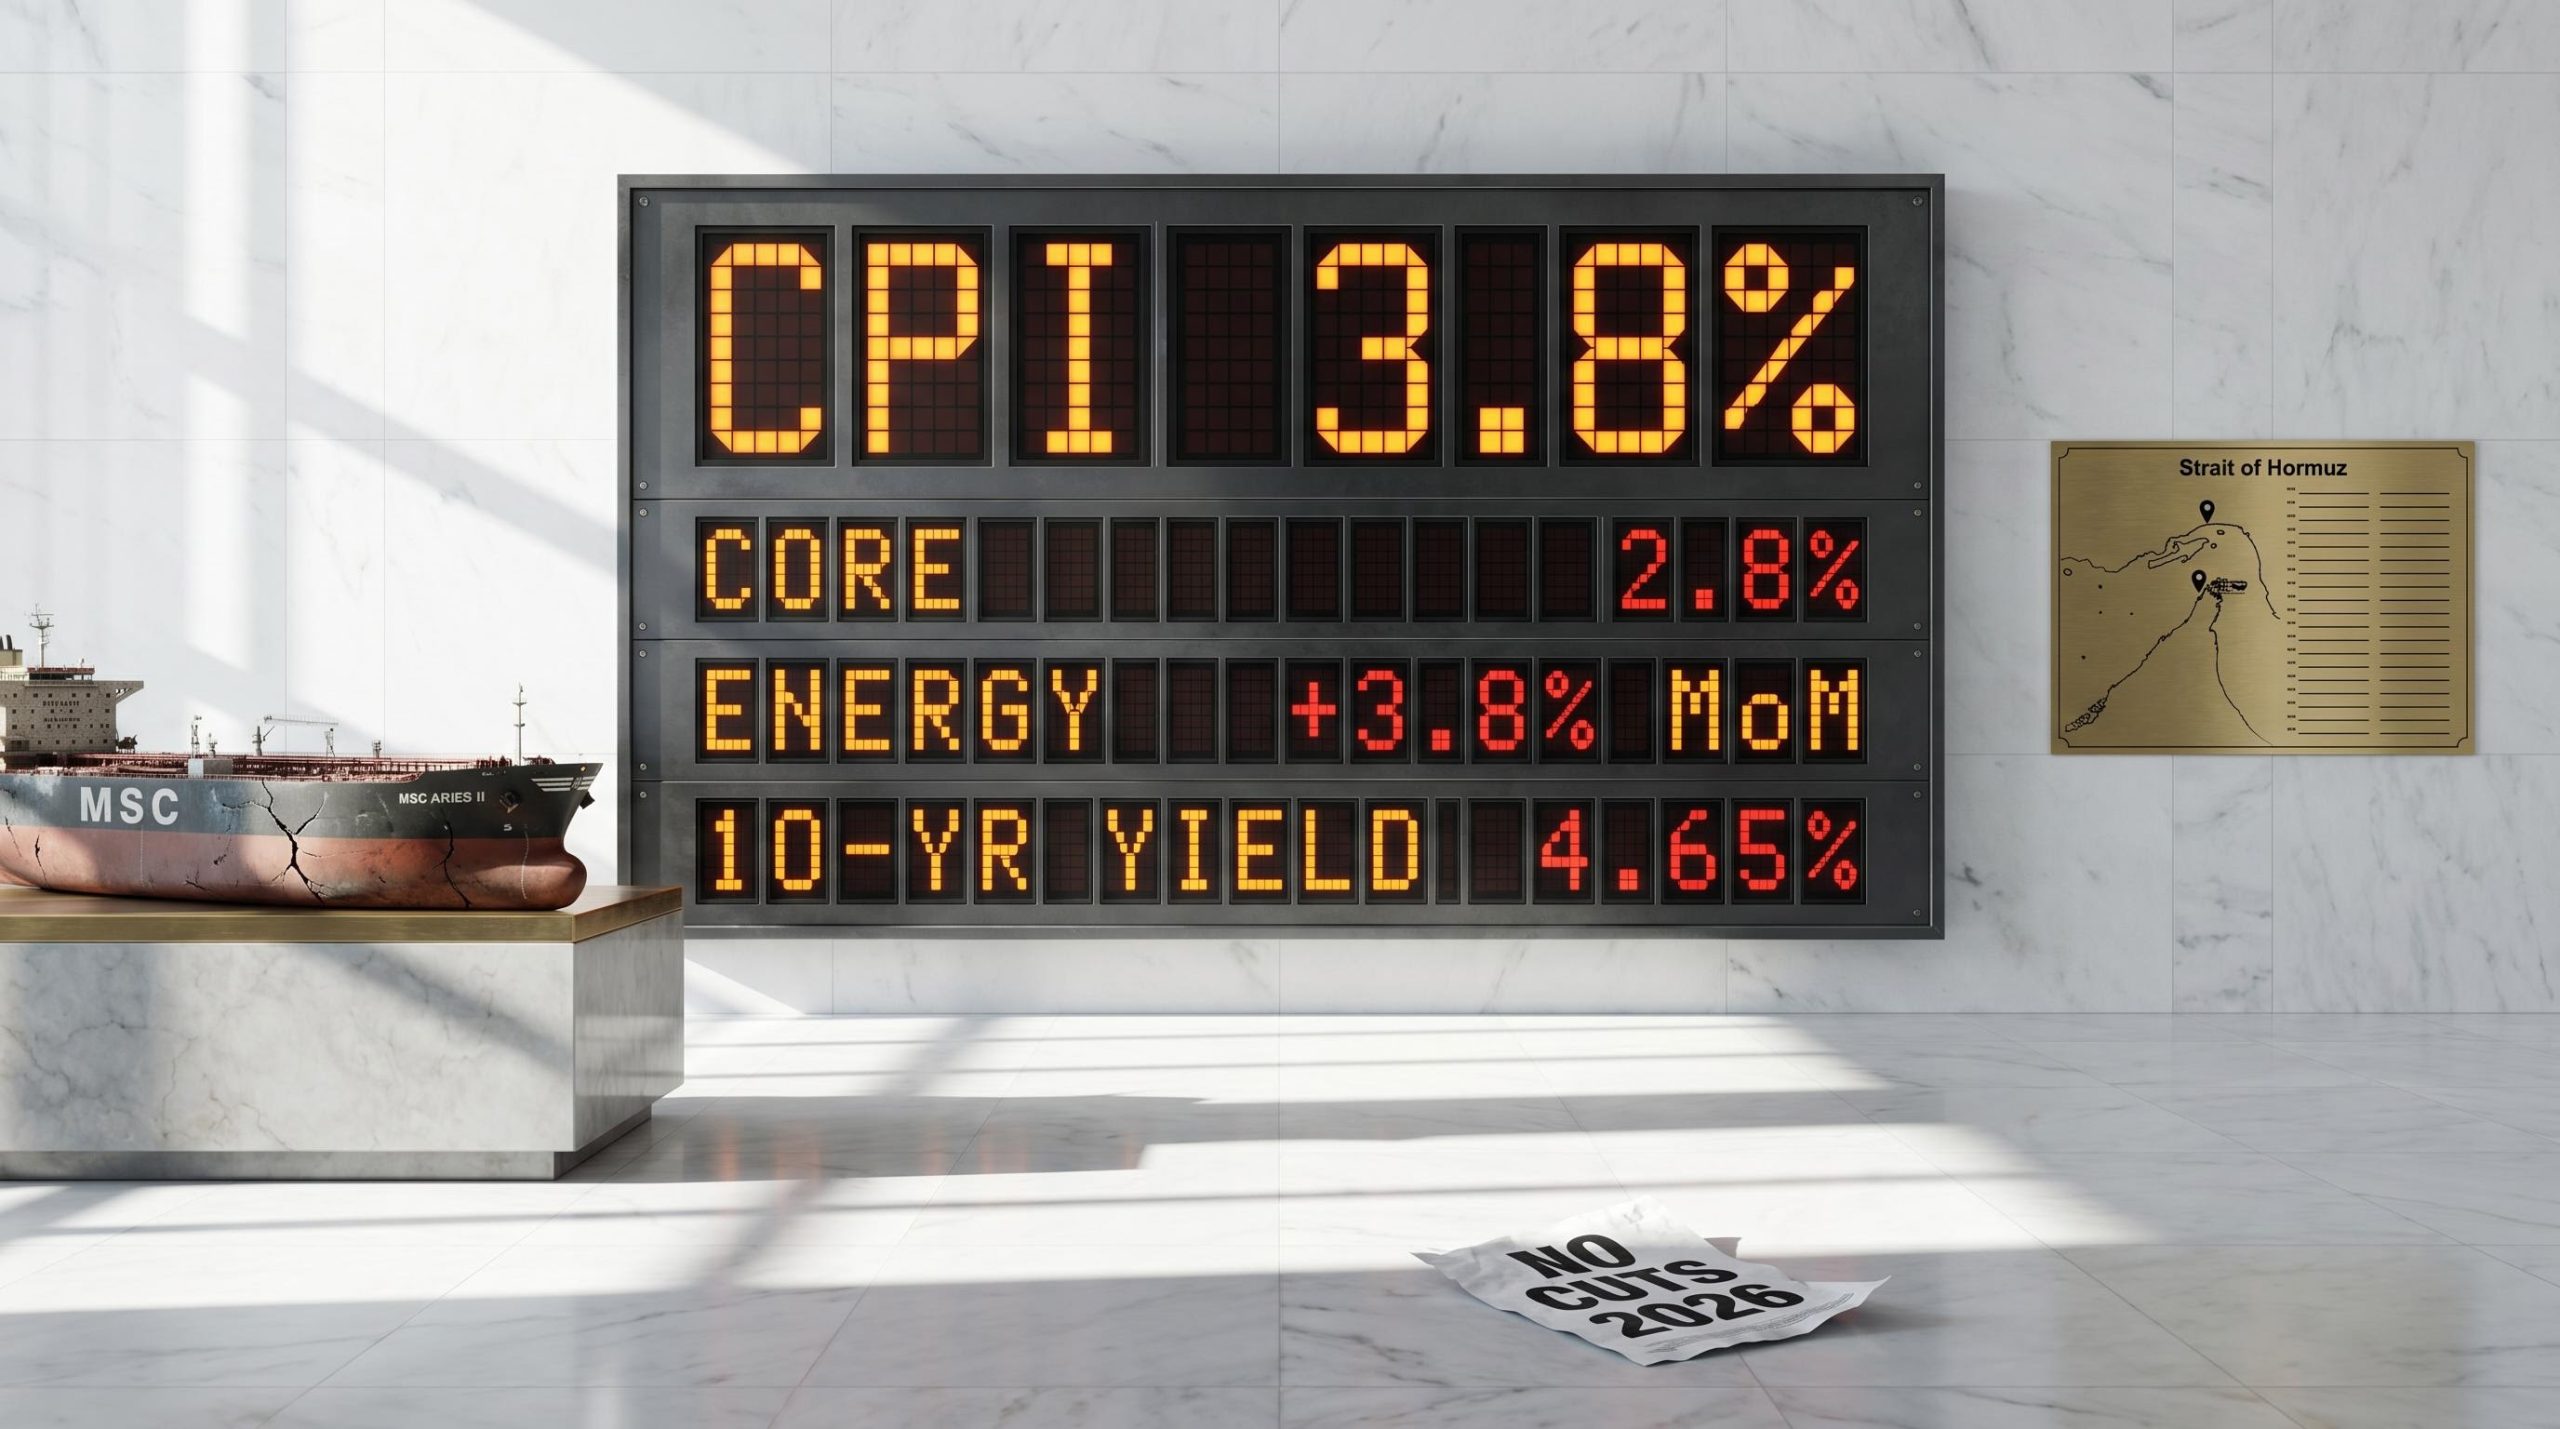
April 2026 headline Consumer Price Index (CPI) came in at 3.8% year-on-year, the hottest US inflation report since May 2023, and it arrived at the worst possible moment. The Federal Reserve is mid-leadership transition, with Kevin Warsh’s confirmation hearing set for 20 May, and the print did not merely delay rate cuts. It materially shifted the probability distribution toward hikes. JPMorgan, Goldman Sachs, Morgan Stanley, and Bank of America have all revised their forecasts in the same direction: zero cuts in 2026, with meaningful odds now assigned to a December increase. What follows breaks down the composition of the miss, the geopolitical shock behind it, the Fed repricing across every major institution, the multi-asset market response, and the data calendar that will determine whether this hawkish consensus hardens or cracks.
The headline miss looks narrow on the surface: 3.8% year-on-year against a 3.7% consensus. The monthly figure told a sharper story: 0.6%, well above expectations.
Energy drove the headline overshoot, but the core readings removed any option to dismiss this as a single-category distortion. Shelter costs accelerated at 0.6% month-on-month, and airline fares, up 20.7% year-on-year, reflected fuel cost pass-through reaching service categories that feed directly into core inflation.

Real average hourly earnings fell 0.5% in April and sit 0.3% lower year-on-year, meaning consumers are absorbing higher prices with shrinking purchasing power.
Dallas Fed President Lorie Logan called the print an “unwelcome reacceleration,” signalling a pause on any further discussion of easing.
The breadth of the overshoot is the detail that matters most. A narrow energy-driven miss could be dismissed. A miss where energy, shelter, and services all accelerated simultaneously cannot.
The energy component did not materialise in a vacuum. It traces directly to the Strait of Hormuz, where daily vessel transits have collapsed from approximately 70 ships to 2-5, and where Iranian forces seized a second tanker, the MSC Aries II, on 11 May.
The projected pass-through from the Hormuz closure on inflation was already visible in pre-release estimates, with Bank of America modelling a full percentage-point addition to headline CPI from the prolonged supply disruption, and gasoline at $4.50 per gallon feeding directly into consumer price levels before the April print was even published.
Brent crude closed at $92/bbl, up 8% week-over-week. West Texas Intermediate (WTI) hit $88/bbl, up 7% week-over-week. War risk insurance premiums have surged 200%, and total US war expenditure has reached $29 billion, up from the $25 billion Pentagon estimate published two weeks prior.
The critical variable for whether this inflation episode persists or fades is how long the disruption runs. Oil price forecasts now diverge sharply on that question.
| Forecast Source | Brent Crude H2 2026 Estimate | Key Assumption |
|---|---|---|
| Goldman Sachs | $100/bbl average | Iran disruption persists through H2 |
| JPMorgan | $95+ | Hormuz partial disruption continues |
| EIA | $106 May-June, declining to $89 Q4 | Reopening by late May |
The gap between those forecasts is the gap between an inflation spike that fades and one that forces the Fed’s hand.
The oil risk premium embedded in Brent crude is not simply a geopolitical spike that reverses on a ceasefire announcement; the IEA projects a two-year supply chain recovery timeline even under a best-case resolution, meaning the inflation pressure the Fed is now pricing does not have a clean off-switch tied to a diplomatic outcome.
Before the CPI release, markets still priced some residual possibility of 2026 easing. That pricing is gone.
CME FedWatch now shows near-zero probability of any 2026 rate cut and approximately 30% odds of a December 2026 hike. The shift was not driven by a single outlier call. Every major institution moved in the same direction within hours.
| Institution | 2026 Rate Call | Next Cut Timing |
|---|---|---|
| Goldman Sachs | No cuts; 5.25-5.50% terminal | Into 2027 |
| JPMorgan | 25bps hike possible (30% odds) | No cuts 2026 |
| Morgan Stanley | 35% hike odds | Q1 2027 earliest |
| Bank of America | No cuts | H2 2027 |
| Oxford Economics | 50bps hikes if energy persists | Not forecasted |
Oxford Economics declared: “Powell put is dead,” forecasting 50bps of hikes in H2 2026 if energy prices remain elevated.
The hawkish consensus extends inside the Fed itself. NY Fed President John Williams said “April data raises bar for cuts.” Cleveland Fed President Loretta Mester stated the “energy surge is not transitory amid Hormuz tensions.” No dovish pushback has emerged from any Fed official as of the session close.
The distance between last week’s base case and today’s is not incremental. The question has shifted from “when do cuts begin?” to “do hikes become necessary?”
The connection between a shipping lane in the Persian Gulf and a Federal Reserve interest rate decision runs through a specific chain of cause and effect.
The Fed cannot simply “look through” this energy shock the way some argued it should have during the 2021-2022 episode. The difference is that core inflation is simultaneously elevated at 2.8% year-on-year, with shelter and airfares accelerating. When core categories confirm the pressure that energy started, the entire CPI basket is running well above the Fed’s 2% target, and waiting risks repeating the delayed response that proved costly four years ago.
“Higher for longer” means the current 5.25-5.50% federal funds rate stays in place for an extended period, or moves higher, with direct consequences for borrowing costs across the economy.
The Treasury market transmitted the CPI print to every other asset class. The 10-year yield climbed 35 basis points from 4.30% to 4.65%, and that single move repriced equities, credit, and currencies in a matter of hours.
The 2-year yield rose 28 basis points to 4.92%. The 30-year yield hit a 4.75% intraday high.
The 30-year Treasury yield reached a 4.75% intraday high during the session, a level that had not been seen since the last inflation scare.
The yield curve steepened 7 basis points, reflecting the market’s bet that the Fed will need to hold restrictive policy deeper into the cycle.
| Asset Class | Move | Direction |
|---|---|---|
| 10-year Treasury yield | +35bps to 4.65% | Higher |
| S&P 500 | -0.16% settled; -1.00% intraday | Lower |
| Nasdaq 100 futures | -2.6% | Lower |
| DXY dollar index | +1.4% to 106.8 | Higher |
| High-yield spreads | +45bps to 410bps | Wider |
Technology and semiconductors absorbed the deepest equity losses. The Nasdaq Composite fell to session lows. A semiconductor ETF dropped 3.15%, with Intel down 7%, Micron down 4%, and CoreWeave down 6%. High-duration growth stocks are the most sensitive to rising discount rates, making them the first casualty when yields surge.
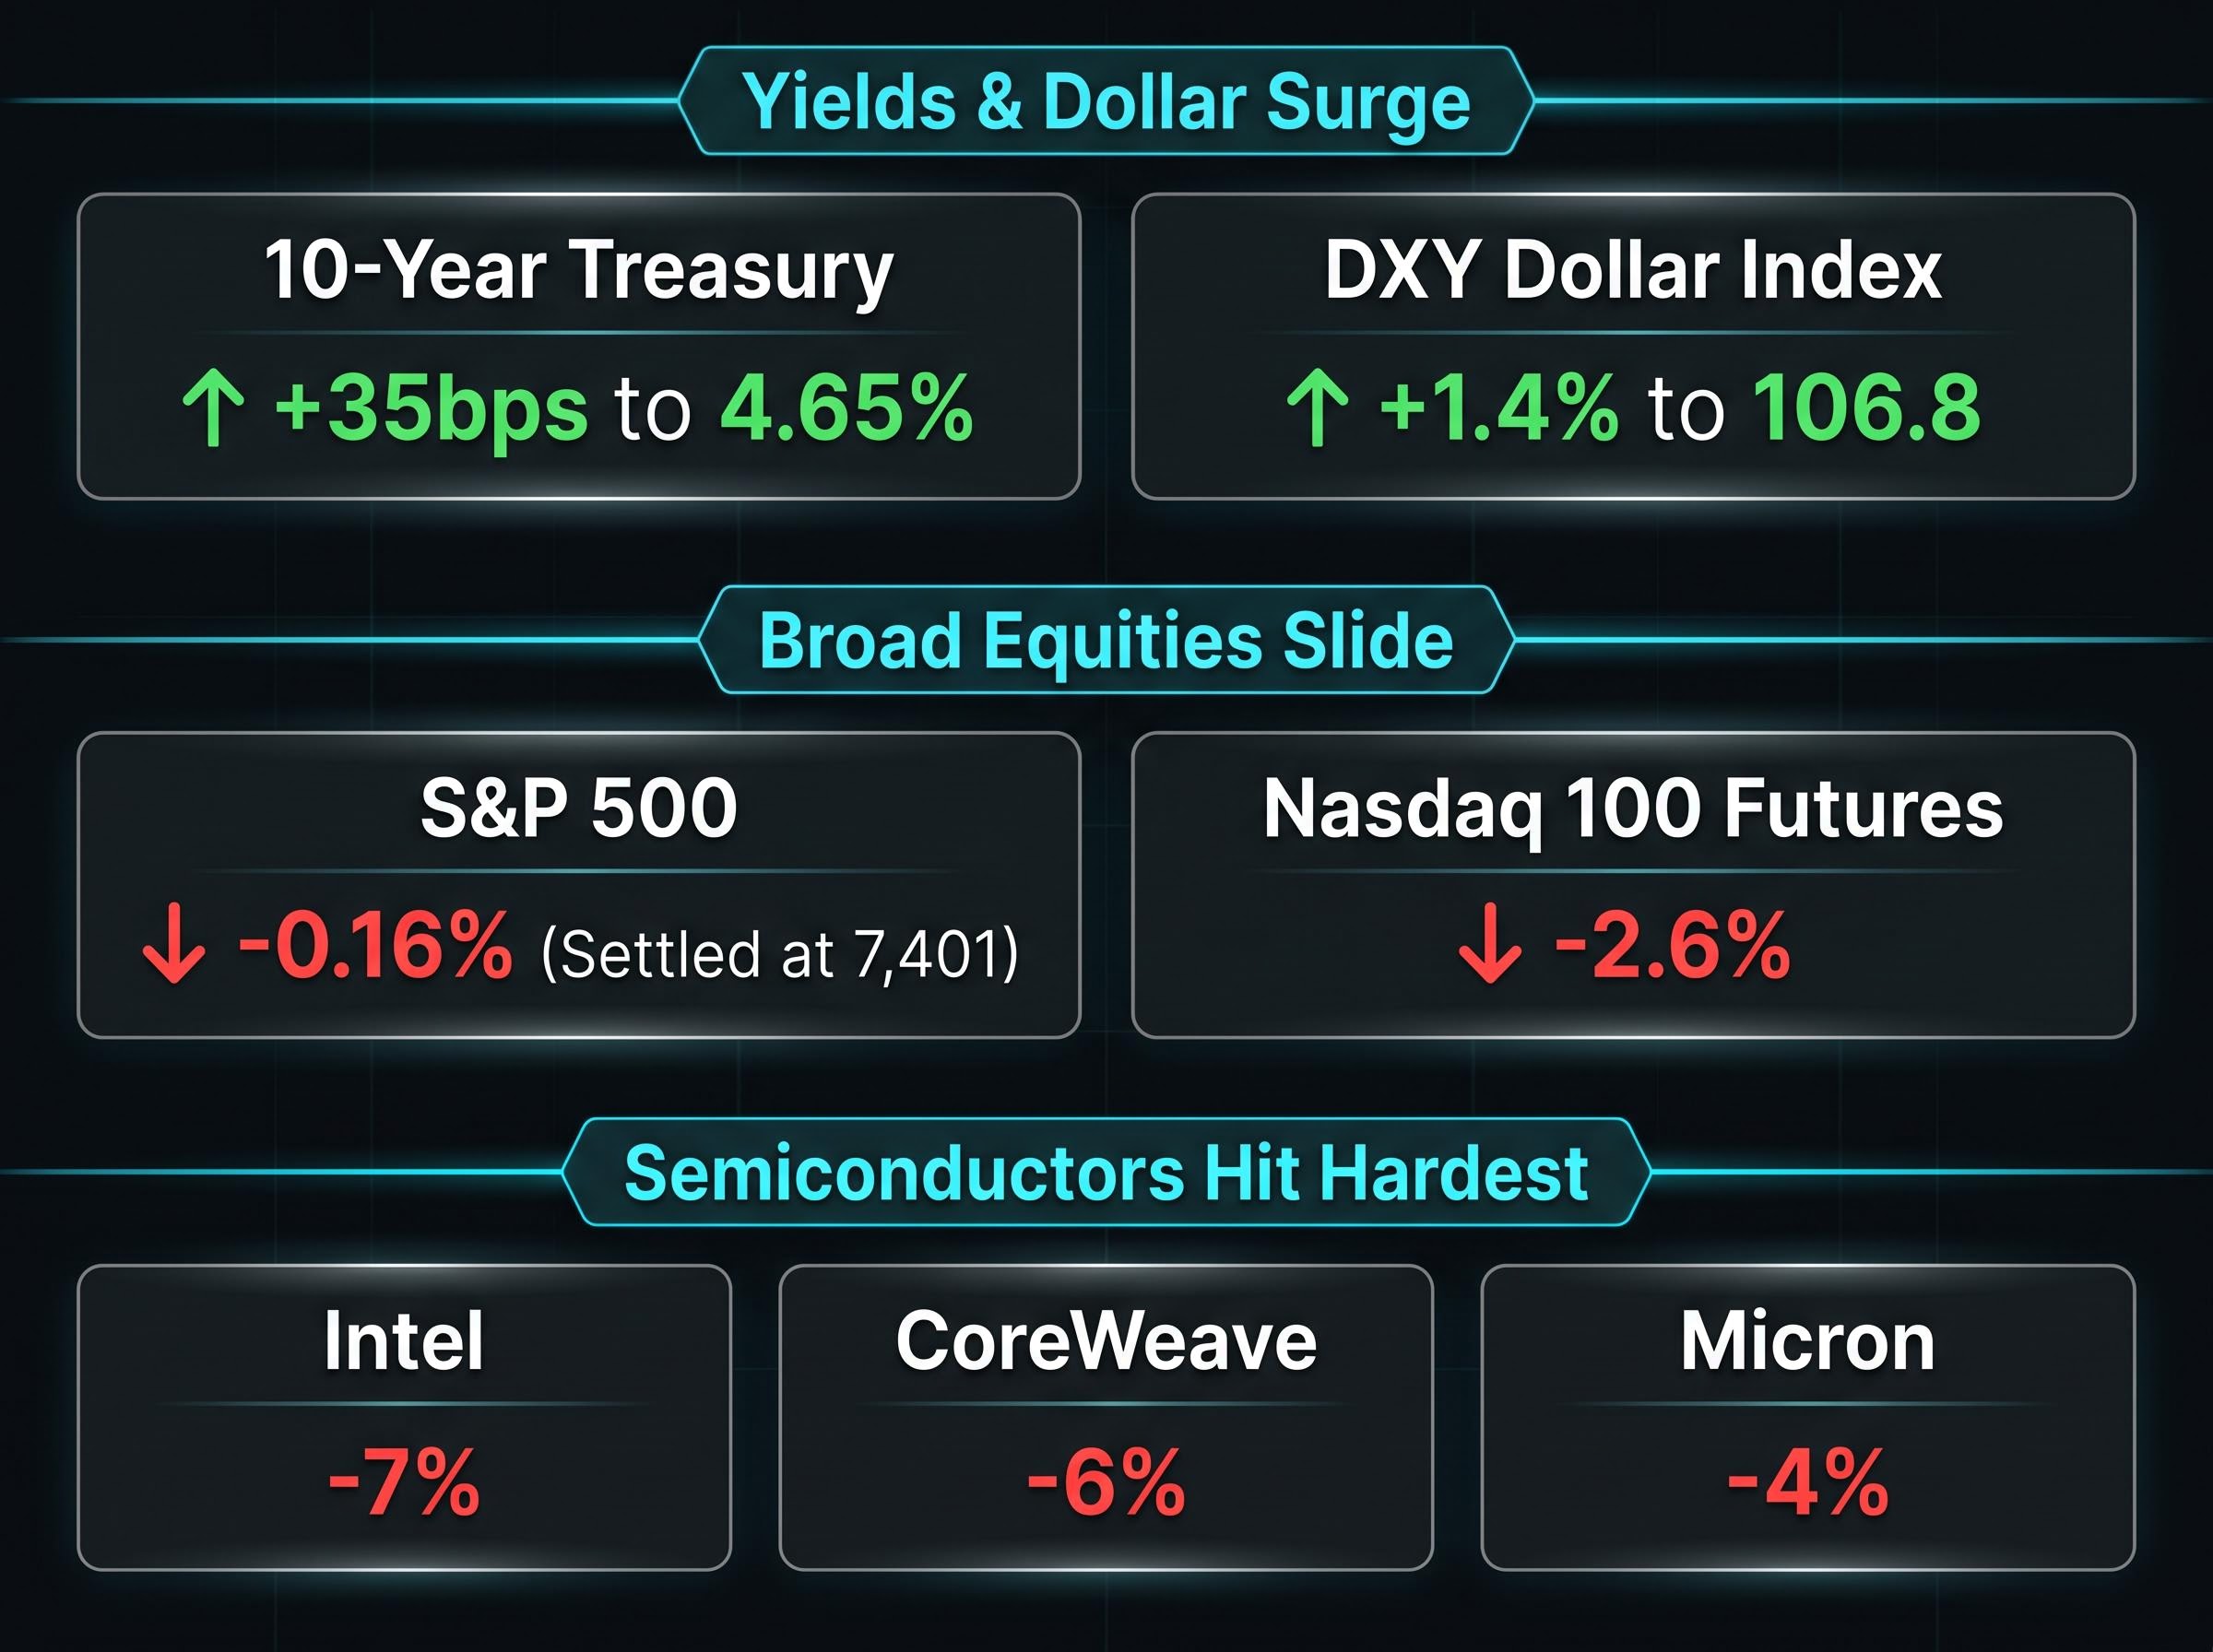
The S&P 500 settled at 7,401, down just 0.16%, but only after recovering from a 1.00% intraday decline. The energy sector gained 3%. The VIX spiked to 22.5 before settling at 17.99.
The DXY dollar index surged 1.4% to 106.8, its strongest level since March 2026. Investment-grade corporate spreads widened 15 basis points. Every signal pointed the same direction: a broad, systemic repricing for higher rates.
A Treasury yield decomposition by Wolfe Research attributes only 19 of the 40 basis points in the recent surge to the Iran geopolitical shock, with the remaining 21 basis points driven by growth repricing and structural factors that persist regardless of a Hormuz resolution, setting a hard floor on how far yields can fall even if the diplomatic picture improves.
Kevin Warsh’s confirmation hearing is scheduled for 20 May, with Bloomberg assigning 85% approval odds. His public positions leave little ambiguity about direction. In a Wall Street Journal op-ed on 10 May, Warsh advocated “preemptive hikes” if inflation exceeds 3%. On Bloomberg TV on 12 May, he stated: “3.8% confirms my view.”
The incoming chair’s disposition aligns with, rather than moderates, the current hawkish market read. The data calendar over the next two weeks will either cement or complicate that consensus.
| Date | Event | What to Watch |
|---|---|---|
| 13 May | PPI (April) | Hot print pushes hike odds above 40% |
| 14 May | Powell House Testimony | Hawkish tone implies +10bps yield move |
| 15 May | Retail Sales (April) | Strong read removes soft-landing excuse |
| 16 May | Powell Senate Testimony | Coincides with Warsh confirmation process |
| 20 May | Warsh Confirmation Hearing | 85% approval odds |
| 17-18 June | FOMC Meeting | Dot plot reprice to 5.50-5.75% |
The Atlanta Fed GDPNow estimate for Q2 2026 stands at 3.7%, a resilient growth reading that removes any recession-based justification for cutting. The June 17-18 FOMC meeting is the first formal decision point, and the dot plot is expected to reprice toward a 5.50-5.75% median.
The April CPI print did not delay rate cuts. It retired the question. The market debate has moved from “when do cuts begin?” to “do hikes become necessary?”, and the answer depends on two variables: how long the Strait of Hormuz disruption persists, and whether core inflation continues to accelerate in May and June.
The next two weeks carry an unusual density of catalysts. PPI on 13 May, Powell’s House testimony on 14 May, retail sales on 15 May, and the Warsh confirmation hearing on 20 May will either harden the hawkish consensus or provide the first signal that the inflation spike is peaking. Goldman Sachs sees the terminal rate holding at 5.25-5.50% into 2027. If the data confirms that view, the repricing has only started.
For investors looking to act on the macro picture this article describes, our dedicated guide to 2026 inflation investment positioning maps specific portfolio tilts toward Treasury Inflation-Protected Securities, commodities, and pricing-power equities, with sector-level allocation logic for the higher-for-longer rate environment the Fed is now signalling.
This article is for informational purposes only and should not be considered financial advice. Investors should conduct their own research and consult with financial professionals before making investment decisions. Financial projections referenced in this article are subject to market conditions and various risk factors. Past performance does not guarantee future results.
The April 2026 CPI report showed headline inflation at 3.8% year-on-year and 0.6% month-on-month, the hottest reading since May 2023, driven by a 3.8% monthly surge in energy prices alongside accelerating shelter costs and airline fares.
The report beat consensus estimates on both the headline and core readings, and critically, the overshoot was broad-based across energy, shelter, and services categories simultaneously, making it impossible to dismiss as a single-category distortion.
Iranian seizure of tankers in the Strait of Hormuz collapsed daily vessel transits from roughly 70 ships to just 2-5, pushing Brent crude to $92 per barrel and directly adding an estimated full percentage point to headline CPI, according to Bank of America modelling.
Goldman Sachs, JPMorgan, Morgan Stanley, and Bank of America have all revised to zero rate cuts in 2026, with JPMorgan assigning 30% odds to a December hike and Morgan Stanley placing 35% probability on a hike before year-end.
The most critical near-term catalysts are the April PPI release on 13 May, Powell's House testimony on 14 May, April retail sales on 15 May, and the Warsh confirmation hearing on 20 May, followed by the June 17-18 FOMC meeting where the dot plot is expected to reprice toward a 5.50-5.75% median.