Silver fell to about $52.60 an ounce in European trading on Thursday 29 October 2026, its lowest level in 11 months. The silver price drop now leaves the metal more than half below the record it set in January.
The pressure arrived from three directions in a single 24 hours. The Federal Reserve (Fed) held rates on 28 October with two officials voting for a hike. Alphabet signalled sharply higher artificial intelligence (AI) spending. Tension between the US, Israel and Iran continued to simmer.
Those three forces did not carry equal weight, and the headlines blur that distinction.
Here is how to separate the forces that moved silver from those that only shared the news cycle, along with the chart levels that will show whether the slide has run its course.
How far has silver fallen, and where does the price sit now?
The scale is hard to overstate. Silver traded near $121.67 on 29 January. Nine months later it changed hands at less than half that.
Kitco quoted spot silver at $52.69 at 2:56 a.m. ET on Thursday, with an intraday low of $52.48 and a high of $54.51. FXStreet put the European-session low at about $52.60. On 27 October, silver touched $52.67 before closing at $54.47, according to StatMuse. As recently as 28 September, it sat at a one-month high of $61.22.
| Level | Price | Date |
|---|---|---|
| Latest spot (Kitco) | $52.69 | 29 Oct 2026 |
| Intraday low | $52.48 | 29 Oct 2026 |
| Previous close | $54.47 | 27 Oct 2026 |
| One-month high | $61.22 | 28 Sep 2026 |
| 2026 record | ~$121.67 | 29 Jan 2026 |
If the figures across outlets look slightly mismatched, there is a simple reason. Spot prices move tick by tick, so quotes vary by a few cents depending on timestamp and data feed.
The gold-silver ratio measures how many ounces of silver it takes to buy one ounce of gold. GoldSilver.com reported it above 74, a sign of silver underperformance, although that figure has not been independently confirmed.
A fall of more than 50% in nine months is a repricing of a whole year’s positioning, not a one-day wobble. Any explanation built around a single session will tell you only part of the story.
Silver is shaped by five distinct forces at once, including the dollar, real yields, the gold correlation, Chinese industrial demand and Indian consumer buying, which is why one session rarely explains a move of this size.
When big ASX news breaks, our subscribers know first
Which pressures really pushed silver lower: the Fed, AI spending or the Middle East?
The Fed channel
The Fed held its target range at 3.75%-4.00% on a 10-2 vote. Governor Lisa Cook and Cleveland Fed President Beth Hammack both wanted a 25-basis-point hike. That split turned a widely expected pause into a hawkish signal. Futures markets priced December hike odds at roughly 83%-87.5%, depending on the outlet and timestamp.
Higher rates pull silver lower through a chain of steps:
- Hawkish expectations push up Treasury yields and real yields, which are yields after inflation.
- Higher real yields raise the cost of holding a metal that pays no interest.
- Higher US yields tend to strengthen the dollar.
- A stronger dollar makes silver dearer for non-US buyers.
- Tighter policy raises concerns about industrial demand.
Sugandha Sachdeva of Mirae Asset Sharekhan, quoted in Business Standard, attributed the pressure on silver to higher real yields, a stronger dollar, softer investment demand and concerns about industrial use.
AI capex: financial pressure now, demand support later
Capital expenditure (capex) is the money a company spends on long-term assets such as data centres. Alphabet kept its 2026 guidance at $195-205 billion. Finance chief Anat Ashkenazi said spending should rise significantly in 2027, and CNBC reported that figure could exceed $300 billion, although the company has given no formal range. Meta raised the lower end of its 2026 range by $5 billion, to $135-145 billion.
The near-term link to silver runs mostly through financial markets. Heavy spending can increase borrowing and keep yields high. When tech shares fall, it can also force investors to sell gains in precious metals to cover losses elsewhere. UBS offers a counterpoint: demand from data centres, the electricity grid and electronics could offset part of the weakness in solar demand.
Why Middle East risk did not help silver
Oil acted as the go-between. Reuters put WTI crude near $101.45, down 1.3%, while FXStreet quoted about $100.74, down 0.5%, a gap that reflects timestamps. Oil above $100 feeds inflation fears and rate expectations. Crude still slipped on the day, however, as Qatari mediators presented a draft proposal that a senior Iranian official rejected. Vice President JD Vance also reportedly sent a letter to Iranian security official Mohsen Rezaei seeking to revive talks.
Silver had already slipped for two straight sessions earlier in the month as oil and Fed hike bets raised the cost of holding a metal that pays no yield, a pattern that set the stage for Thursday’s deeper drop.
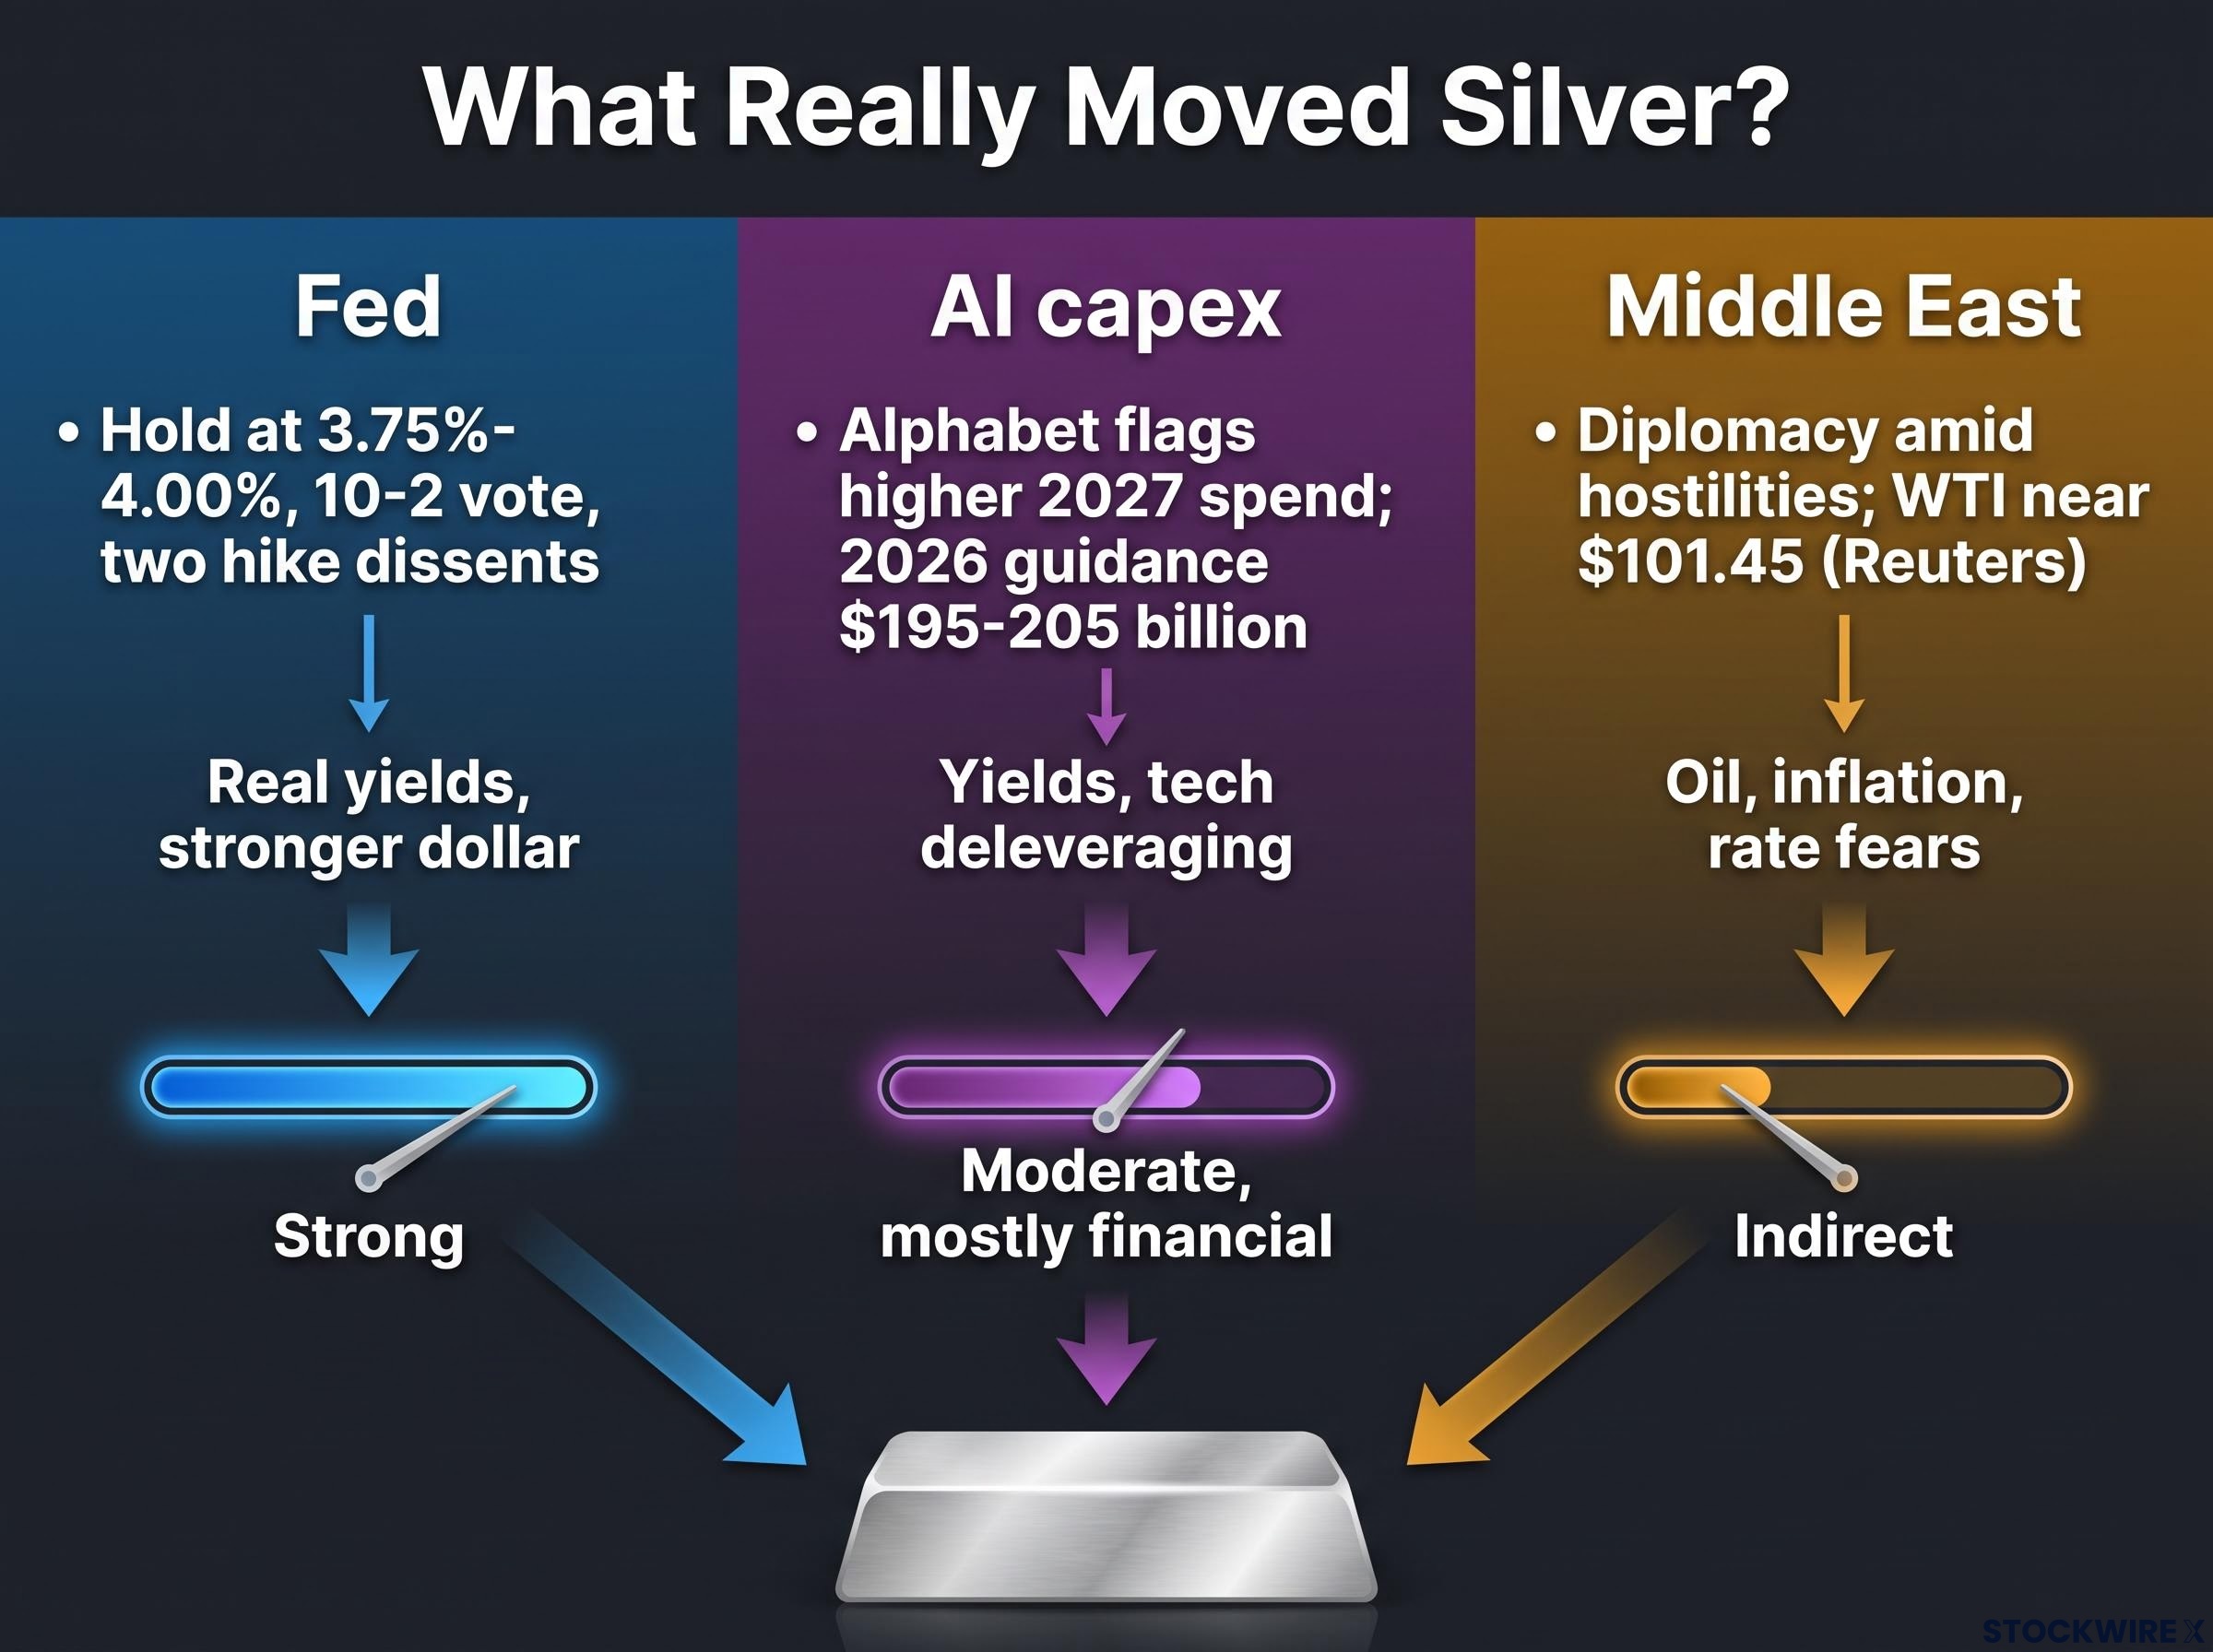
| Driver | What happened | Channel to silver | Strength of link |
|---|---|---|---|
| Fed | Hold with two hike dissents | Real yields, stronger dollar | Strong |
| AI capex | Alphabet flags higher 2027 spend | Yields, tech deleveraging | Moderate, mostly financial |
| Middle East | Diplomacy amid hostilities | Oil, inflation, rate fears | Indirect |
Right now, silver is trading as a rate-sensitive asset rather than a safe haven. The December Fed outcome matters more to its direction than any single geopolitical headline.
What do the chart levels say: $57, the 20-day EMA and RSI?
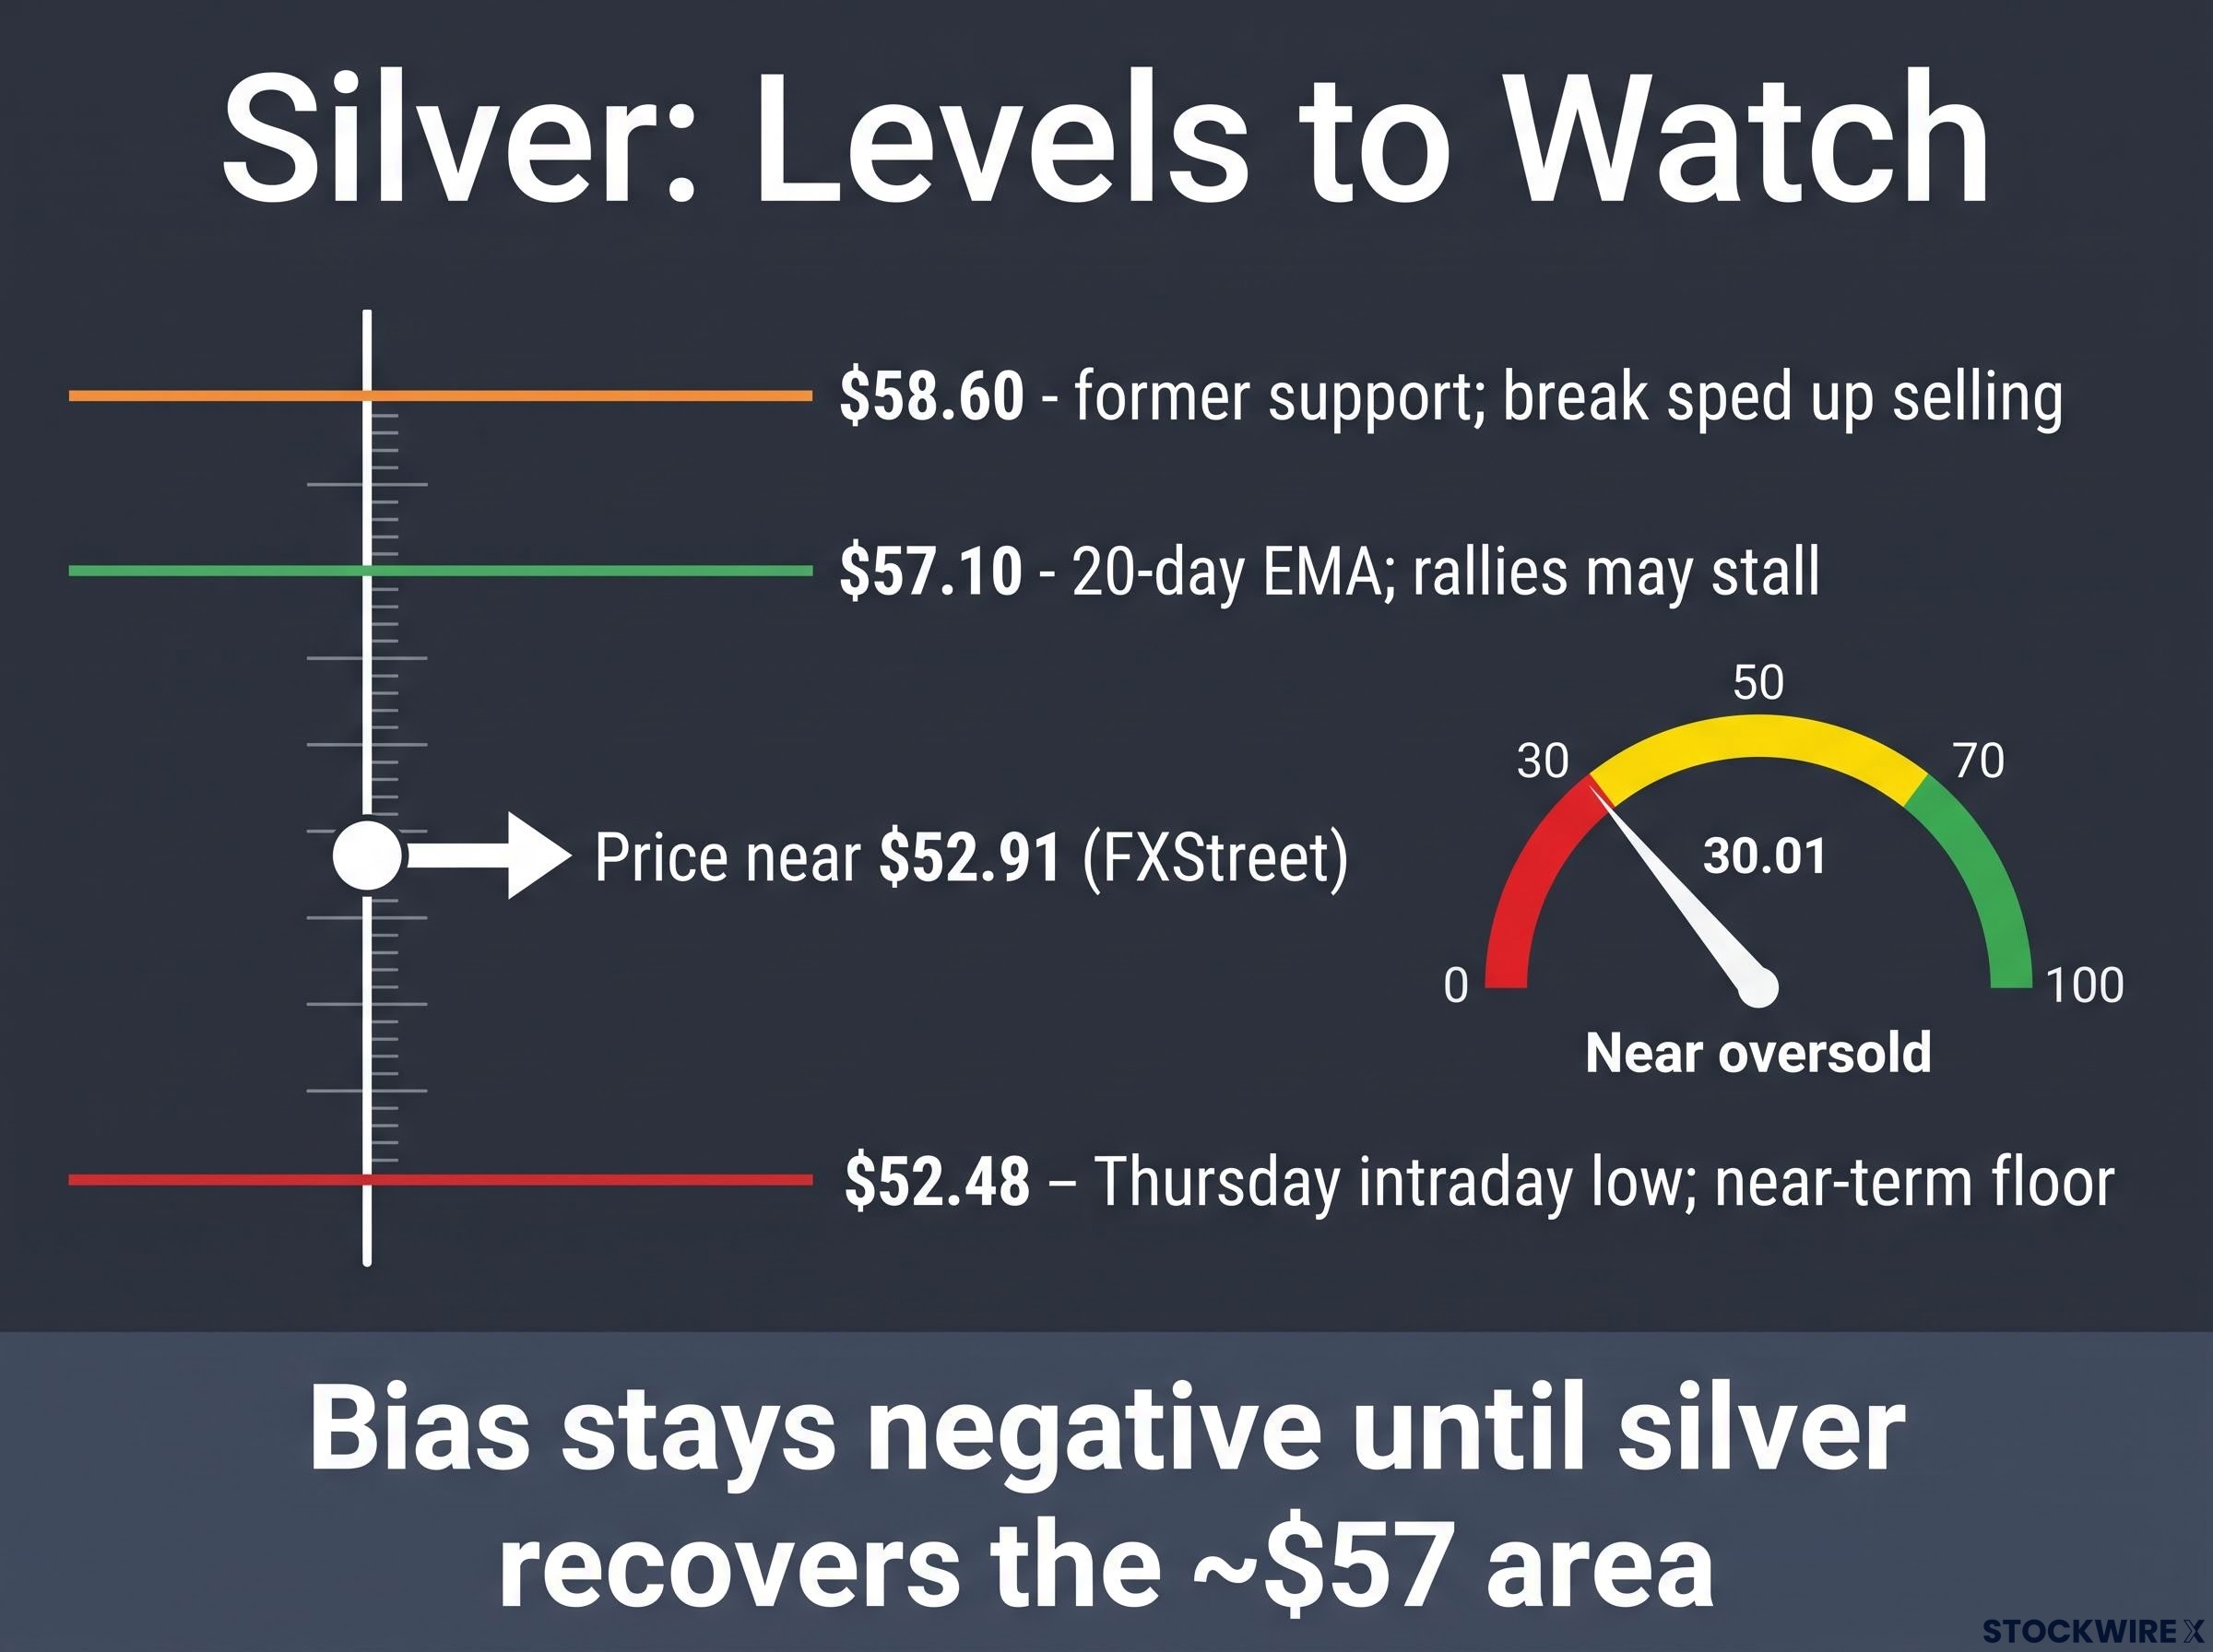
The chart reinforces the macro picture. FXStreet put the price near $52.91, well under the 20-day exponential moving average (EMA) of $57.10. An EMA is an average of recent closing prices that gives more weight to the latest sessions. Trading this far below it keeps the bias bearish, and the outlet expects rallies to stall near $57 unless silver posts a sustained daily close above that level.
The relative strength index (RSI) sits at 30.01. RSI is a momentum gauge from 0 to 100, and readings near 30 are conventionally treated as oversold. That reading is not a timing signal, though. Assets can stay oversold for long stretches during a persistent trend.
Mirae Asset Sharekhan reportedly identified the break below roughly $58.60 as the stage that accelerated leveraged liquidation, although that account has not been independently confirmed. FXStreet’s technical section was written with an AI tool, so treat these levels as one outlet’s read rather than a forecast.
Earlier technical work flagged a live Head and Shoulders pattern with a neckline near $62.20, a level silver has since broken, which helps explain why the former support zones now act as resistance.
These are the levels to watch:
- $52.48: Thursday’s intraday low and the near-term floor
- $57.10: the 20-day EMA, where rallies may stall
- $58.60: the former support area whose break sped up selling
The key rule: The bias stays negative on bounces until silver recovers the ~$57 area.
An oversold reading tells you a bounce is possible. Until silver closes back above about $57, however, the chart offers no confirmation that the slide has ended.
What could turn silver around, and what could push it lower still?
Both cases have credible support. The rebound case rests on an oversold RSI, a high gold-silver ratio and the chance that December hike odds fade, taking yields and the dollar lower. Mirae Asset Sharekhan argues the selloff may be overdone. UBS forecasts a sixth consecutive annual deficit and a rebound toward $70 by December 2026, from about $55.90 on 22 October.
The downside case is just as concrete. Real yields could stay high, further tech sell-offs could force more metal liquidation, and solar makers are thrifting, meaning they use less silver per panel.
The supply argument itself is contested:
- The Silver Institute reportedly forecasts a 2026 deficit of about 46.3 million oz (unverified)
- It also expects industrial fabrication to fall about 2% to roughly 650 million oz
- HSBC reportedly estimates the deficit at only about 5 million oz (unverified)
| Scenario | Trigger | What to watch |
|---|---|---|
| Rebound | Fading hike odds, softer dollar | Daily close above $57 |
| Further decline | Sticky real yields, tech liquidation | Break below $52.48 |
History shows how quickly sentiment can turn. HANetf points to 2011, when a silver boom reversed sharply as liquidity and yields shifted.
Treat the $70 call as one house view resting on a disputed deficit. Rates and positioning can overpower supply fundamentals for weeks at a time.
Past performance does not guarantee future results. Forecasts are subject to market conditions and various risk factors.
What the silver sell-off settles, and what stays open
The evidence points one way. Silver’s slide has been driven mostly by rates, the dollar and positioning. AI spending is a financial pressure now and a possible source of demand support later, while Middle East risk has worked against the metal through oil and inflation rather than lifting it as a haven.
Three variables remain open: December Fed pricing, a daily close above the $57 area, and any shift in Iran diplomacy that moves oil. The next tests are Alphabet’s Q4 call, where it expects to give more detail on 2027 capex, and the Fed’s December meeting.
This article is for informational purposes only and should not be considered financial advice. Investors should conduct their own research and consult with financial professionals before making investment decisions.