Silver jumped nearly 4% in a single session this week, and if you asked five analysts why, you might get five different answers. Was it the Federal Reserve? The solar boom in China? Indian buyers stepping in on a dip? A softer US Dollar? Each explanation sounds plausible, which is exactly the problem.
That disagreement is not a weakness in silver analysis. It is the single most important thing to understand about how silver behaves.
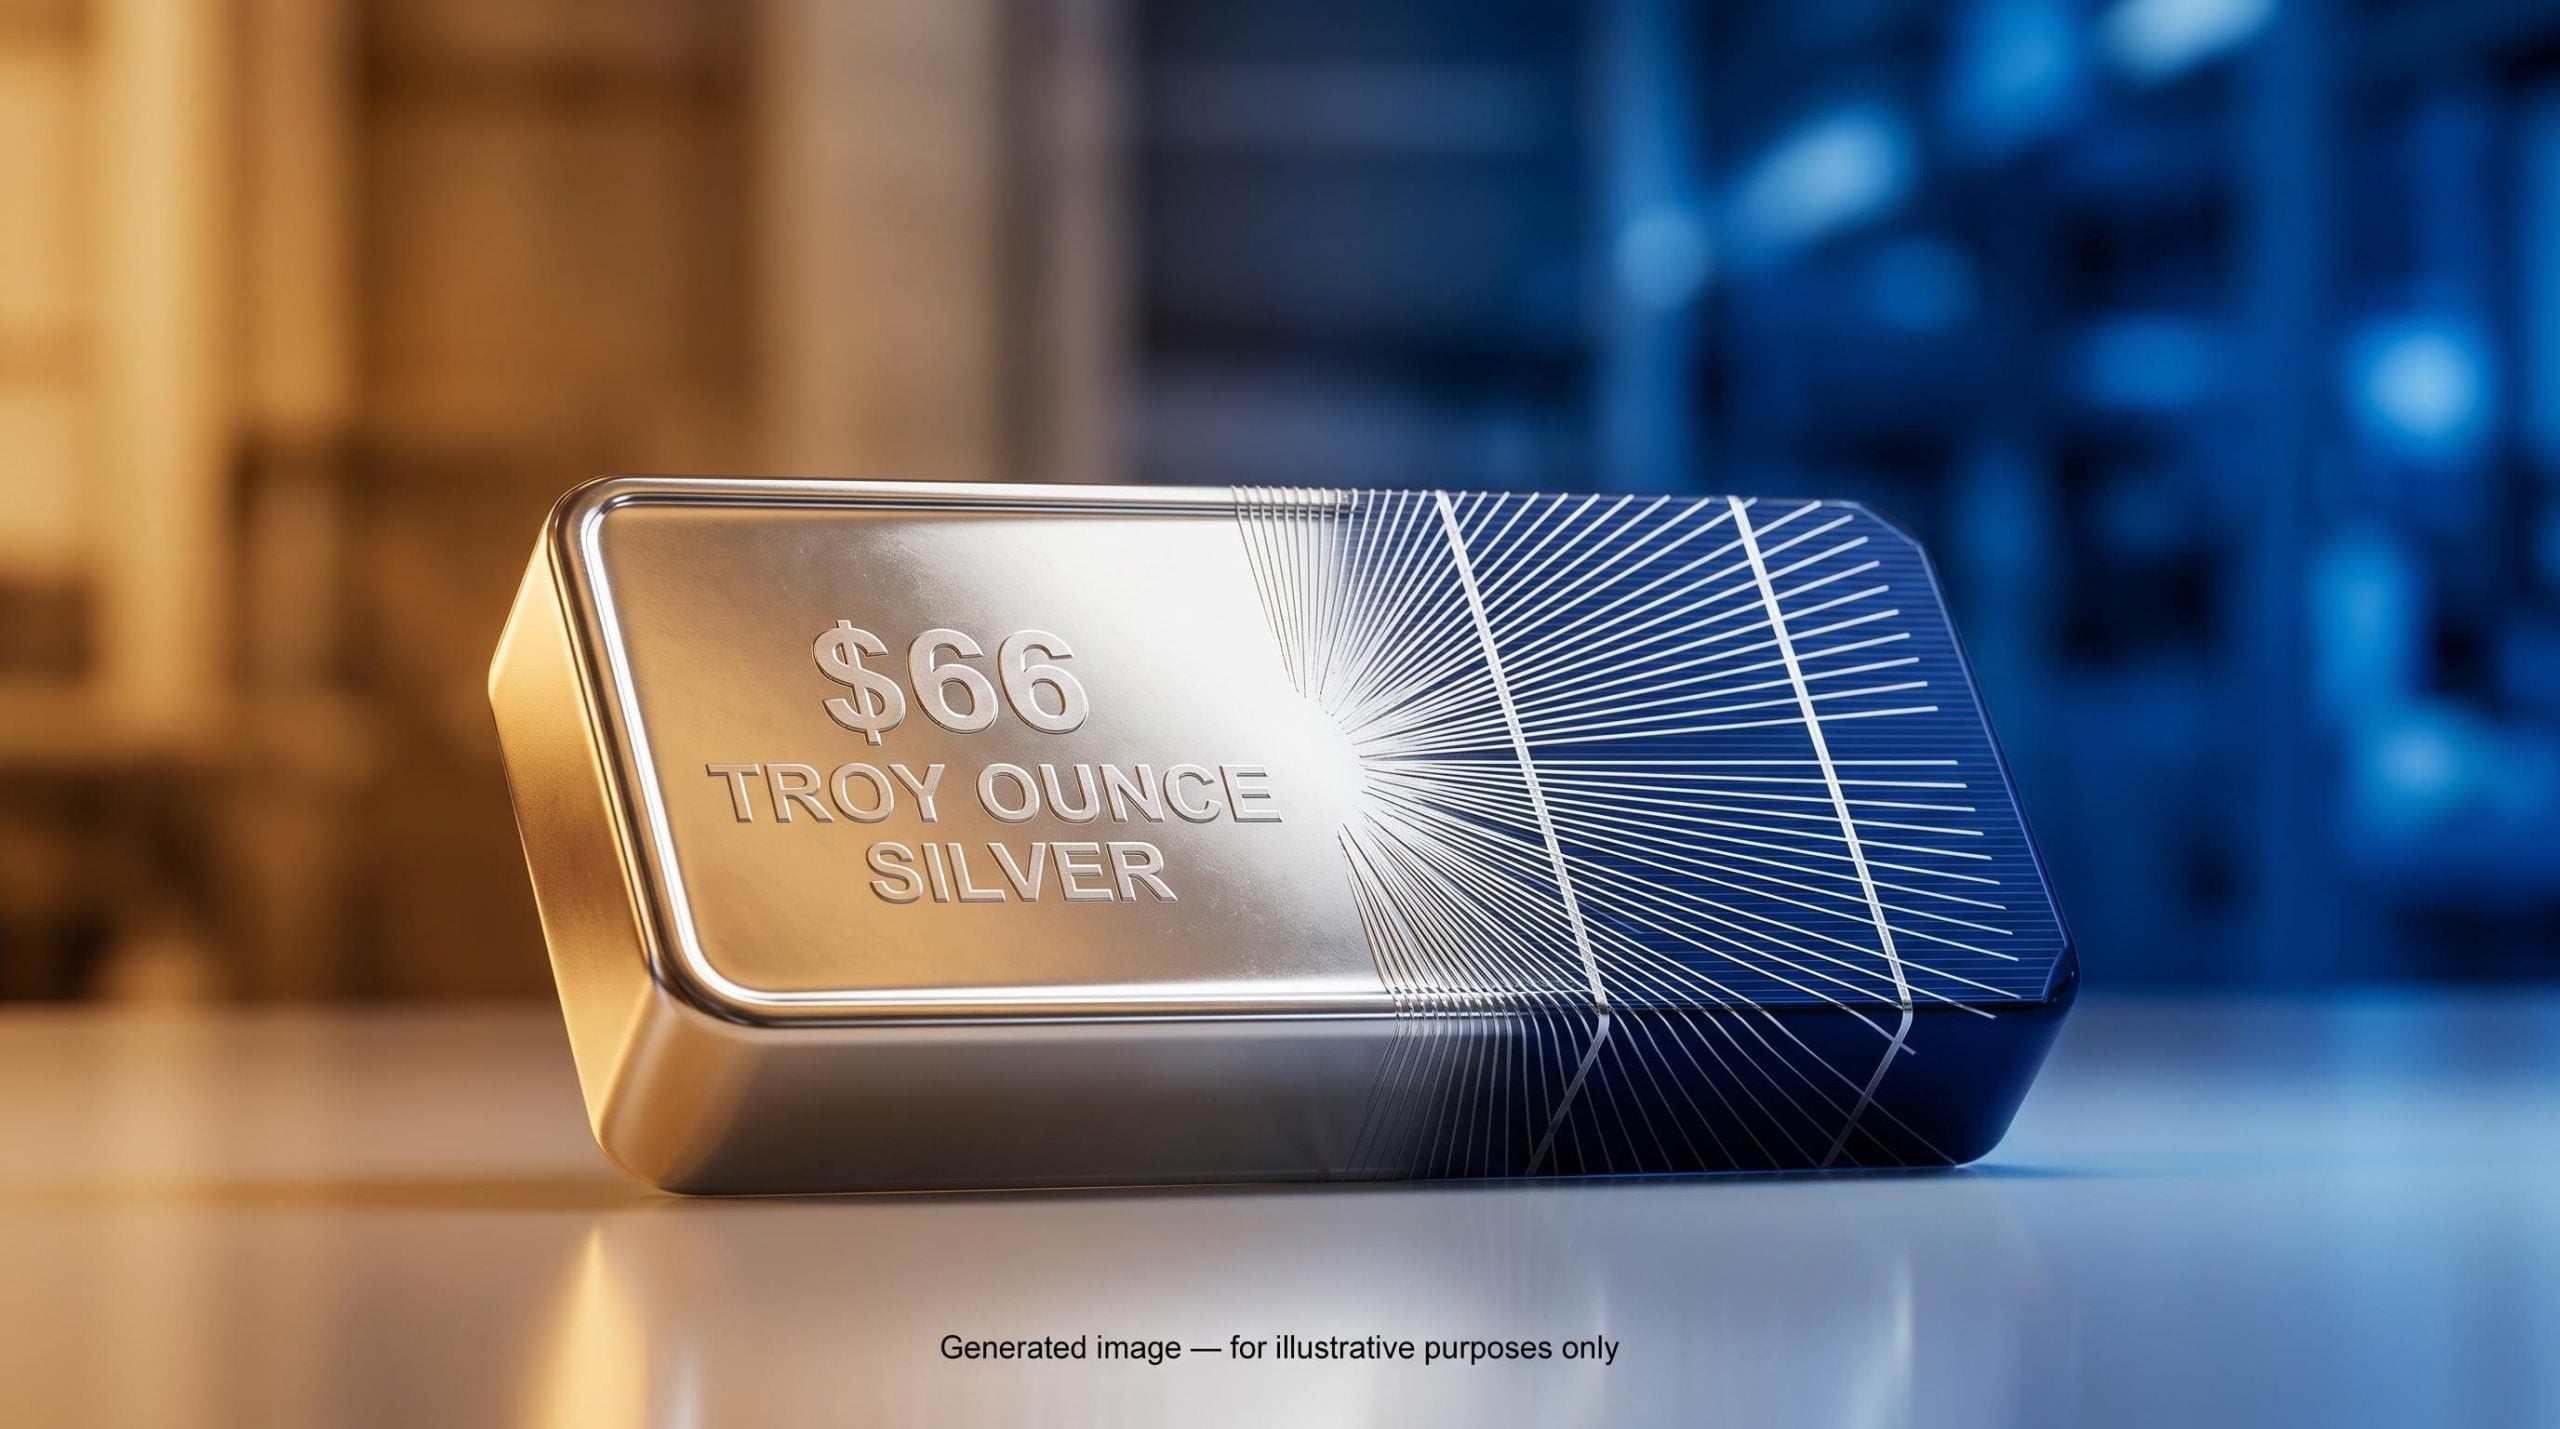
Silver lives at the intersection of two entirely different asset categories: it is a precious metal that people hoard for safety, and an industrial raw material that factories consume by the tonne. This split identity is precisely why its price is so hard to read through any single framework. As of mid-September 2026, silver trades around $66-67 per troy ounce, a level shaped by several forces pulling in different directions at once.
Here is what you will walk away with: a practical toolkit for looking at any silver price move and identifying which of the five main force categories is most likely behind it, instead of reaching for a generic precious-metals story that only explains half of what is happening.
Silver’s split personality: precious metal and industrial commodity
Most people arrive at silver thinking of it as gold’s cheaper cousin. A safe haven you can actually afford. That instinct is not wrong, but it captures maybe half the picture, and probably the less important half.
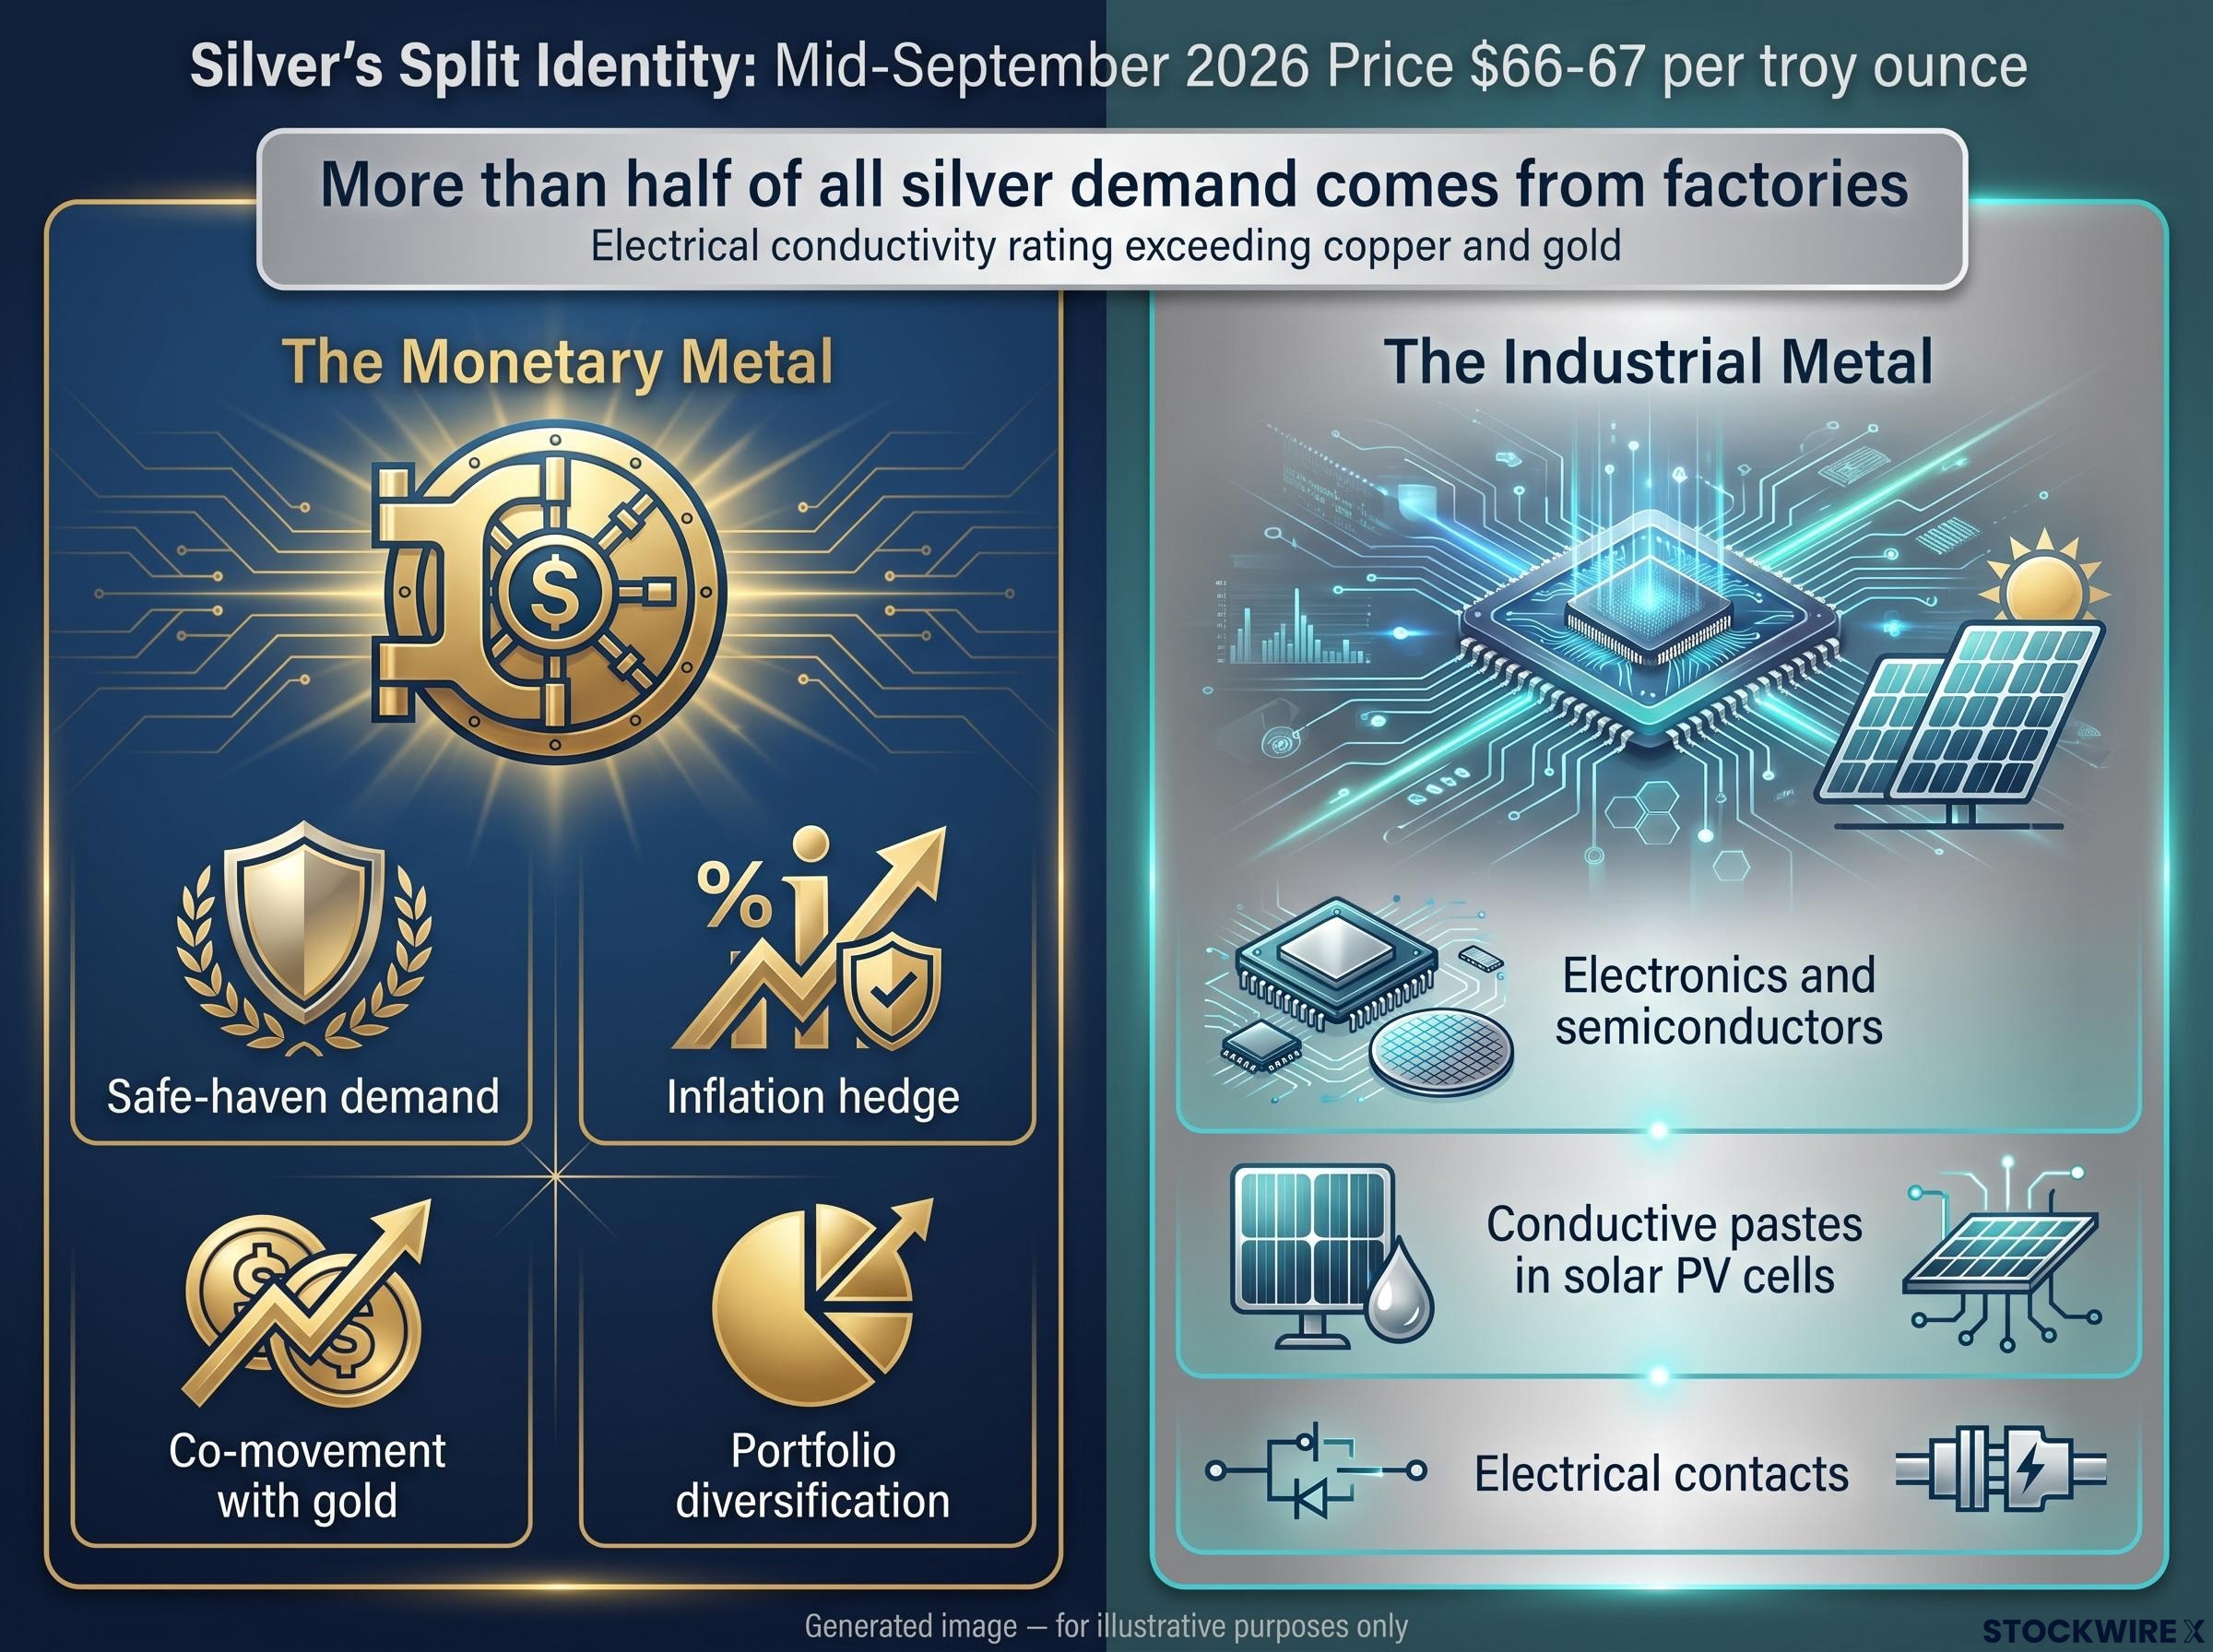
More than half of all silver demand comes from factories, not vaults. Electronics, solar panels, electrical contacts, and precision components consume the majority of silver produced each year, according to figures the Silver Institute and Metals Focus track annually. That single fact separates silver from gold far more sharply than most retail investors realise.
The reason sits in the metal’s physical properties. Silver has one of the highest electrical conductivity ratings of any metal, exceeding both copper and gold, which makes it genuinely difficult to replace in applications where performance matters.
The monetary metal case
Silver shares gold’s core appeal as a store of value. It attracts safe-haven demand during market stress, carries an inflation-hedge narrative, tends to move alongside gold, and plays a portfolio diversification role for investors who want exposure outside stocks and bonds.
The store-of-value attributes are worth listing plainly:
Safe-haven demand for gold and silver often intensifies around the same macro triggers, but the structural case for gold as of mid-2026 rests on forces that operate independently of silver’s industrial cycle: record central bank purchases of 289 tonnes in Q2 2026, a $636 billion high-yield debt refinancing wall, and measurable reserve de-dollarisation among sovereign managers.
- Safe-haven demand during geopolitical or financial stress
- A perceived hedge against elevated inflation
- Close co-movement with gold prices
- Diversification away from traditional financial assets
The industrial metal case
Now the other half. Silver’s conductivity makes it central to electronics manufacturing, the conductive pastes inside solar photovoltaic cells, and electrical contacts across countless devices.
The industrial attributes look completely different:
- Core input for electronics and semiconductors
- Conductive pastes in solar PV cells
- Electrical contacts and switches
- Hard to substitute in high-precision, high-reliability applications
Silver is also far more abundant in supply than gold, which is why it trades at a fraction of gold’s price per ounce despite sharing the safe-haven story.
For you, the takeaway is this: a silver price move cannot be decoded by looking at the precious-metals market or the industrial-commodities market alone. You need both lenses at once, and knowing which one is dominant in a given environment tells you whether to treat silver as defensive or cyclical.
When big ASX news breaks, our subscribers know first
How the US Dollar and real interest rates move silver
Two macro forces sit at the top of most silver watchers’ checklists: the US Dollar and real interest rates. Both matter enormously, but they operate through completely different mechanisms, so it pays to take them one at a time.
Start with the Dollar. Silver is priced globally in US dollars, so when the Dollar strengthens, silver becomes more expensive for anyone buying in another currency. That higher effective cost dampens demand outside the US, pushing the price down. A weaker Dollar does the reverse, making silver cheaper for global buyers and supporting the price.
This Dollar effect actually runs through two sub-channels. Investment demand (ETFs, bars, and coins) responds to Dollar-driven shifts in global risk appetite, while industrial demand responds to how expensive silver becomes for manufacturers managing costs in their local currencies, especially in price-sensitive applications.
Now the second channel: real interest rates, meaning nominal yields adjusted for inflation expectations. Silver pays no income. So when real rates rise, income-bearing assets like government bonds become relatively more attractive, and the cost of parking your capital in a non-yielding metal goes up.
Commodity research teams at UBS and BMO Capital Markets frame this precisely as an “opportunity cost” channel: higher real yields raise the cost of holding silver, because investors give up more income by staying in a metal that generates none.
When real yields fall, whether because nominal rates drop or inflation expectations climb, the opposite happens. Investors start seeking inflation hedges and safe-haven assets, which can support silver even if the Dollar is holding steady.
Here is how the two channels break down.
| Macro force | Silver price implication and mechanism |
|---|---|
| US Dollar strengthens | Downward pressure. Silver costs more in other currencies, suppressing global investment and industrial demand. |
| US Dollar weakens | Upward support. Lower local-currency prices lift demand from non-US buyers. |
| Real rates rise / fall | Rising rates raise the opportunity cost of holding a non-yielding metal, pressuring silver. Falling rates lower that cost and can boost hedge demand. |
For you personally, this is why silver often falls sharply and fast when rate expectations shift. When the Fed signals tightening, the pressure is not just sentiment. It is mechanistic, hitting silver through the Dollar and the yield channel at the same time.
Silver’s relationship with gold, and where they diverge
You have probably noticed silver tends to follow gold. That instinct is correct, and it is a reasonable starting point. It is just not a conclusion.
Both metals carry safe-haven status, both respond to real rates and Dollar moves, and investors and financial media routinely group them together as a single precious-metals trade. When gold rallies on a geopolitical shock, silver usually comes along for the ride.
Gold demand composition in Q2 2026 illustrates exactly why headline numbers mislead: reported investment demand fell 46% year-on-year, yet OTC investment alone delivered 327 tonnes in the same quarter, a flow the standard figures omit entirely, and central bank purchases hit a record 289 tonnes while jewellery volume fell to a pandemic-era low.
The complication is amplitude. Silver is best understood as a higher-beta, higher-risk complement to gold: it reacts to the same macro drivers but swings harder. Three structural factors explain the extra volatility, a smaller and thinner market, greater susceptibility to speculative positioning, and the industrial demand component that gold simply does not carry to the same degree.
History shows this divergence repeatedly:
- Late 1970s to 1980: The Hunt brothers’ attempt to corner the silver market drove a speculative spike and crash, showing how leveraged positioning can overwhelm fundamentals in silver’s smaller market.
- 2010 to 2011: Silver surged alongside gold amid post-crisis monetary expansion, then suffered a far sharper correction than gold when sentiment turned.
- 2020 to 2021: The pandemic-era “silver squeeze” produced price moves far more erratic than gold’s, driven heavily by retail and social-media speculation.
What the Gold/Silver ratio tells you (and what it does not)
The Gold/Silver ratio measures how many ounces of silver it takes to buy one ounce of gold, and traders use it as a relative valuation gauge.
A high ratio is sometimes read as a signal that silver is undervalued relative to gold, and a low ratio as a sign silver may be stretched. Treat it as a relative measure, not a standalone buy or sell signal. It tells you how the two metals are priced against each other, not whether either is cheap in absolute terms.
For you, the practical implication is that using silver as a simple proxy for gold introduces real basis risk. In a risk-off episode driven by growth fears rather than inflation, silver can fall alongside equities and copper even while gold holds its ground. In that moment, the two are a different trade, not the same one.
The energy transition and why solar PV has become a structural demand story
If there is one long-term bull case you will hear repeated about silver, it is solar. The Silver Institute, LBMA-affiliated research, and bank commodity teams broadly characterise solar photovoltaics as the fastest-growing individual end-use for silver globally.
The IEA Global Critical Minerals Outlook tracks silver demand across technology end-uses and identifies solar PV as one of the fastest-growing consumption categories, a finding consistent with what bank commodity research teams and the Silver Institute report on the structural demand shift underway.
The mechanism is specific. Silver goes into the conductive pastes applied to the front and back contacts of crystalline silicon solar cells, where its superior conductivity and long-term reliability across temperatures make it the material of choice for high-efficiency modules.
The bullish logic follows from the energy transition itself. As countries pursue net-zero targets and electrify their grids, global solar installations keep climbing. Even as manufacturers reduce the silver used per panel, total silver consumption in solar can stay structurally elevated because the number of panels deployed rises faster than per-panel loadings fall.
That constraint has a name: thrifting. Cell and module makers have strong commercial incentives to cut silver per cell, both to control costs and to hedge against silver’s price swings, and they have already materially reduced silver loadings over the past decade.
The risks do not stop there. Substitution research, particularly copper-based contacts, is active, and while copper brings corrosion and reliability challenges, robust engineering solutions could cap silver’s growth. Advanced cell designs including TOPCon, heterojunction, and tandem perovskite architectures may change metallisation requirements, with some raising silver intensity and others potentially lowering it.
| Factor | Bullish case | Constraint or risk |
|---|---|---|
| Deployment volumes | Net-zero targets drive rising global installations. | Sensitive to policy support, financing, and over-capacity. |
| Per-unit silver intensity | Volume growth can outpace declining loadings. | Thrifting has already cut silver per watt sharply. |
| Substitution | Silver remains preferred for high-efficiency modules. | Copper-based contacts under active research. |
| Supply response | Demand tailwind supports long-run consumption. | By-product supply can rise without a price incentive. |
That last point matters. Since most silver is produced as a by-product of lead, zinc, copper, and gold mining, primary supply can climb even without a silver-price incentive, partially offsetting demand-driven tightness.
For you, the energy transition gives silver a long-duration demand tailwind that is structurally different from cyclical industrial demand or investment flows. It is not a guaranteed price catalyst, though. The net effect depends on whether deployment growth outpaces thrifting, and whether supply keeps up.
China and India as the demand anchors that most analysis underweights
Most silver commentary is stubbornly Western-centric: the Dollar, the Fed, the gold correlation. Yet two of the biggest forces on silver demand sit in Asia and operate through mechanisms that have nothing to do with the Federal Reserve.
China is the dominant force in industrial and solar-related silver demand. It anchors the global electronics supply chain and stands as both a leading producer and deployer of solar panels, so its consumption swings with manufacturing PMIs, export orders, and green-energy policy.
India plays an entirely different role. The Silver Institute and Metals Focus identify it as one of the world’s largest consumers of physical silver, driven by jewellery, silverware, and small-bar and coin investment. That demand tracks income growth, cultural preferences, and price sensitivity rather than macro-monetary signals.
Asian physical demand accounts for roughly 70% of global gold consumption, and Western-centric models that weight ETF flows and Fed signals most heavily are structurally incomplete for the same reason they miss the full picture in silver: India’s Q1 2026 bar and coin demand of 62 tonnes was the highest first-quarter reading since 2013, driven by income growth and price sensitivity rather than monetary policy.
The two countries pull silver’s demand base along partially different cycles:
- China: industrial consumption, solar PV manufacturing, and broader electronics production tied to global manufacturing trends.
- India: jewellery, silverware, consumer investment demand, and a growing but smaller industrial base across electronics, automotive, and photovoltaics.
One of the most telling examples of how local, non-monetary factors move a major silver demand pool comes from rural India.
Indian rural silver buying is closely linked to monsoon seasons and agricultural income, connecting one of silver’s largest demand pools to climatic and harvest cycles that are entirely separate from interest rates or the US Dollar.
For you, this means a silver price move can be driven by forces with no connection to the Fed at all. A surge in Indian consumer buying after a price dip, or a Chinese manufacturing expansion cycle, can be the dominant driver in a given moment. Ignoring these anchors produces an incomplete, and potentially misleading, read of what is happening.
Reading a silver price move: putting the framework to work
So silver jumps 4% and the explanations start flying. Now you have a way to sort through them.
The point is not to find one clean cause. Silver’s dual nature means several forces usually act at once, sometimes in opposite directions. Your job is to identify which one is dominant.
Here is the diagnostic sequence to run whenever silver moves sharply, in the order that tends to be most useful:
- Check the US Dollar. Is it strengthening or weakening? A clear Dollar move often explains the direction on its own.
- Check real yields and Fed signals. Are rate expectations shifting? Rising real rates pressure silver through opportunity cost.
- Check gold for divergence. Is silver moving with gold or breaking away? Divergence points to something silver-specific, often speculation or industrial demand.
- Check China industrial and solar data. Manufacturing and solar deployment signals can drive demand independently of Western macro.
- Check Indian physical demand news. Price dips, festival buying, or strong agricultural income can lift consumer purchases sharply.
Remember that the label “precious metal” guarantees nothing. In a growth-fear risk-off episode, silver can sell off alongside equities and copper even while gold holds ground, exactly because its industrial half dominates that moment.
When the stories align: what a durable silver rally actually requires
A sustained move higher, rather than an episodic spike, generally needs the monetary and industrial stories to reinforce each other rather than cancel out.
That means a weak Dollar and falling real yields supporting investment demand at the same time as strong Chinese manufacturing, accelerating solar deployment, and robust Indian consumer buying lift industrial and physical demand. When all of these line up, silver has both engines firing.
The reason durable rallies are rarer than the headlines suggest is that these conditions do not often align. A rate-cutting cycle can coincide with weak manufacturing; a solar boom can run into a strong Dollar. Single-factor narratives are easy to tell, but silver rewards the reader who tracks all five.
At roughly $66-67 per troy ounce as of mid-September 2026, silver is encoding signals from monetary policy, industrial cycles, geopolitical risk, and consumer demand across major economies all at once. Reading it well is a genuinely useful macro skill, and you now have the framework to do it.
For investors exploring how gold and silver fit into a broader portfolio allocation framework, our full explainer on precious metals ratio signals covers the S&P 500-to-gold compression to its lowest level since March 2020 and what that reading has historically implied for real returns across asset classes.
This article is for informational purposes only and should not be considered financial advice. Investors should conduct their own research and consult with financial professionals before making investment decisions.
Past performance does not guarantee future results. Financial projections are subject to market conditions and various risk factors.