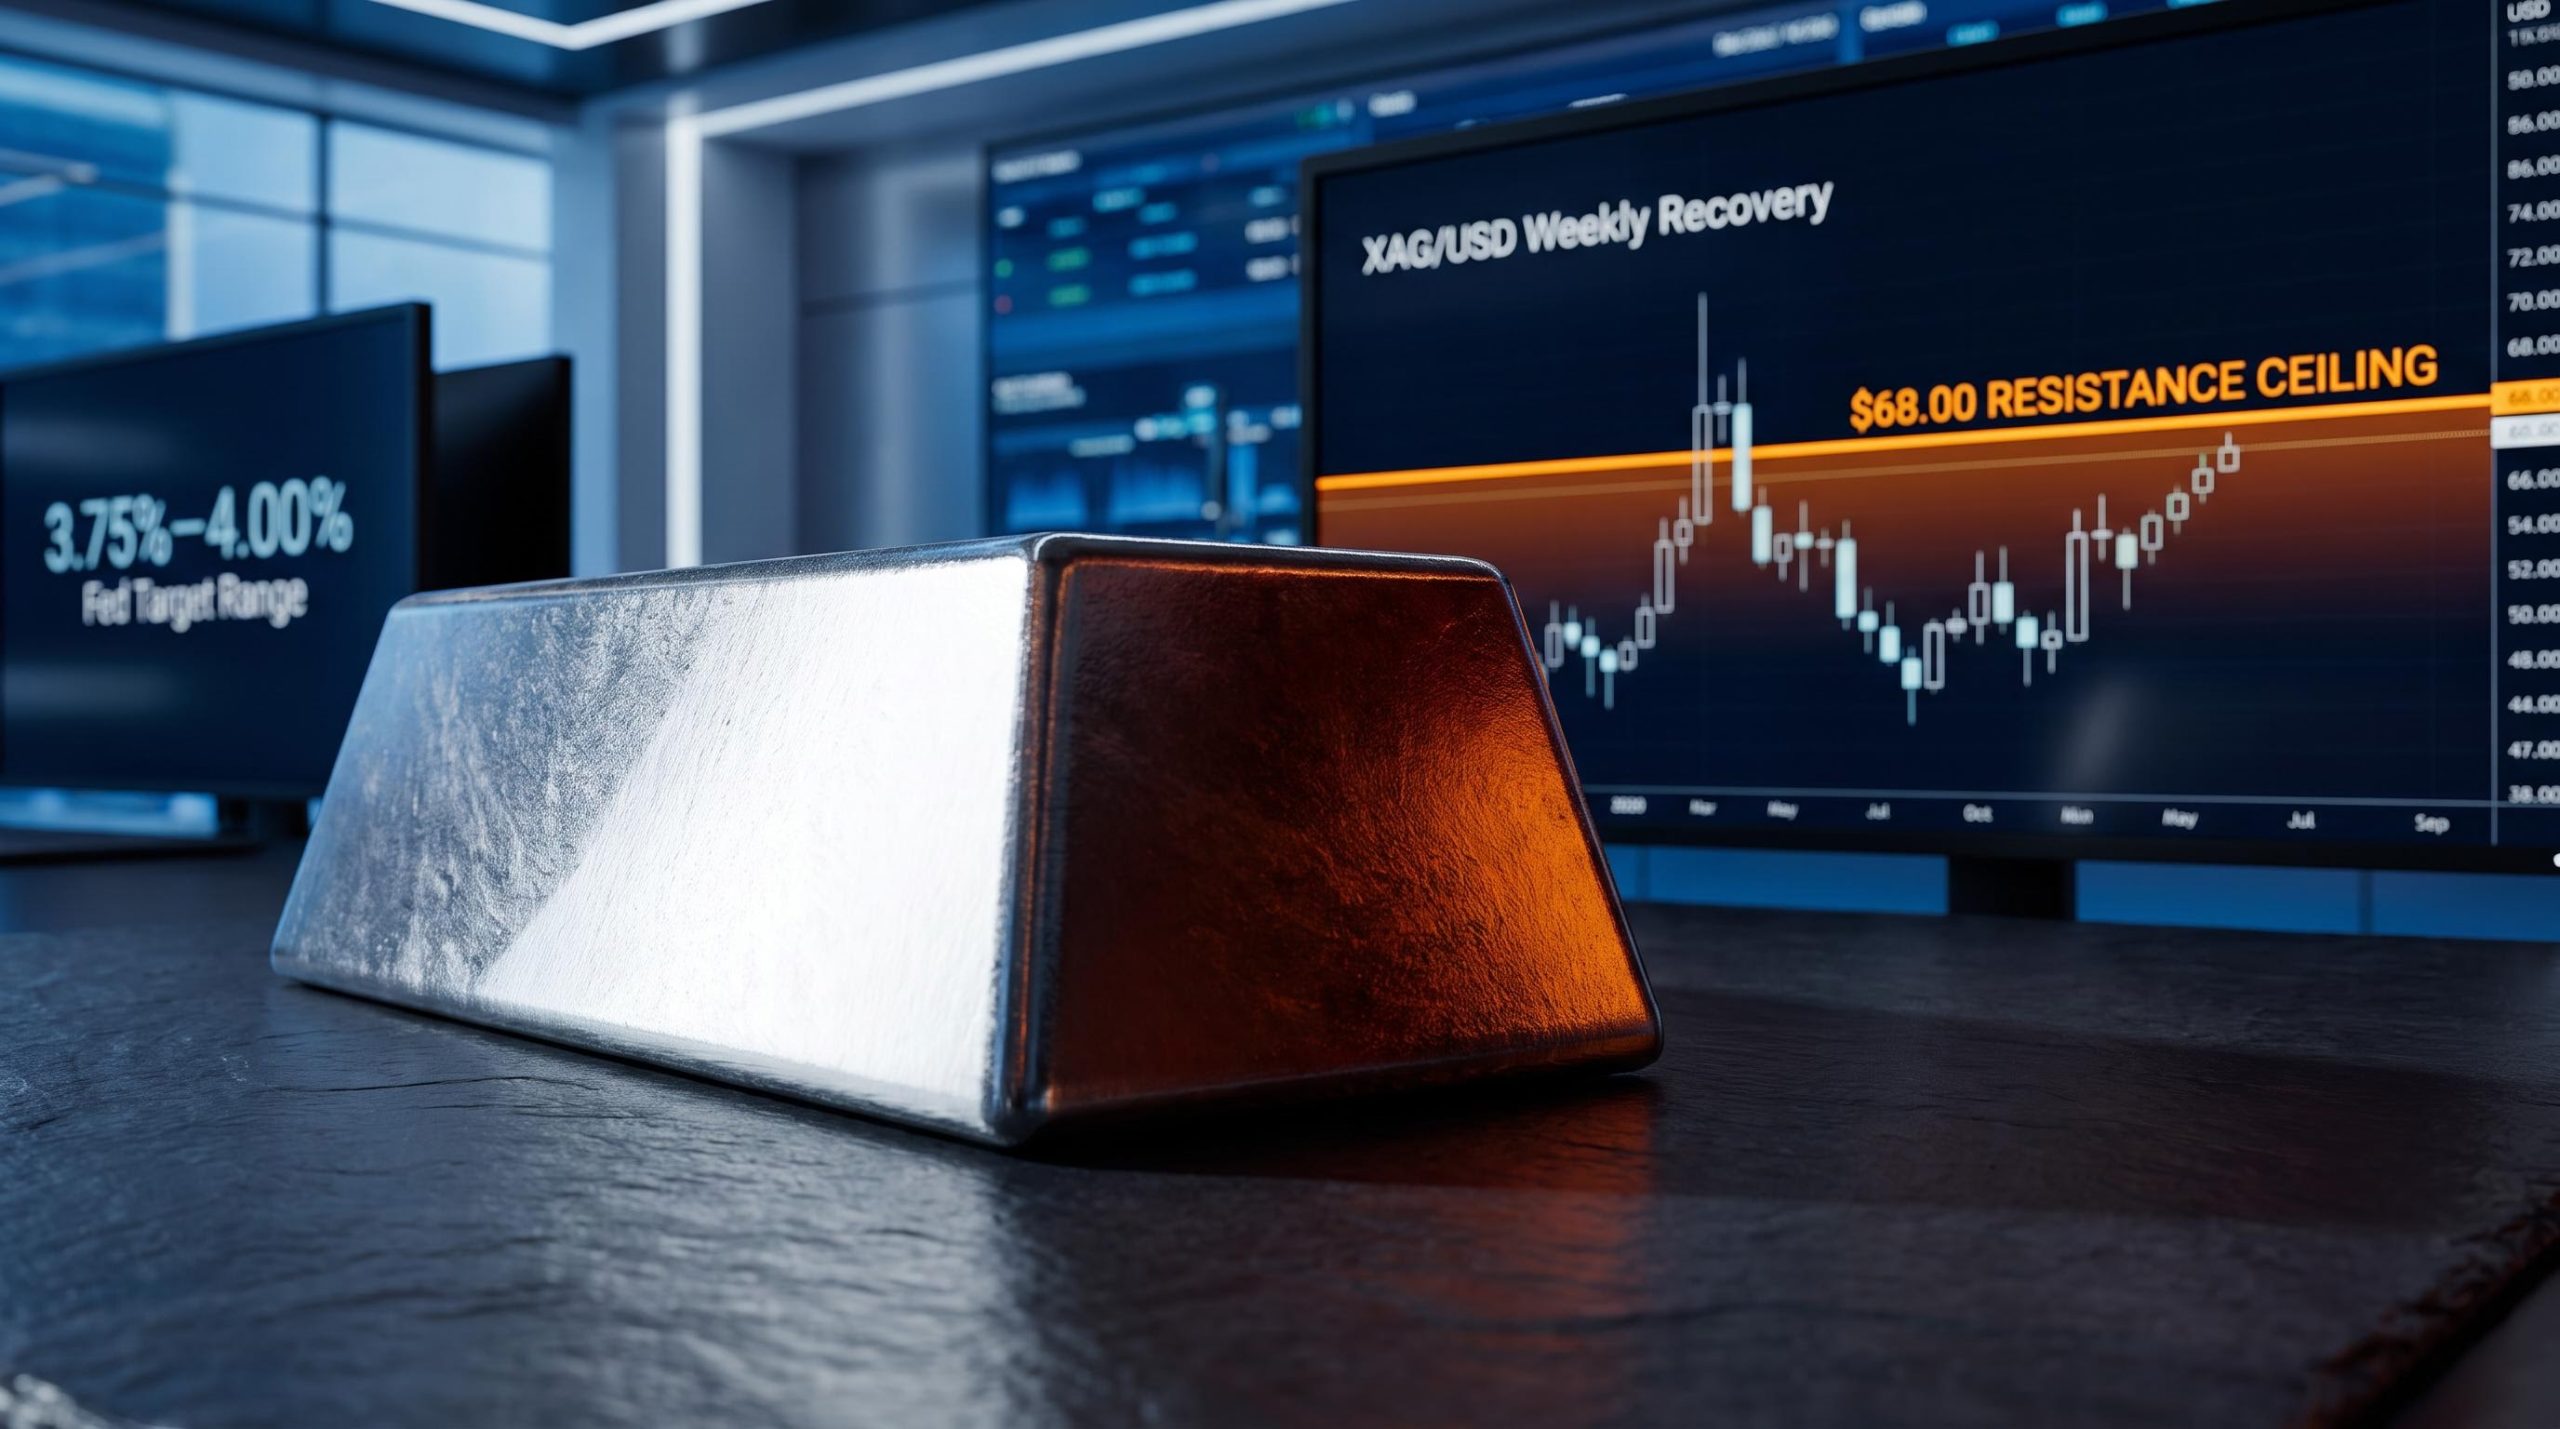
Silver just clawed back more than $5 from its weekly lows in a matter of days, climbing from near $62.00 to above $67.00 by the close of the week. That move sounds decisive until you look at what sits directly overhead: a resistance ceiling that has rejected the metal repeatedly, and a bearish chart pattern sitting quietly on the daily timeframe.
That combination is the tension. This recovery is unfolding in a specific macro moment. On 16 September 2026, the Federal Reserve delivered its first rate hike since 2023, lifting the target range to 3.75%-4.00%, and bond markets responded with partial relief as the US 10-year Treasury yield retreated back below 5%.
Here is what this piece maps out: the macro catalyst that actually drove the bounce, the technical structure standing in its way, and the specific price levels that will confirm whether this is the start of something real or a setup for a larger breakdown. By the time you finish, you will know exactly what to watch and why it matters before you commit to a position.
Why silver moved: the Fed hike, yield relief, and the macro sequence traders need to understand
The move that mattered this week was not the rate hike itself. It was what the bond market did in response.
The Federal Reserve’s FOMC voted unanimously, 12-0, to raise the federal funds target range by 25 basis points to 3.75%-4.00% on 16 September 2026. This was the first increase since 2023, reversing one of the prior year’s cuts, and Fed Chairman Kevin Warsh reaffirmed the central bank’s commitment to bringing inflation down.
FOMC official statement “The Committee decided to raise the target range for the federal funds rate by 1/4 percentage point to 3-3/4 to 4 percent, in support of the Federal Reserve’s dual mandate.”
Here is the sequence that actually played out, in order:
- The Fed delivered the 25-basis-point hike, lifting rates for the first time in over two years.
- The US Dollar strengthened initially, the standard reaction to tighter policy.
- Treasury yields spiked on the hawkish decision, pressuring non-yielding assets.
- Bond markets then found relief as confidence in the Fed’s independence under Warsh was reinforced.
- The 10-year yield retreated back below the 5% threshold, sitting around 5.00% as of 18 September 2026.
- Silver bounced, extending gains above $67.00 as the yield relief trade won out.
The mechanism here is direct. Silver pays no interest, so the cost of holding it is the yield you give up by not owning a bond instead. When real yields fall, that opportunity cost shrinks, and silver becomes relatively more attractive.
The yield-to-asset-price transmission channel works through discount rates applied to future cash flows, and while the current article focuses on silver’s opportunity cost, the same mechanism compresses equity valuations across sectors simultaneously, giving traders a fuller picture of why the 5% yield threshold carries such broad market significance.
That is the entire line between the yield retreat and XAG/USD’s climb. The same rate hike that first pressured the metal ultimately supported it, because the market’s read on yields flipped within days.
For a trader, the implication cuts deeper than the price chart suggests. This recovery was driven by a yield retreat, not a fundamental shift in Fed policy. Officials have flagged more tightening ahead if inflation stays sticky, which means any reversal of the yield move, triggered by a hot inflation print for instance, could unwind this bounce as quickly as it appeared. The variable to watch is not the silver spot price. It is the next US inflation reading.
When big ASX news breaks, our subscribers know first
What the chart actually says: resistance, momentum, and the bearish pattern hiding in plain sight
On the surface, the read is straightforward: silver is recovering, sentiment is cautiously optimistic, and the metal has reclaimed the $67 handle. That is the encouraging version.
The chart tells a more demanding story once you map what sits above current price. Silver has recovered directly into the most technically crowded overhead zone it faces.
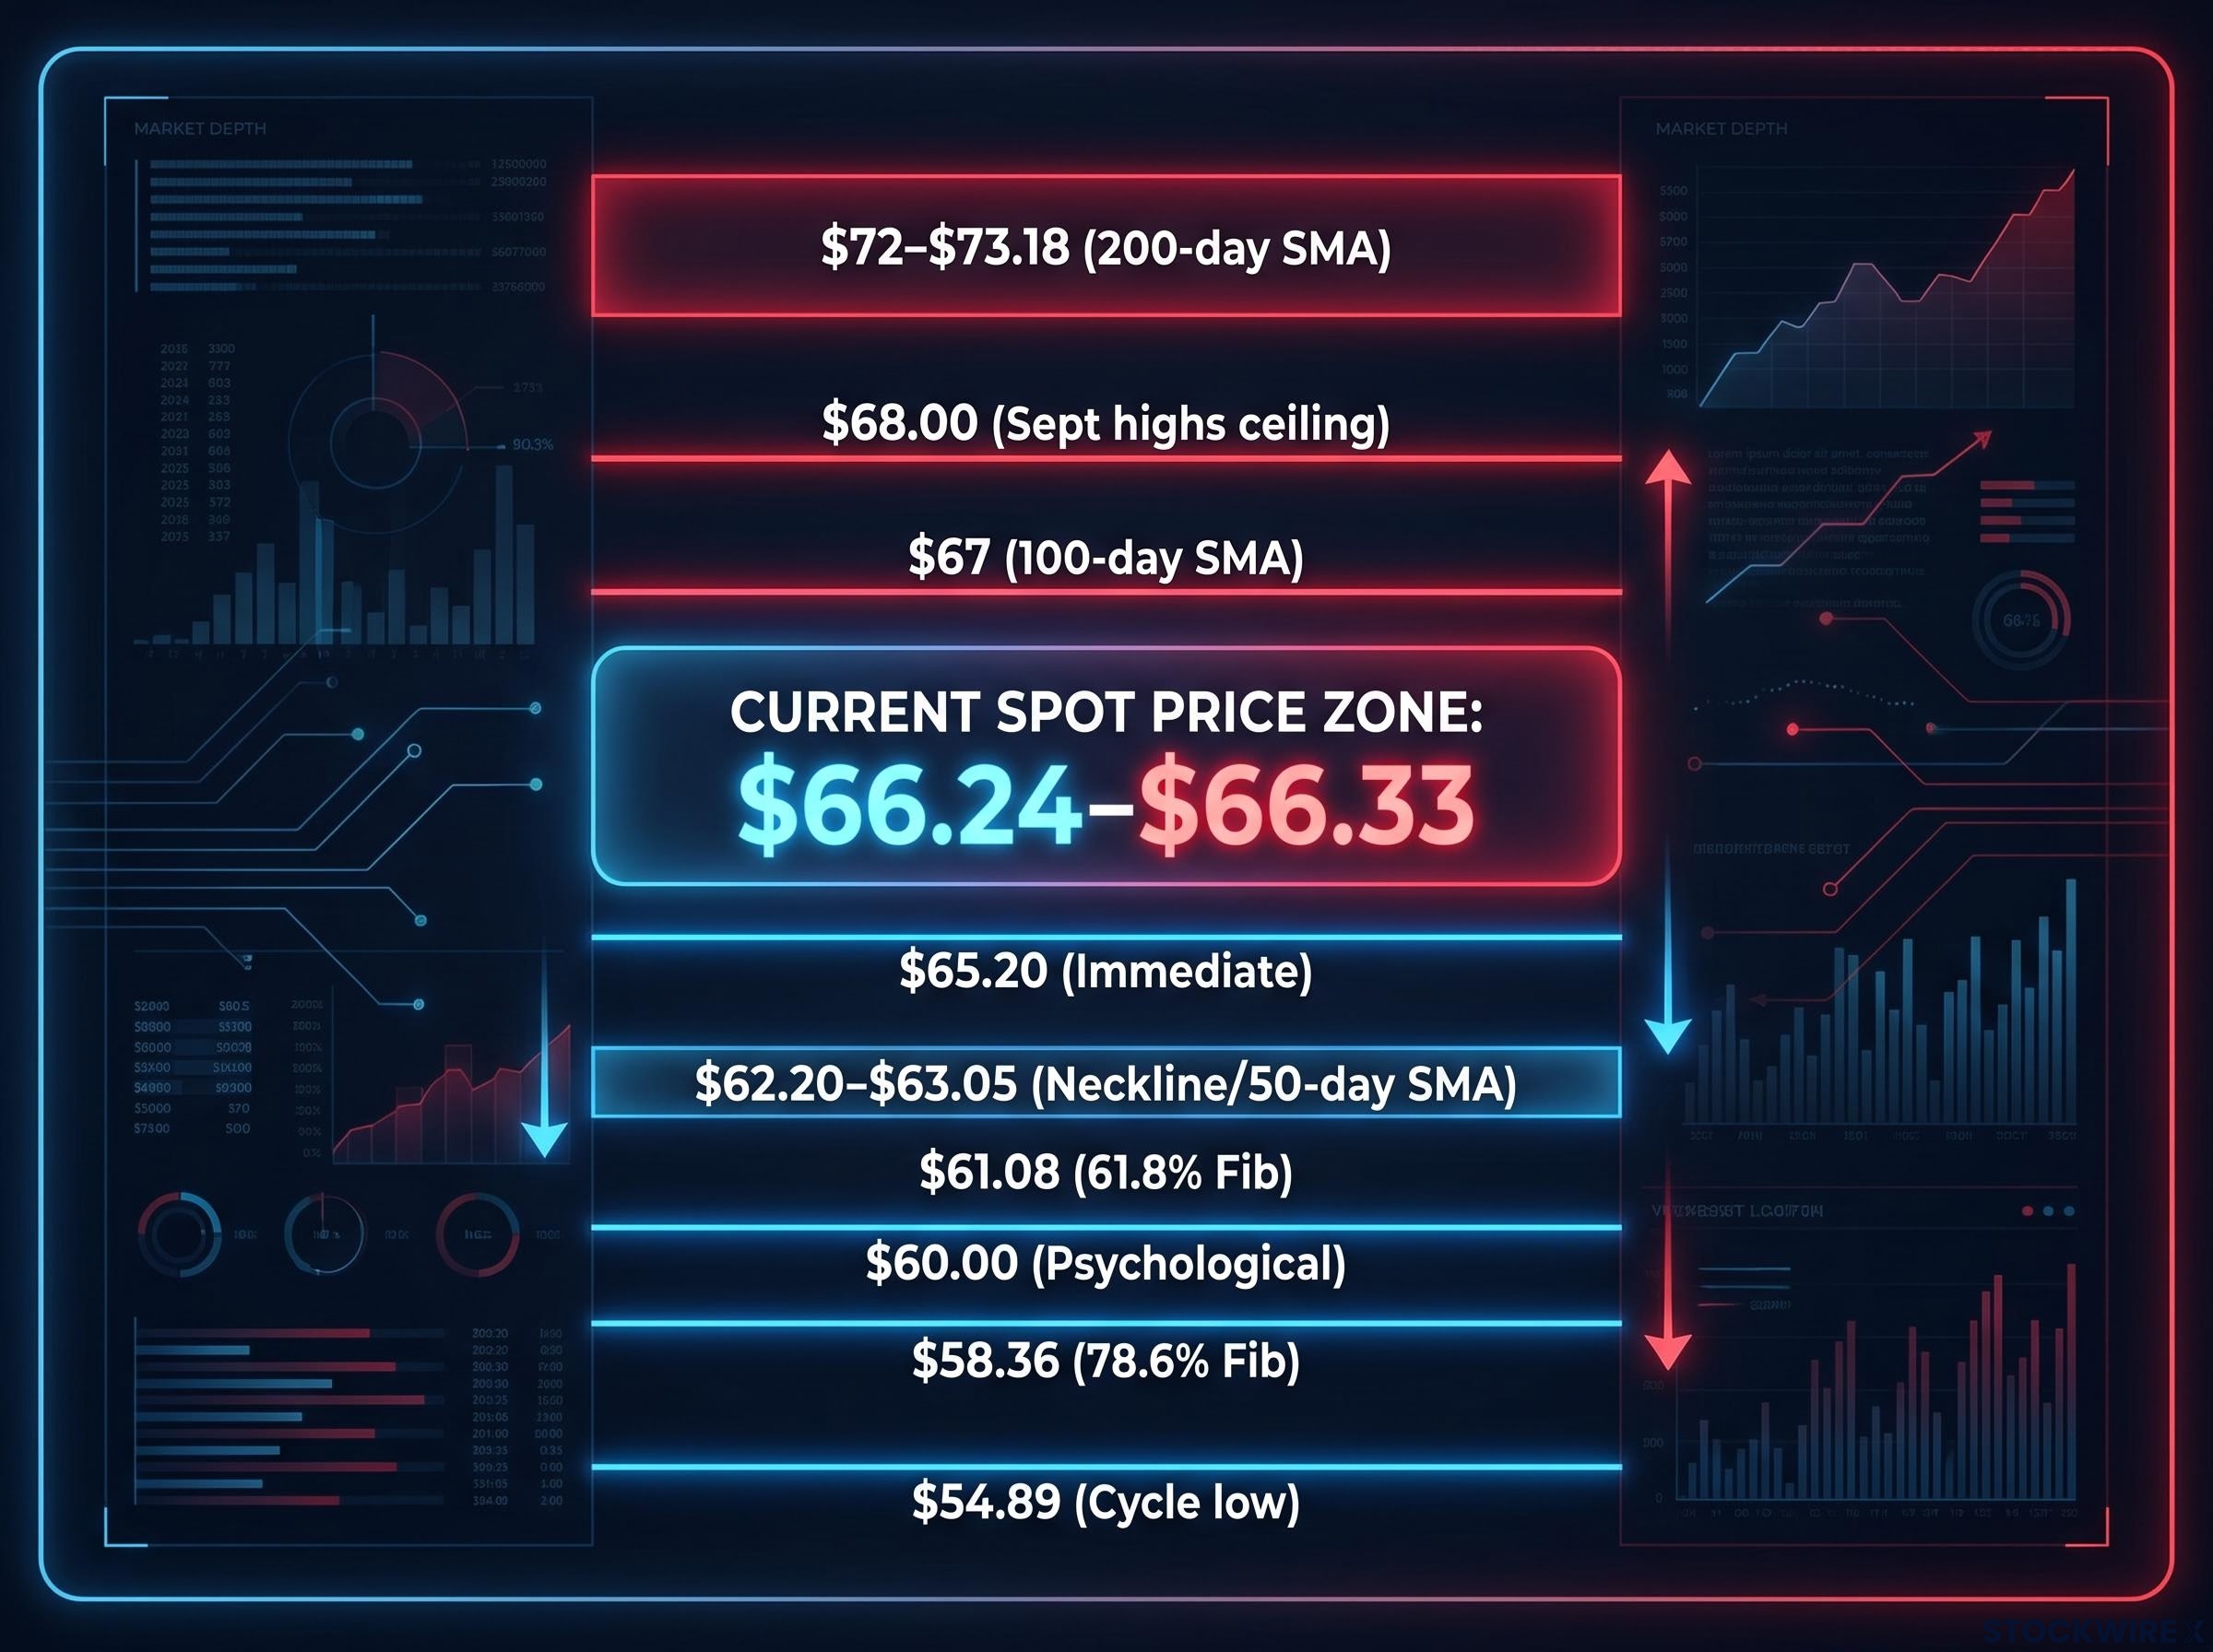
The immediate cap is the 100-day SMA near $67, the level the metal is currently pressing against. Just above that is the $68.00 ceiling that rejected the September 4 and September 9 highs. And well above sits the 200-day SMA at $73.18, per FXStreet’s daily analysis, with Mitrade approximating it near $72. That gives you a stacked resistance band running from $67 to $73.18.
| Level | Price Zone | Significance |
|---|---|---|
| 100-day SMA | ~$67 | Immediate cap; metal currently trapped below it |
| September highs ceiling | $68.00 | Rejected September 4 and September 9; key breakout trigger |
| 200-day SMA | $73.18 | Next major topside target on a breakout |
| Neckline / support pivot | $62.20-$63.05 | Head and Shoulders neckline; bullish case fulcrum |
| Cycle low | ~$54.89 | Most distant bearish objective |
The momentum picture offers no conviction to lean on. Daily RSI is hovering near 55-56, moderate but nowhere near bullish. MACD sits marginally below zero, and ADX is around 17, which signals a weak, non-directional trend rather than a fresh impulse move.
The honest read is that the burden of proof sits entirely with the bulls. Silver must clear $68.00 on a closing basis before the technical picture shifts from a cautious bounce to a credible uptrend.
The support floor and what happens if it cracks
Below current price, the fulcrum is the $62.20-$63.05 neckline zone. This is where a bearish Head and Shoulders pattern on the daily chart has its neckline, a pattern in which price forms three peaks with the middle one highest, and a break below the connecting line typically signals further downside. Hold this zone, and the bullish case stays alive. Break it, and the pattern’s downside sequence activates.
Head and Shoulders completion rates under bull-market conditions reach 81% once neckline breaks confirm on volume, but the pattern’s baseline win rate sits at just 52.8% without volume and trend filters applied, which is why the $62.20 neckline in isolation is insufficient confirmation of the downside sequence.
Treat these as the levels where the trade thesis changes, in order:
- $65.20 breaks first, the immediate support.
- $63.00-$63.05 neckline (38.2% Fibonacci retracement) gives way, activating the Head and Shoulders breakdown.
- $62.20 falls, the two-month range low and 50-day SMA.
- $61.08 (61.8% Fibonacci) is next.
- $60.00 psychological round number.
- $58.36 (78.6% Fibonacci).
- $54.89 cycle low, the most distant bearish target.
This is not a prediction. It is a risk map. Knowing where each floor sits lets you structure a position with defined logic rather than reacting after the fact.
Is this bounce built to last? Silver’s industrial identity and how it behaves in tightening cycles
To judge whether this bounce holds, you have to drop the mental model of silver as a smaller, cheaper version of gold. It is a hybrid, and that changes how tightening cycles play out for it.
Silver carries a dual identity. It is a monetary metal, like gold, but it is also an industrial commodity with heavy demand from electronics and solar photovoltaics. That industrial layer gives it a higher beta to global growth expectations than gold carries.
This creates competing forces in the current cycle:
- Industrial demand sensitivity: manufacturing and solar demand tie silver to real economic activity, not just monetary policy.
- Higher volatility: silver amplifies moves in both directions relative to gold during tightening phases.
- Thinner market liquidity: a smaller market makes it more susceptible to sharp positioning-driven swings.
- More elastic supply: silver’s supply responds more readily to price signals, adding variability at cycle turns.
Higher real yields hurt the monetary component. But if the market reads the hiking cycle as engineering a soft landing rather than crushing growth, industrial demand expectations can partly offset that headwind. History shows the deciding variable is growth expectations, not the rate level alone.
NBER research on monetary policy and commodity prices establishes that real interest rate changes affect commodity inventories and spot prices through the carry cost channel, providing academic grounding for why silver’s yield sensitivity is structurally consistent across tightening cycles rather than specific to this episode.
The lesson from the taper tantrum During the 2013-2014 taper tantrum, rising real yields and a stronger dollar drove silver sharply lower, and it underperformed gold as growth fears dominated. The metal broke below major moving averages and entered a multi-year downtrend. When tightening is read as growth-damaging, silver’s industrial layer becomes a liability, not a cushion.
The 2016-2018 cycle showed the other side: during phases of resilient manufacturing and risk-on sentiment, silver briefly outpaced gold even as rates rose. The current ADX near 17 tells you the present trend is weak, not an emerging bull phase, and history is clear that decisive breaks below major SMAs have preceded multi-month downtrends, while sustained moves above the 100-day and 200-day SMAs have marked genuine bull phases.
This week’s “sell the rumour, buy the fact” recovery echoes that pattern. Whether it lasts depends on whether the Fed’s tightening is priced as growth-compatible or growth-damaging. That verdict changes how you interpret Fed communications: it is not just the rate level, but whether the cycle is read as a soft landing, that drives silver’s industrial demand independently of the yield channel.
The levels that decide everything: what traders need to see before sizing a position
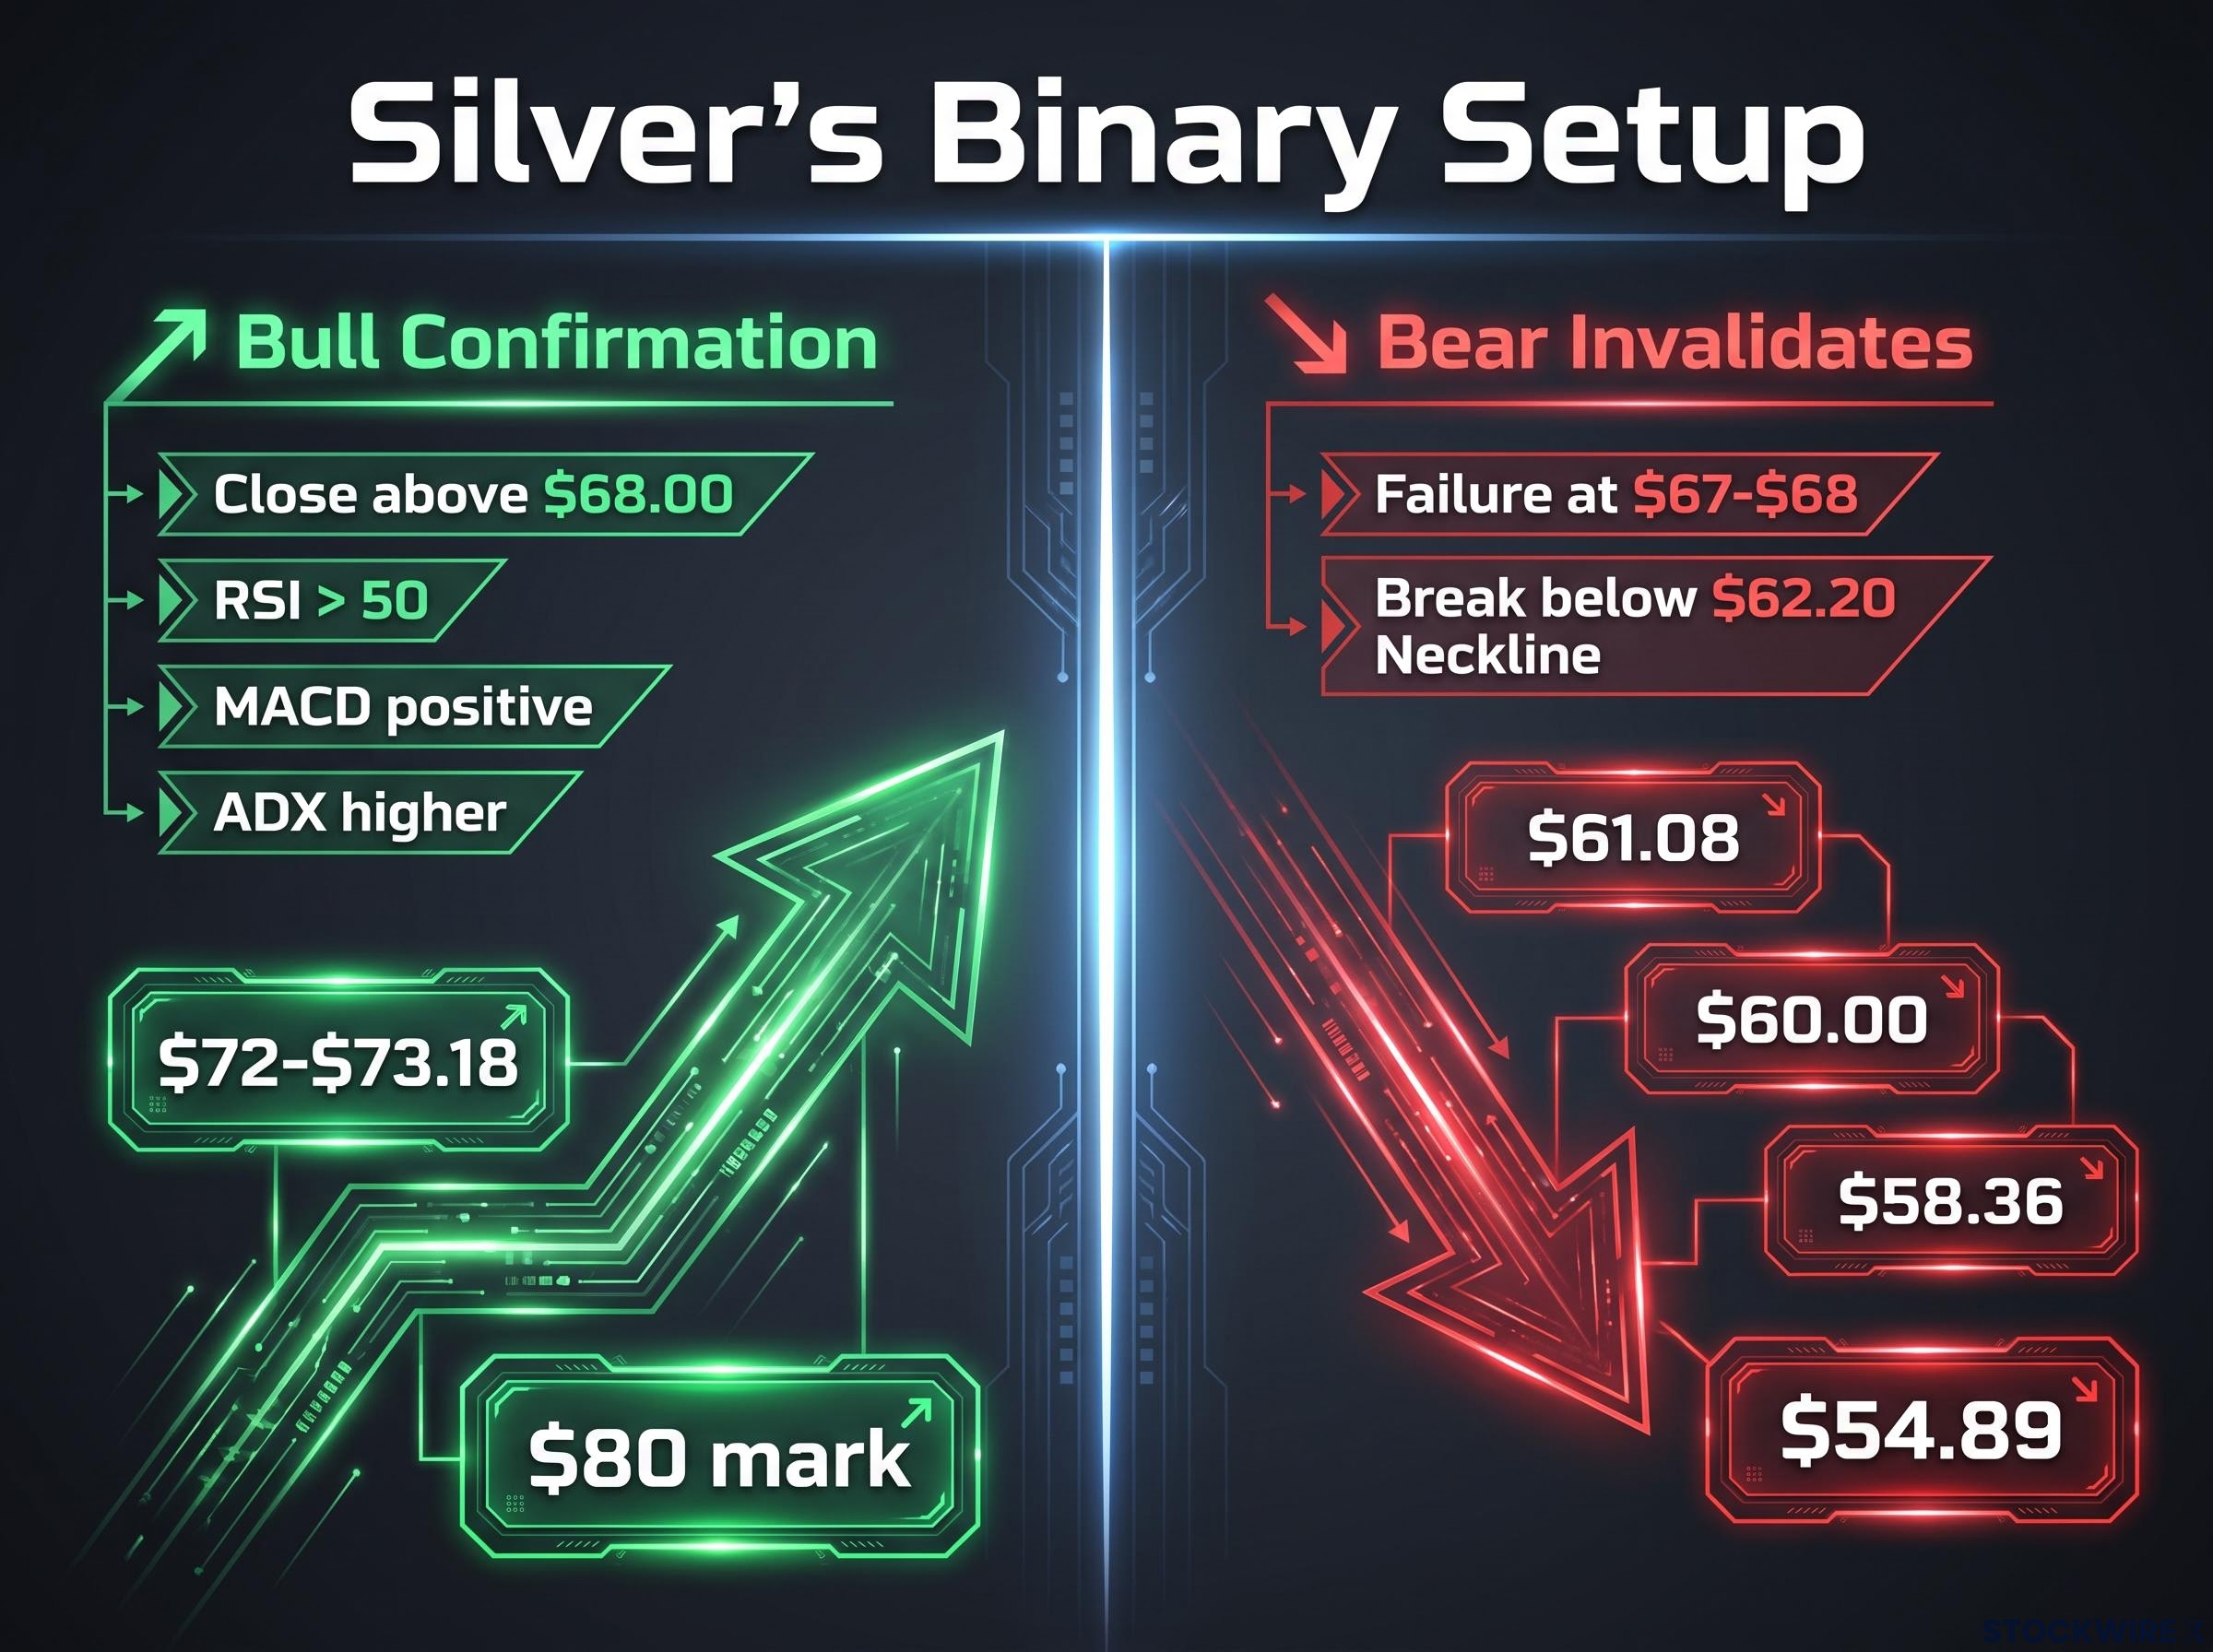
Strip away the ambiguity and silver is in a binary setup. Either it confirms the bull case or it activates the bear pattern, and the levels for each are precise.
The bull case: what confirmation looks like
For the recovery to become a credible uptrend, the metal needs to clear its overhead stack in sequence:
- A sustained daily close above $68.00, the first genuine confirmation that resistance has broken.
- RSI holding above 50, MACD turning positive, and ADX beginning to trend higher to show the move has real traction.
- A push into the $72-$73.18 resistance band where the 200-day SMA sits.
- A full breakout above all major moving averages, opening the extension toward the $80 mark.
Without those momentum conditions accompanying the price move, any break above $68.00 risks being another false start.
Volume confirmation on breakouts is the filter that separates a false start at $68.00 from a genuine trend change: valid breakouts typically require volume of at least 1.5 to 2 times the 20-day average on the breakout bar, and without that participation, an RSI near 55 and MACD marginally below zero provide no reliable signal.
The bear case: what invalidates the bounce
The downside sequence activates if silver fails at the $67-$68 zone and breaks lower:
- Failure below $62.20, breaking the neckline and confirming the Head and Shoulders pattern.
- $61.08 (61.8% Fibonacci) gives way.
- $60.00 psychological support breaks.
- $58.36 (78.6% Fibonacci) falls.
- A slide toward the $54.89 cycle low, the measured-move destination in context of the broader support ladder.
The honest read for a trader is that this is a decision zone. Confirmation or rejection in the next one to two sessions will define the trade for weeks, and the macro calendar, not just the chart, is what tilts the probability.
The macro override: what the next inflation print changes
The upcoming US inflation release is not just another data point. It is the single variable most likely to move the yield lever that drove this entire recovery. The two scenarios are clean. A hot print revives tightening expectations, pushes yields up, firms the dollar, and puts the bounce at risk. A soft print extends the relief trade, keeps yields contained, and strengthens the bull case. Watch $68.00 for the bull trigger and $62.20 for the bear trigger, but treat the inflation data as the override that can invalidate either scenario before it plays out.
This article is for informational purposes only and should not be considered financial advice. Investors should conduct their own research and consult with financial professionals before making investment decisions. Past performance does not guarantee future results, and these statements are speculative and subject to change based on market developments.
Silver at the crossroads: what the next two weeks will reveal
Three threads define where silver goes from here. The macro catalyst is a yield retreat born of Fed hike relief, not a policy pivot. The technical structure is resistance-heavy overhead with a live bearish pattern below. And the open question is whether this tightening cycle is read as growth-compatible or growth-damaging, which decides the industrial demand layer.
With spot sitting around $66.24-$66.33 as of 19 September 2026, the setup is genuinely binary and time-bounded. The next one to two weeks of price action around $68.00, paired with the next inflation print, will likely deliver a verdict that technical analysis alone cannot provide yet.
The line that matters most A sustained daily close above $68.00 is the divide between a recovery and a confirmed trend change. Below the $62.20 neckline, the bearish pattern takes over.
The Fed has signalled more tightening may follow, so the macro backdrop remains active rather than resolved. Traders who finish with a clear map of the two scenarios and their triggers are positioned to respond when resolution comes, rather than react to a partial move before confirmation arrives.
For investors wanting the full analytical framework behind how this hiking cycle is likely to play out, our dedicated guide to the Fed rate hike impact examines how inflation composition, yield curve character, and bank lending quality together determine whether a tightening cycle is absorbed smoothly or tips into a growth-damaging outcome.