Alphabet beat Wall Street’s revenue forecast by roughly $2 billion, and investors still had doubts. A day later, Microsoft reported cloud growth of 33%. The day after that, Samsung’s chip profit missed. Three big tech earnings reports in three days sent three different signals, so why did a beat feel like a worry?
The answer sits in the late October 2024 reporting cycle, which you can now view with two years of hindsight. That single week shows how markets price heavy artificial intelligence (AI) spending against the returns it produces in the near term.
It also comes with a caveat. The huge capex totals that dominated 2025 and 2026 were not known to investors at the time. Capex, short for capital expenditure, is money a company spends on long-term physical assets such as servers and buildings.
Here is a way to read any earnings cycle where growth and spending move in opposite directions, and where the headline result tells you less than you think.
Why did three earnings reports in three days send mixed signals?
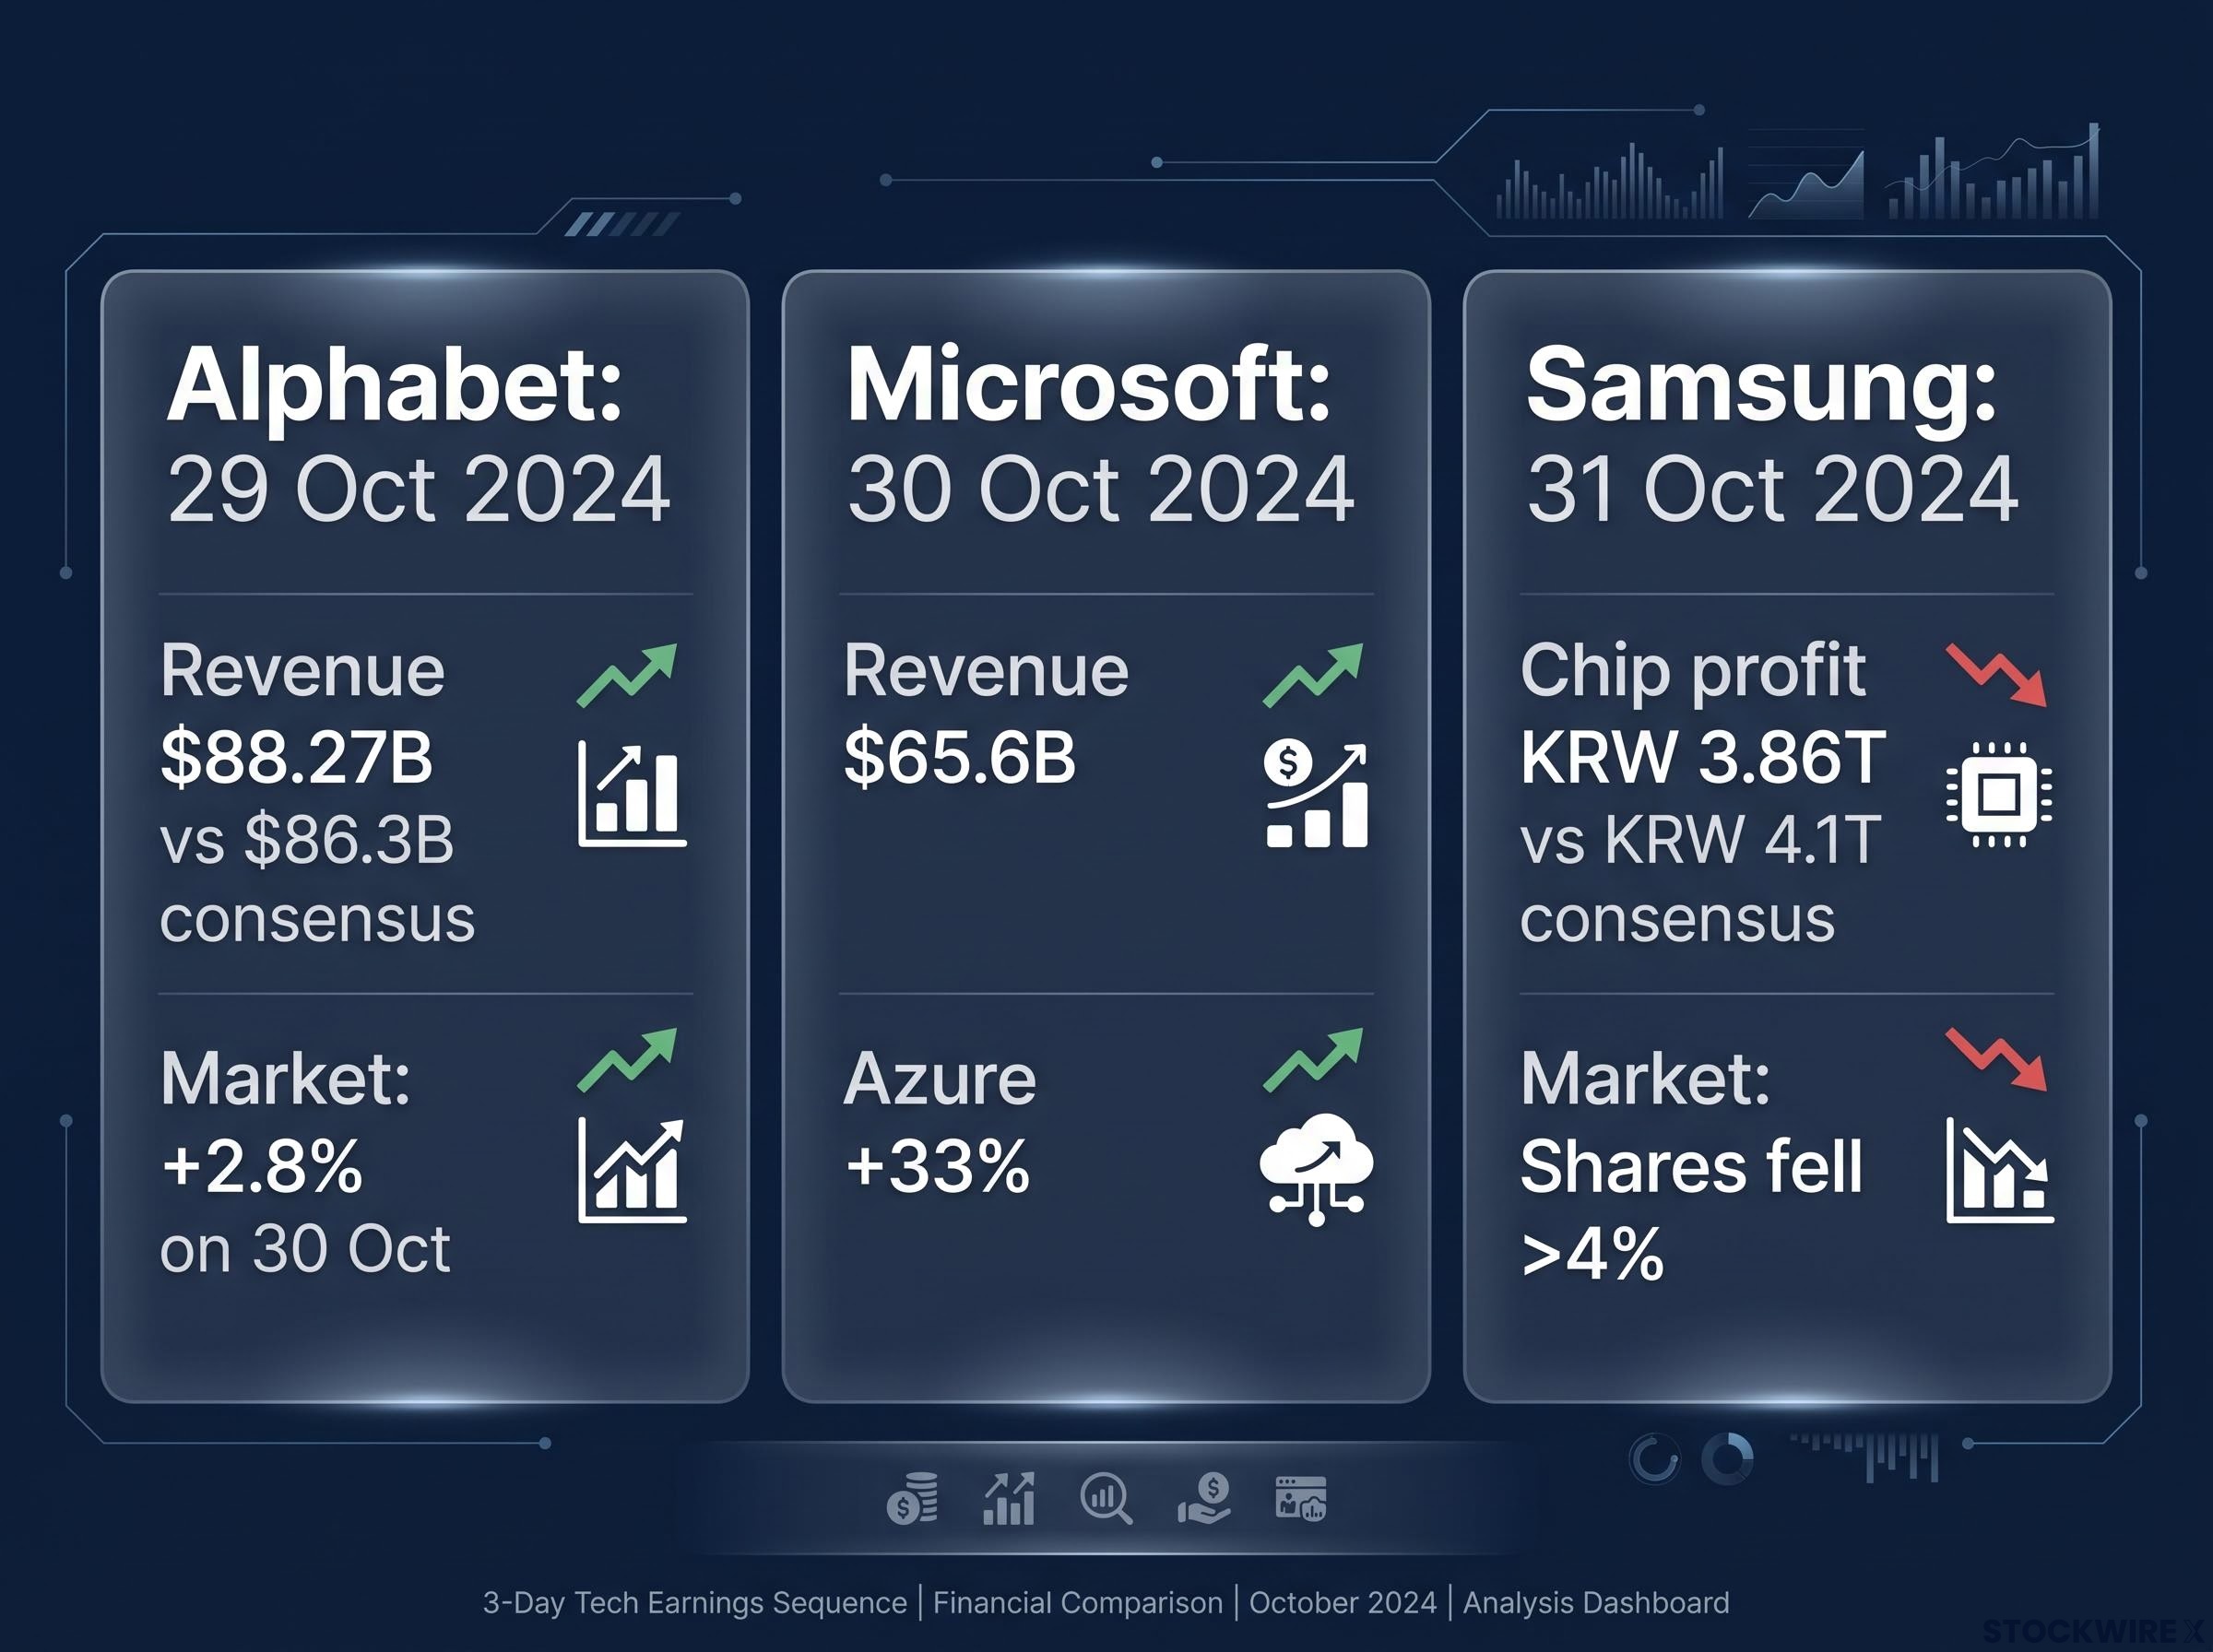
The reports landed in sequence, not together. Alphabet reported after the US close on 29 October 2024, Microsoft on 30 October and Samsung released finalised results on 31 October. Because each result arrived into a market still digesting the last, you cannot pin any single day’s move on one company.
| Company | Report date | Key result | Market reaction |
|---|---|---|---|
| Alphabet | 29 Oct 2024 | Revenue $88.27B (+15%) vs $86.3B consensus | About +2.8% in regular trading on 30 Oct |
| Microsoft | 30 Oct 2024 | Revenue $65.6B (+16%); Azure +33% | Mixed as focus shifted to AI spending |
| Samsung | 31 Oct 2024 | Chip profit KRW 3.86T vs about KRW 4.1T consensus | Shares fell more than 4% |
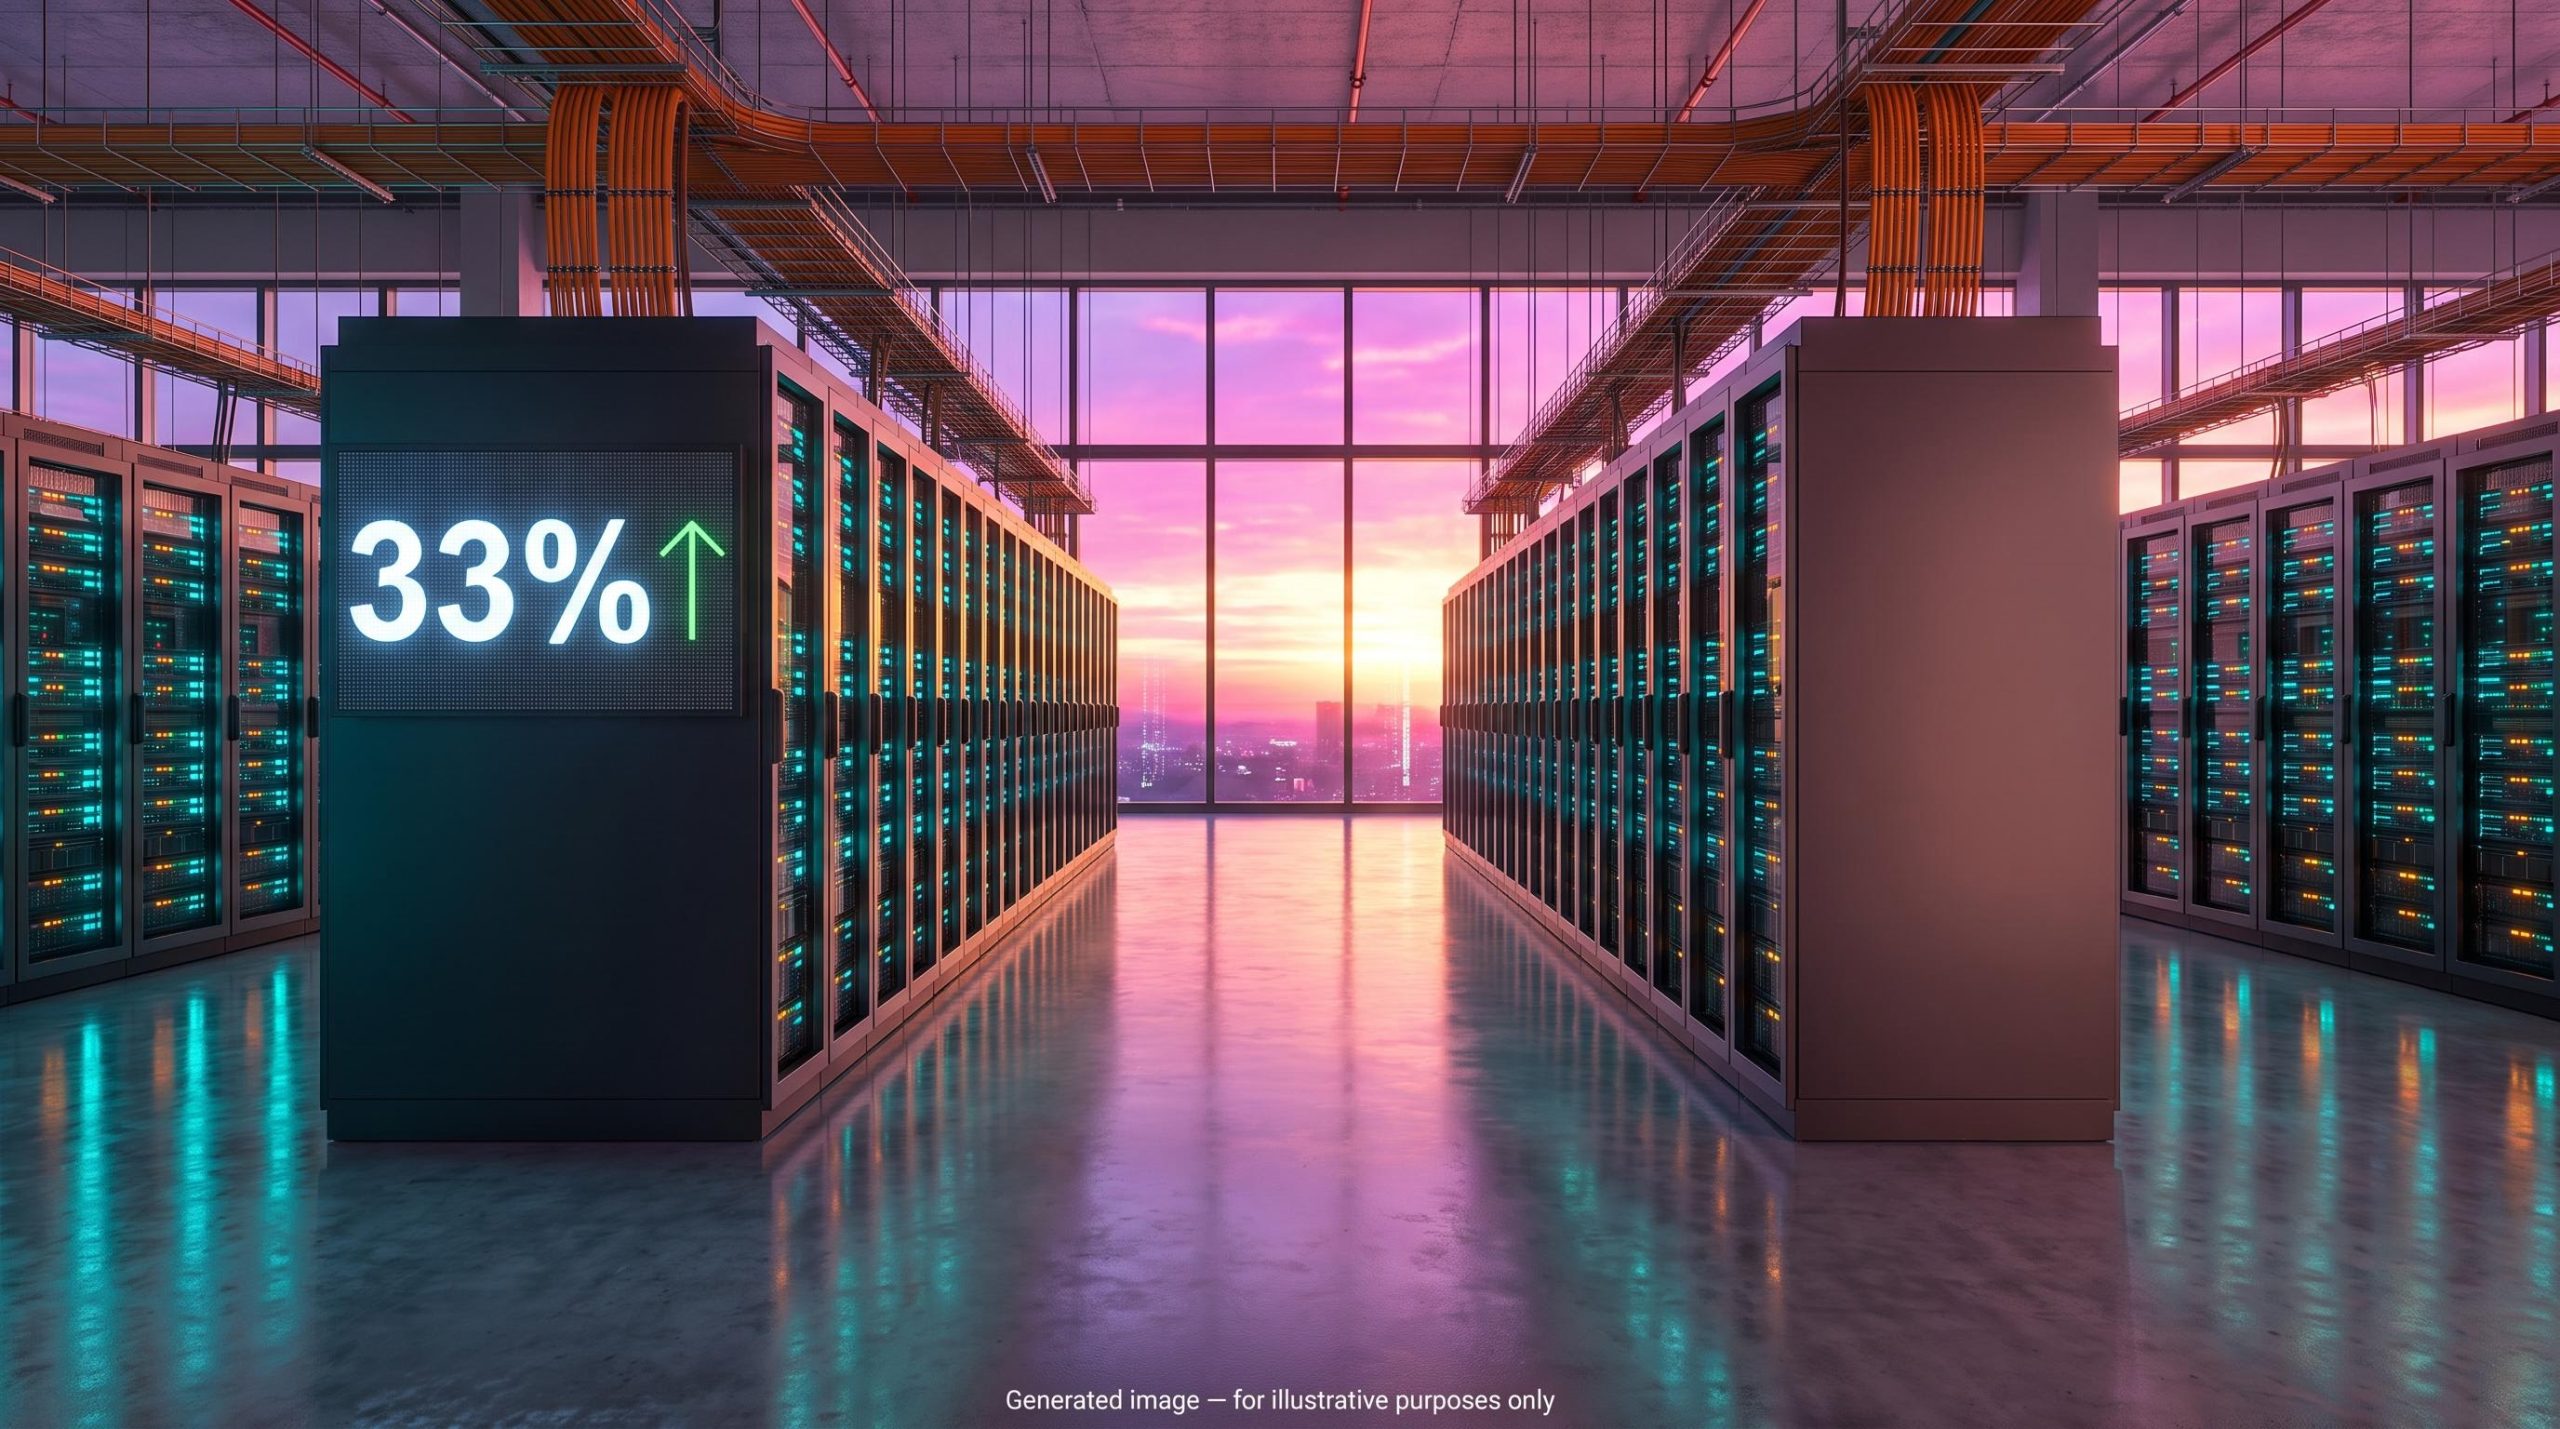
Microsoft’s Azure cloud grew 33%, or 34% in constant currency. One summary source cited a range of 23-31%, but the company release is the quarter-specific figure. According to Deutsche Bank strategists, even that strength did not fully offset the gloom from the other two.
Alphabet: a beat that still raised questions
Some coverage at the time called Alphabet’s quarter “weak”. The headline numbers say otherwise: Google Cloud revenue reached $11.35 billion, up 35%, and advertising came in at $65.85 billion.
The softness was underneath. Advertising grew about 10.4%, slower than the prior quarter, while capex jumped 62% to $13.0 billion. Spending was rising six times faster than the core business.
That is the lesson. A company can beat on revenue and still disappoint if the market expected more, so judge results against expectations and spending, not headline growth alone.
Samsung: the chip signal that cut the other way
Samsung’s total operating profit reached KRW 9.18 trillion, but the chip division fell short. The company pointed to demand for AI memory, offset by one-off costs and weaker conditions in conventional memory. For you, that meant the AI story was lifting some suppliers while leaving others behind.
The memory chip supercycle helps explain the Samsung split, since AI data centre operators now drive an estimated 70% of memory shipment volumes while conventional memory demand lags behind.
When big ASX news breaks, our subscribers know first
How do investors weigh AI spending against near-term returns?
Every investor watching that week was asking one thing: is this money being spent wisely?
To answer it, you need to see what AI does to a software company’s balance sheet. Morningstar argues AI infrastructure turns asset-light businesses into asset-heavy ones. They now own servers, power contracts and data centres, and those assets lose value each year through depreciation, an accounting charge that spreads an asset’s cost over its useful life.
That leaves one test.
The central test Will the extra revenue, margins and cash flow from AI exceed the full cost of servers, networking, power, data centres, staff, financing and depreciation?
When you read any capex-heavy result, run through these checkpoints:
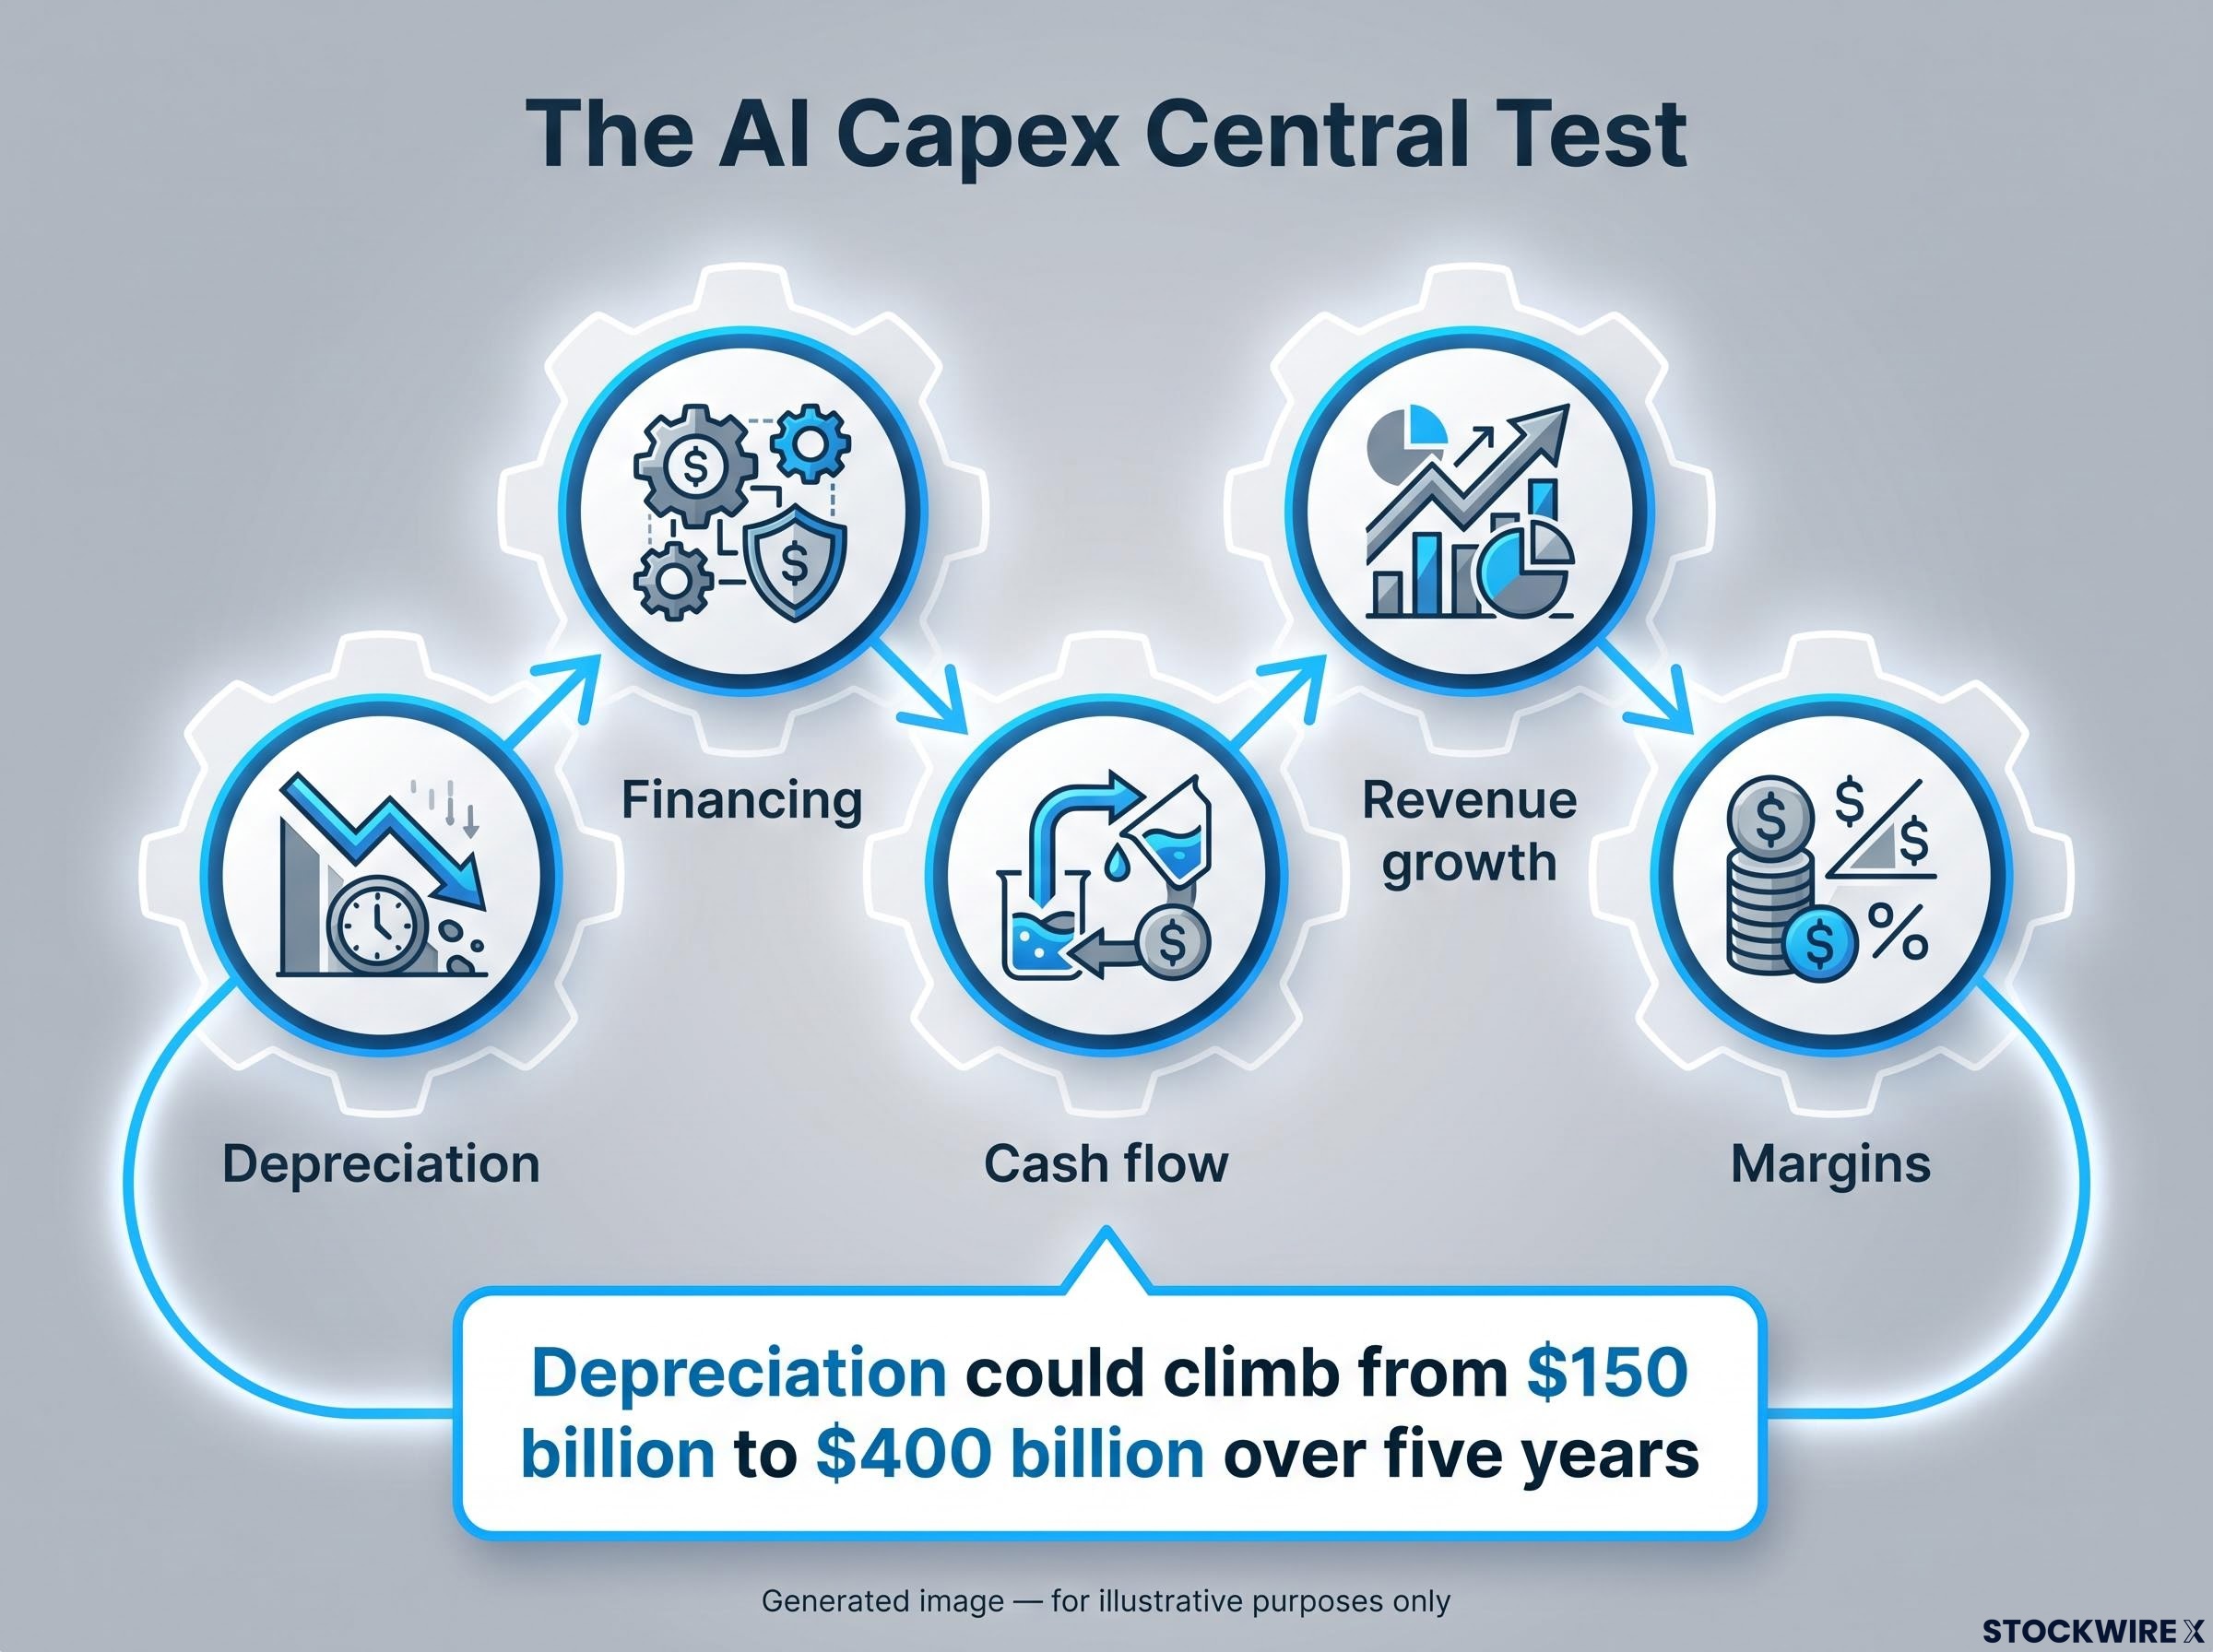
- Revenue growth: is cloud or AI revenue accelerating?
- Margins: are profits keeping pace with sales?
- Cash flow: how much of operating cash is going straight back into capex?
- Depreciation: how fast will today’s spending hit future profits?
- Financing: is the build funded from cash or debt?
The bull case
The optimists point to demand. Cloud growth of 35% at Google and 33% at Azure in October 2024 suggested spending was already converting into paying customers. Early spending can also lock in scarce capacity before competitors. Goldman Sachs economist Joseph Briggs and investor Byron Deeter have argued AI revenue and productivity gains can outrun the investment.
The sceptic case
Goldman’s Jim Covello counters that the profit pool may be too small relative to the trillions required. Morningstar warned annual depreciation could climb from about $150 billion to $400 billion over five years, and noted aggressive balance-sheet expanders have historically underperformed. In 2025, Apollo’s Torsten Slok put big tech capex at about 60% of operating cash flow, a record, according to Reuters.
You can see how far the picture has moved since 2024 by checking how much capex absorbs operating cash flow today, because PIMCO estimates the share has climbed from 33-40% in 2022-2023 to roughly 93-94% for the largest hyperscalers.
Deutsche Bank said in October 2025 the rally was not a conventional bubble but flagged overinvestment and concentration. When you see capex rising faster than revenue, ask how long the payback is and who captures it, because that gap moves the share price.
Past performance does not guarantee future results. Financial projections are subject to market conditions and various risk factors.
How does one earnings cycle ripple across Asian and European indices?
A US result travels abroad through four channels:
- US futures: a megacap beat shifts implied earnings for the Nasdaq and S&P 500 overnight.
- Supply-chain exposure: Asia hosts memory, processor and server makers.
- Chip-sector expectations: cloud growth signals compute demand; weak memory profit hints at pricing pressure.
- Index weightings and risk appetite: passive funds, ETFs and correlated suppliers can move before fundamentals change.
That is the tidy version. The real evidence is messier.
Asia: where the chip signal landed hardest
The KOSPI, South Korea’s main index, carries heavy semiconductor exposure through Samsung. That makes it the clearest case of fundamental contagion, where one company’s results change views on its peers. But even here, the numbers disagree.
| Index | Original-source move | Alternate-source move | Note on conflict |
|---|---|---|---|
| KOSPI | -1.20% (after about -3%) | -0.92% (29 Oct, CNBC); about -2.6% (31 Oct) | Likely different sessions |
| Hang Seng | +0.06% | -1.65% (29 Oct, CNBC) | Opposite direction |
| Nikkei 225 | +0.66% | +0.96% (29 Oct, CNBC) | Same direction |
| Stoxx 600 | +0.07% | -1.3% (30 Oct, Reuters) | Unreconciled |
| IBEX 35 | -1.45% | -0.36% (31 Oct) | Different dates |
The original source also recorded the CSI 300 at -1.20%, the Shanghai Composite at -0.93% and the ASX 200 at +0.45%. The CNBC closes predate Samsung’s 31 October result, so those moves cannot be blamed on Samsung.
Europe: earnings, energy and macro noise
Attribution is weakest here. The original source blamed rising energy prices, while Reuters linked the 30 October fall to bleak earnings and macro uncertainty, including the US election, rather than Alphabet alone. That is positioning and macro contagion, not a single result at work.
Be cautious of any headline that credits one company for a whole market’s day.
What did later spillover episodes reveal about the pattern?
Everything in this section happened after October 2024. Investors at the time had none of it. Watch how the same logic keeps returning.
| Episode | Trigger | Market effect |
|---|---|---|
| DeepSeek, 27 Jan 2025 | Low-cost Chinese AI model challenged chip-spending assumptions | Nasdaq -3.1%; Nvidia about -17% (about $593B); more than $1T lost across chip, power and data-centre stocks |
| DeepSeek rebound, 28 Jan 2025 | Reassessment that cheaper AI may expand demand | Nasdaq futures about +0.5%; European tech about +1% premarket |
| July 2025 | Stronger Azure and cloud results | Record spending plans read more favourably |
| October 2025 | Mixed big tech earnings | Alphabet favoured; Microsoft and Meta pressured (Reuters) |
Each time, the market repriced the same ratio.
The recurring pattern When cloud growth, margins or cash flow validate spending, global tech shares rise together. When results hint at slower payback, the connected structure amplifies the fall.
What changed was the size of the bet. Reuters put combined 2025 capex at Microsoft, Amazon, Alphabet and Meta at about $350 billion, with more than $630 billion expected for 2026. Alphabet alone guided to $175-185 billion for 2026, against $91.45 billion in 2025. These figures come from different reports and are not strictly like-for-like.
The $13 billion quarter that worried investors in 2024 now looks small. Because the repricing keeps recurring, you can treat each earnings season as a fresh test of whether spending is being validated.
The 2026 hyperscaler capex projections now sit near $725 billion across Amazon, Microsoft, Alphabet and Meta, and the mix of debt and cash funding that spending is a key part of the payback question.
These statements are speculative and subject to change based on market developments and company performance.
What are the risks and limits of reading earnings this way?
Recognising a pattern is useful. Trusting it blindly is not. The main risks:
- Bubble risk: high valuations and concentration, even with stronger fundamentals than past bubbles.
- Depreciation burden: short-lived AI equipment piles up costs on future income statements.
- Uncertain ROI timing: capacity may arrive years before customers pay enough for it.
- Overcapacity: simultaneous buildouts could push cloud prices down.
- Free-cash-flow pressure: Reuters reported hyperscalers could spend more on capex than they generate in free cash flow by 2027 under consensus estimates.
- Concentration: Reuters said DeepSeek exposed how much indices rely on a handful of megacaps.
- Technological substitution: cheaper models could need less costly hardware.
The other side remains valid: early spending can be rational if it secures capacity and lowers unit costs. Benchmark’s Cody Acree warned in January 2025 that investors may have priced in an unrealistically profitable, hardware-intensive version of AI demand.
Where the evidence is thin
The index data conflicts across sessions, and this retrospective benefits from hindsight that nobody had in 2024. No authoritative combined capex total was published during the October 2024 cycle either. Treat any single quarter’s reaction as one data point in a longer cycle, and weigh it against cash flow and concentration in your own holdings.
Reading the next earnings cycle with a clearer lens
Three habits carry over to any reporting season. Judge results against expectations, not headlines. Test spending against cash flow. Treat regional index moves with attribution caution.
The framework works best as a set of questions. Next time, check:
- Cloud growth: is demand keeping pace with the build?
- Capex guidance: is spending accelerating faster than revenue?
- Cash flow: how much is left after investment?
- Chip pricing: are suppliers sharing in the gains?
If those four line up, spending is being validated. If they diverge, you now know why a beat can still unsettle the market.
This article is for informational purposes only and should not be considered financial advice. Investors should conduct their own research and consult with financial professionals before making investment decisions.